

Abstract
Context
The adipokine leptin facilitates long-term potentiation and synaptic plasticity in the hippocampus, promotes β-amyloid clearance and improves memory function in animal models of aging and Alzheimer’s disease (AD).
Objective
To relate baseline circulating leptin concentrations in a dementia-free community-based sample prospectively to 1) incident dementia and AD during follow-up and 2) to MRI (magnetic resonance imaging) measures of brain aging in survivors.
Design, Setting and Participants
Plasma leptin concentrations were measured in 785 dementia-free persons (mean age 79 [SD, 5 yrs], 62% women) from the Framingham Original cohort at the 22nd examination cycle (1990–1994). A sub-sample of 198 dementia-free survivors underwent volumetric brain MRI between 1999 and 2005, approximately 7.7 years after leptin was assayed. Two measures of brain aging, the total cerebral brain volume (TCBV) and temporal horn volume (THV; inversely related to hippocampal volume) were assessed.
Main outcome measure
Incidence of dementia and AD during follow-up till December 31st, 2007.
Results
During a median follow-up of 8.3 (range 0 to 15.5) years, 111 participants developed incident dementia, 89 had AD. Higher leptin levels were associated with a lower risk of incident dementia and AD in multivariable models (hazard ratios [HR] per one-SD increment in log-leptin were 0.68 [0.54–0.87] for all-cause dementia and 0.60 [0.46–0.79] for AD). This corresponds to an absolute AD risk over a 12 year follow-up of 25% for persons in the lowest quartile (Q1) versus 6% for persons in Q4 of sex-specific leptin levels. In addition, a one SD elevation in plasma leptin was associated with higher TCBV and lower THV, although the association of leptin with THV did not reach statistical significance.
Conclusions
Circulating leptin is directly related to indices of brain health in asymptomatic adults and inversely related to risk of incident dementia and AD. Our findings require confirmation in independent samples.
Keywords: leptin, adipokines, dementia, Alzheimer’s disease
Dementia is increasingly recognized as a life course illness wherein a variety of lifestyle choices interact with genetic, vascular and other risk factors to impact risk of disease.1 Given the rapid aging of developed and developing societies it is projected that the prevalence of dementia will dramatically increase over the next five decades.2 It is, therefore, a public health priority to explore pathophysiological pathways underlying the development of dementia and its most common cause, Alzheimer’s disease (AD).
A constellation of novel risk factors that have received increased attention in the past decade include indices of midlife obesity (overall and central obesity), diabetes, metabolic syndrome and insulin resistance. Prospective studies have shown that overweight and obesity in mid-life are associated with poorer cognitive function in the general population,3 and an increased risk of incident dementia.4 The mechanisms underlying these associations are incompletely understood. Leptin, an adipokine that is produced in subcutaneous and visceral adipose tissue, is a plausible biological mediator; its physiological role appears to include signaling long-term caloric intake and fat stores to the hypothalamus, thereby modifying food consumption and energy activity.5 However, another emerging role for leptin, one that may permit survival under conditions of limited food availability, is the facilitation of memory processes. Recent evidence confirms that leptin exerts additional functions on the brain outside the hypothalamus, in particular in the CA1 region of the hippocampus, an area integral to learning and memory.6 Mice with targeted disruption of the gene encoding the leptin receptor showed diminished long-term potentiation7 (a physiological correlate of memory formation8), decreased synaptic plasticity, and poorer performance on spatial memory tasks.7
Although midlife obesity is associated with an increased risk of AD, late-life weight loss is known to precede the onset of clinical AD.9 Because leptin promotes weight loss, elevated leptin levels might be expected in the early stages of AD. Surprisingly, however, in a recent small case-control study, leptin levels were observed to be low in persons with AD compared to controls or to persons with vascular dementia,10 again suggesting that higher leptin concentrations may reduce the risk of AD. However, this cross-sectional study could not clarify if the lower leptin levels preceded the development of clinical AD and there have been no prospective studies examining this association.
In the prospective Framingham study, participants have been evaluated with anthropometric and laboratory measures for decades, followed for incident dementia and AD and examined with volumetric brain magnetic resonance imaging (MRI) while they were free of dementia. We related baseline plasma leptin concentrations prospectively to incident dementia and AD, and, in survivors, to a single measurement of total cerebral brain volume (TCBV), and of the temporal horn volume (THV, a surrogate measure inversely related to hippocampal volume)11,12, both recognized markers of early AD pathology and subsequent dementia risk.13,14
Methods
Study sample
Details of the recruitment and phenotyping of the Framingham Study Original cohort have been described in detail elsewhere.15 The study was initiated in 1948 to identify risk factors for heart disease in the community. A total of 5209 participants were included and participants are seen in the Heart Study research clinic approximately every two years, where a detailed medical history is obtained and all traditional cardiovascular risk factors are measured. Of 1,060 dementia-free persons who attended the 22nd examination cycle and were subsequently followed for incident dementia till December 31, 2007 leptin levels were measured in 785 participants. In our study sample, participants who did not have leptin levels measured were significantly older than those with leptin measured. However, after adjustment for age, participants without and with leptin levels did not differ with respect to their baseline clinical or biochemical characteristics (online supplementary Table 1).
A subset of 198 individuals (33% of individuals surviving till 1999) underwent volumetric brain MRI between 1999 and 2005. The 406 individuals who survived till 1999 but did not undergo brain MRI either declined consent, had a contraindication to brain MRI (such as claustrophobia or a cardiac pacemaker), did not attend an on-site study examination between 1999 and 2005 or died before the MRI could be obtained. However, their clinical and biochemical characteristics did not differ substantially from those with available MRI (online supplementary Table 2). In addition, we excluded from our analyses 16 persons who developed clinical stroke (n=11) or dementia (n=4) or both (n=1) prior to the date of MRI, and 4 persons with neurological conditions (such as a brain tumor) that would affect the assessment of brain MRI measures. At examination cycle 22, the CES-D (Center for Epidemiologic Studies Depression) scale was administered, which is an established tool to screen for depressive symptoms in community-based samples.16 The study protocol was approved by the Institutional Review Board of the Boston University Medical Center and all participants provided written informed consent.
Leptin Assay
A commercial radioimmunoassay (Linco Research, Inc., St. Louis, MO) was used to determine leptin concentrations at the 22nd examination cycle (1990–1994) from non-fasting plasma samples. The inter-assay coefficient of variation ranged from 3.0–6.2%.17 The lower sensitivity limit of the assay was 0.5 ng/ml.
Brain imaging
The imaging parameters, measurement protocols and reproducibility of these measures have been described in prior publications.18 MRIs were obtained with a Siemens Magnetom 1 tesla field strength machine using a double spin-echo coronal imaging sequence of 4 millimeter contiguous slices from nasion to occiput. Imaging analyses was performed at a central location (CD) using a custom designed image-analysis package QUANTA 6.2, operating on a Sun Microsystems Ultra 5 workstation.19 Brain images were evaluated by experienced clinicians who were blinded to the participants’ demographic, anthropometric and clinical data including leptin concentrations. Lobar and ventricular volumes were computed by rotating the images into anatomical standard space and subsequent operator-defined outlining of the individual lobes using standard anatomical landmarks. Since the hippocampus comprises the medial wall of the temporal horn, shrinkage of the hippocampus results in enlargement of the temporal horn. Intra and inter-rater correlations using this method were high.18,20 Manual outlining of the intracranial vault and subsequent mathematical modeling was used to determine total brain parenchymal volume above the tentorium. TCBV was calculated as the ratio of total brain parenchymal volume to total intracranial volume, thus adjusting for head size. THV was also converted to a ratio over total intracranial volume and log-transformed to normalize the distribution. The THV of the lateral ventricles served as a surrogate marker inversely related to hippocampal volume.11,21 We used this surrogate marker since direct measures of hippocampal volume were not available in all participants.
Clinical definition of dementia and AD
All participants of the Framingham study are under continuous surveillance for impairment in cognitive function and dementia. We have previously outlined our screening and surveillance methods for the detection of incident dementia in the Framingham Original cohort.22,23 Briefly, surviving cohort members who were deemed to be free of incident dementia based on a standardized neuropsychological test were followed with a biennial history, physical examination and an administration of the Folstein mini-mental state examination (MMSE). Participants who were suspected to have possible cognitive decline based on the MMSE score, self, physician or family referral, telephone health status update or records linkage underwent an in-depth evaluation that included neurologic and neuropsychological evaluations.
We determined whether each person fulfilled criteria for a diagnosis of dementia, the probable date of onset and type of dementia at a consensus review by a panel comprising at least one behavioral neurologist and one neuropsychologist. The panel reviewed all available records including examinations by FHS investigators (ZST, RA, SA, SS, PAW), hospital and nursing home records, data from structured family interviews, imaging and when available autopsy data. Participants with dementia met criteria outlined in the Fourth edition of the Diagnostic and Statistical Manual of Mental Disorders (DSM-IV) criteria,24 and were required to have symptoms for at least 6 months. Participants with AD met National Institute of Neurological and Communicative Diseases and Stroke/Alzheimer’s Disease and Related Disorders Association criteria for definite, probable or possible AD.25 For the present analyses, data for incident dementia obtained till December 31st, 2007 were used.
Statistical analyses
Circulating leptin levels were significantly higher in women and had a right skewed distribution in each sex. Hence, leptin levels were first natural logarithmically transformed and then standardized within each sex (mean=0, SD=1). Cox regression models were used to relate baseline sex-standardized log-leptin levels to the incidence of dementia and AD after confirming that the assumption of proportionality of hazards was met. Because the risk of dementia is more likely to change as a function of age than of calendar time, age was used as the time scale, except for the figure, where calendar time was displayed on the x-axis to facilitate interpretation. Initial analyses were adjusted for age- and sex alone (Model A). Model B additionally adjusted for two major risk factors for dementia in our cohort, i. e. a high plasma homocysteine (value in the top age-specific quartile), and presence versus absence of an APOE- ε4 allele. In Model C, we additionally adjusted for other potential confounders, including the waist-to-hip ratio (WHR) and systolic blood pressure which were treated as continuous variables and presence or absence of antihypertensive treatment, diabetes, smoking and atrial fibrillation at baseline. We chose not to include both WHR and body mass index (BMI) in the same model due to marked colinearity between these two variables, and selected WHR as the preferred metric of body fat content and distribution because it is more strongly correlated with plasma leptin levels,26 with midlife cognitive function in the Framingham Offspring cohort,3 and with the subsequent risk of AD in other cohorts.27 In additional analyses, we replaced WHR by BMI in the multivariable-adjusted models. We also tested for effect modification by obesity (BMI≥30 kg/m2) of the association between leptin and dementia by including a leptin*obesity interaction term in the model and, since that interaction term was significant, we performed an analysis stratified by the presence or absence of obesity. In secondary analyses we also adjusted for change in WHR from exam 21 to the baseline exam 22 (when leptin was assayed; Model D) and also adjusted for baseline depression (defined as a CES-D score ≥16, Model E).28 Furthermore, we tested for effect modification by WHR (of the relation of leptin to incident dementia and AD) and by APOE ε4 allele by including interaction terms in our statistical models. Since the interaction with WHR was significant, we stratified our analyses by WHR, evaluating the association between leptin and incident dementia and AD separately in participants in the fourth sex-specific WHR quartile and in participants in WHR quartile 1–3. In addition, we repeated the analyses, excluding participants who were diagnosed with dementia in the first 3 years after the baseline exam to exclude reverse causality, i. e. the possibility that weight loss or other neuroendocrine changes secondary to early undetected AD changes were altering baseline leptin levels. Linear regression models were utilized to relate sex-standardized log-leptin to TCBV and to log-THV. Covariate adjustments were the same as for the Cox regression models (Models A–C). Statistical analyses were performed using SAS, version 9.1 and all statistical tests were two-sided. A p-value below 0.05 was used to indicate statistical significance.
Power estimates
We had 90% power to detect HRs of 0.55 or smaller for incident dementia comparing those with leptin levels above to those below the sex-specific median. For the regression analyses, we had 90% power to detect partial R2 values of 0.050 for TCBV and 0.055 for log(THV).
Results
Baseline characteristics of the entire study sample, and stratified by sex-specific leptin quartiles and by sex are displayed in Table 1 and in online supplementary Table 3, respectively. As expected we observed a relatively high prevalence of cardiovascular disease in our elderly sample, with increasing burden of cardiovascular disease and risk factors across leptin quartiles. Leptin levels were significantly higher in women, as shown in prior studies.29 Mean TCBV in our sample was 0.73 (standard deviation 0.03) and mean log-THV was −1.95 (standard deviation 0.71).
Table 1.
Baseline characteristics of the entire study sample (n=785) and stratified by leptin quartiles
| Leptin quartile | |||||
|---|---|---|---|---|---|
| All | 1 | 2 | 3 | 4 | |
| N | 785 | 196 | 196 | 196 | 197 |
| Women, % | 62% [490/785] | 63% [123/196] | 62% [122/196] | 63% [123/196] | 62% [122/197] |
| Age, years | 79±5 | 79±5 | 79±5 | 79±4 | 78±4 |
| Systolic BP, mm Hg | 143±21 | 144±21 | 141±20 | 143±19 | 146±23 |
| Diastolic BP, mm Hg | 72±11 | 71±12 | 71±10 | 74±10 | 74±11 |
| Body mass index, kg/m2 | 28±5 | 24±3 | 26±3 | 29±4 | 32±5 |
| BMI ≥ 30 kg/m2, % | 28% [221/782] | 3% [6/194] | 11% [22/195] | 37% [73/196] | 54% [120/197] |
| Waist-to-hip ratio, cm | 0.93±0.09 | 0.89±0.09 | 0.92±0.08 | 0.94±0.08 | 0.96±0.08 |
| Antihypertensive treatment, % | 49% [378/771] | 35% [67/194] | 49% [96/189] | 50% [96/193] | 63% [122/195] |
| Current smoking, % | 8% [68/782] | 14% [28/196] | 9% [17/195] | 7% [13/195] | 4% [7/196] |
| Diabetes, % | 12% [94/785] | 9% [17/196] | 8% [16/196] | 12% [24/196] | 19% [37/197] |
| History of atrial fibrillation, % | 9% [70/785] | 9% [18/196] | 10%[ 19/196] | 8% [15/196] | 9% [18/197] |
| History of CVD, % | 31% [240/785] | 27%[53/196] | 28% [55/196] | 34% [66/196] | 34% [66/197] |
| Biochemical features | |||||
| Total/HDL cholesterol, mg/dL | 4.5±1.5 | 3.9±1.3 | 4.6±1.5 | 4.7±1.5 | 5.0±1.6 |
| Leptin, ng/ml, median (range), Women | 17.3 (2.4–84.1) | 7.4 (2.4–10.6) | 14.5 (10.7–17.3) | 22.5 (17.4–28.6) | 38.0 (28.8–84.1) |
| Leptin, ng/ml, median (range), Men | 7.2 (1.1–60.6) | 3.6 (1.1–4.5) | 5.6 (4.6–7.2) | 8.9 (7.2–11.4) | 14.3 (11.6–60.6) |
| Homocysteine, μmol/L, median (range) | 11.0 (3.5–41.9) | 10.0 (4.1–35.5) | 11.3 (3.5–40.0) | 11.4 (5.1–29.3) | 11.0 (4.9–41.9) |
| Serum creatinine concentration, mg/dL | 0.9±0.2 | 0.9±0.2 | 0.9±0.2 | 0.9±0.2 | 1.0±0.2 |
| Other covariates | |||||
| High school graduate, % | 69% [530/767] | 69% [134/194] | 68% [130/192] | 71% [136/192] | 69% [130/189] |
| CES-D scale | 7.1±7.5 | 6.7±7.2 | 7.3±7.3 | 7.1±7.8 | 7.2±7.6 |
| APOE ε4 genotype: ≥ 1 APOE ε4 allele, % | 20% [153/753] | 28% [54/189] | 18% [34/189] | 23% [44/192] | 12% [23/145] |
Abbreviations: BP, blood pressure; CES-D, center for epidemiologic studies depression scale; CVD, cardiovascular disease; HDL, high-density lipoprotein; APOE, apolipoprotein E; Log, natural-logarithmically transformed.
Data are percent for binary traits and mean±SD for continuous traits; except as noted
Association of leptin with incident dementia and Alzheimer’s disease
During a median follow-up of 8.3 (range 0 to 15.5) years, 111 participants developed incident dementia, 89 of them were diagnosed with AD. Log-leptin levels showed a strong inverse relation to the risk of incident all-cause dementia and AD in all models (Table 2), remaining statistically significant after the full covariate adjustment in Model C. Additional adjustment for change in WHR prior to the baseline examination and for depression (Table 2) as well as excluding participants who developed clinical dementia within 3 years after leptin was measured (online supplementary Table 4) did not alter the results. Replacing WHR by BMI revealed comparable results in the multi-variable adjusted model (Table 2). We observed evidence for effect modification by obesity (BMI≥30 kg/m2) of the association between leptin and all-cause dementia (p=0.016 for interaction term) but not between leptin and AD. Analyses stratified by obesity revealed that the association between leptin and all-cause dementia and AD was only statistically significant in non-obese participants (Table 4). Figure 1 demonstrates the cumulative incidence of AD over 15.5 years. In good agreement with our previous findings,3 the incidence of dementia decreases gradually across increasing sex-specific leptin quartiles; thus a person with a baseline leptin level in the lowest quartile (Q1) had a 25% risk of developing AD after 12 years of follow-up, whereas the corresponding risk for a person in the top quartile (Q4) was only 6% (p<0.001 for the overall test of equality (−2logL) among the four leptin quartiles). Cumulative incidence (as a measure of absolute risk) and hazard ratios for incident AD and all-cause dementia comparing each quartile of baseline leptin concentration to the referent lowest quartile are shown in the Table 3. We observed effect modification by WHR of the association between leptin levels and incident dementia and AD (p=0.003 and p=0.042 for leptin*WHR interaction term in the models predicting all-cause dementias and AD, respectively). The stratified analyses revealed a strong, inverse association between leptin and dementia and AD in participants in the first three sex-specific WHR quartiles (Table 4). In the fourth WHR quartile, no significant association between leptin and incident dementia was observed; however, we had only a limited number of events in this subgroup. We observed no effect modification by ApoE ε4 allele (p=0.32 and p=0.79 for interaction term ApoE ε4*leptin for the models predicting all-cause dementia and AD, respectively).
Table 2.
Association of sex-standardized log-leptin with incident all-cause dementia and incident Alzheimer’s disease
| All-cause Dementia | Alzheimer’s Disease | |||||
|---|---|---|---|---|---|---|
| Hazard Ratio | Hazard Ratio | |||||
| Model | Cases/N | (95% CI) | P | Cases/N | (95% CI) | P |
| A. Age- and sex-adjusted | 111/785 | 0.70 [0.57–0.85] | <0.001 | 89/785 | 0.58 [0.47–0.73] | <0.001 |
| B. adjusting for basic risk factors* | 98/657 | 0.68 [0.55–0.85] | <0.001 | 79/657 | 0.57 [0.45–0.72] | <0.001 |
| C. Model B plus vascular risk factors (WHR)† | 95/641 | 0.68 [0.54–0.87] | 0.002 | 77/641 | 0.60 [0.46–0.79] | <0.001 |
| C2. Model B plus vascular risk factors (BMI)§ | 96/643 | 0.75 [0.56–1.02] | 0.063 | 77/643 | 0.64 [0.46–0.89] | 0.008 |
| D. Model C plus ΔWHR | 90/608 | 0.72 [0.56–0.94] | 0.014 | 73/608 | 0.64 [0.48–0.85] | 0.002 |
| E. Model C plus CES-D scale | 91/629 | 0.66 [0.51–0.84] | 0.001 | 74/629 | 0.59 [0.45–0.78] | 0.001 |
Adjustment for age, sex, plasma homocysteine in the top age-specific quartile, APO E ε4-genotype
Adjustment for age, sex, plasma homocysteine in the top age-specific quartile, APO E ε4-genotype, WHR, systolic blood pressure, antihypertensive treatment, diabetes, smoking, atrial fibrillation
Adjustment for age, sex, plasma homocysteine in the top age-specific quartile, APO E-genotype, BMI, systolic blood pressure, antihypertensive treatment, diabetes, smoking, atrial fibrillation.
Hazard ratios are per one-SD increment in sex-standardized log-leptin.
Abbreviations: WHR, waist-to-hip ratio; APO E, apolipoprotein E; CI, confidence interval; ΔWHR, change in WHR from exam 21 to exam 22 (when leptin was assayed) CES-D, center for epidemiologic studies depression scale.
The number of individuals in the denominator decreased with the number of covariates in the model, because some covariates were not available in every participant
Table 4.
Association of sex-standardized log-leptin with incident all-cause dementia and incident Alzheimer’s disease, adjusted for age and sex only, stratified by sex-specific quartiles of Waist Hip Ratio and by obese (BMI ≥30 kg/m2) or non-obese status.
| All-cause Dementia | Alzheimer’s Disease | |||||
|---|---|---|---|---|---|---|
| Hazard Ratio | Hazard Ratio | |||||
| Model | Cases/N | (95% CI) | P | Cases/N | (95% CI) | P |
| Q1–Q3 Waist Hip Ratio | 79/586 | 0.57 [0.45–0.73] | <0.001 | 70/586 | 0.53 [0.41–0.69] | <0.001 |
| Q4 Waist Hip Ratio | 31/195 | 0.92 [0.60–1.40] | 0.685 | 19/195 | 0.77 [0.45–1.32] | 0.337 |
| BMI < 30 kg/m2 | 95/561 | 0.69 [0.55–0.87] | 0.002 | 79/561 | 0.63 [0.49–0.81] | 0.001 |
| BMI ≥30 kg/m2 | 16/221 | 1.87 [0.86–4.06] | 0.113 | 10/221 | 0.74 [0.28–1.97] | 0.547 |
Hazard ratios are per one-SD increment in sex-standardized log-leptin.
Figure 1.
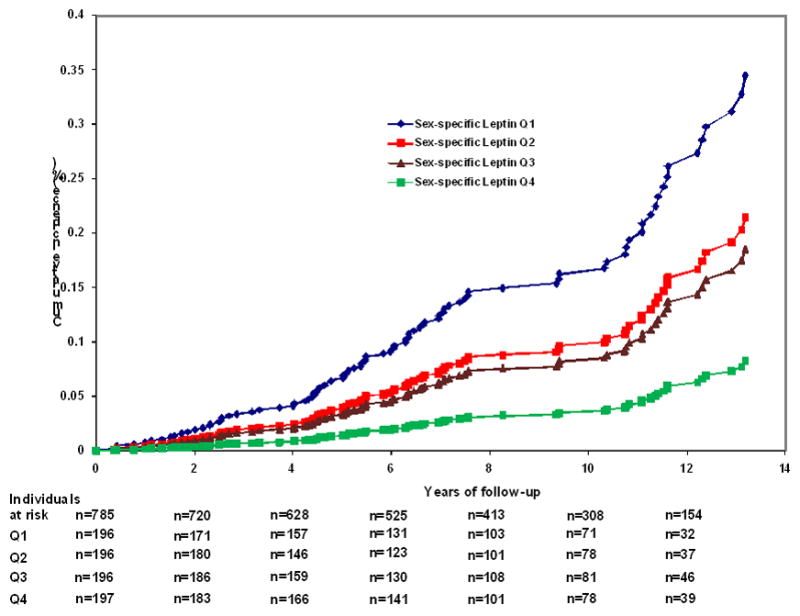
Cumulative incidence of Alzheimer’s disease (AD) according to sex-specific leptin quartiles. The number of events and participants at risk were as follows in the sex-specific quartiles: Q1: 38 events/196 persons at risk; Q2: 23 events/196 persons at risk, Q3: 20 events/196 persons at risk; and Q4: 8 events/197 persons at risk. Along the x-axis the number of persons at risk within each leptin quartile (Q1–Q4) is provided.
Table 3.
Hazard ratios (HR) for incident all-cause dementia and Alzheimer’s disease according to sex-specific quartiles of baseline leptin levels
| All Cause Dementia | Alzheimer’s Disease | |||||
|---|---|---|---|---|---|---|
| Sex-specific quartiles of leptin | Events/persons at risk | HR (95% CI) | P | Events/persons at risk | HR (95% CI) | P |
| A. Adjusted for age and sex | ||||||
| Q1 | 42/196 | Referent | 38/196 | Referent | ||
| Q2 | 29/196 | 0.67 [0.42–1.08] | 0.100 | 23/196 | 0.60 [0.35–1.00] | 0.051 |
| Q3 | 23/196 | 0.52 [0.31–0.86] | 0.012 | 20/196 | 0.50 [0.29–0.65] | 0.011 |
| Q4 | 17/197 | 0.40 [0.23–0.71] | 0.002 | 8/197 | 0.21 [0.10–0.44] | <0.001 |
| Trend | <0.001 | <0.001 | ||||
| B. Adjusted for age, sex, plasma homocysteine in the top age-specific quartile, APO E-genotype | ||||||
| Q1 | 37/165 | Referent | 33/165 | Referent | ||
| Q2 | 27/158 | 0.86 [0.50–1.46] | 0.570 | 22/158 | 0.86 [0.48–1.54] | 0.613 |
| Q3 | 19/164 | 0.48 [0.26–0.87] | 0.016 | 17/164 | 0.52 [0.27–0.99] | 0.045 |
| Q4 | 12/154 | 0.42 [0.20–0.84] | 0.015 | 5/154 | 0.23 [0.08–0.61] | 0.003 |
| Trend | 0.003 | <0.001 | ||||
Abbreviations: Q, quartile; CI, confidence interval; HR, hazard ratio
Association of leptin levels with MRI measures of Brain Aging
The mean interval between leptin measurement and brain MRI was 7.7 years. Leptin levels were positively associated with TCBV in models adjusting for age, sex, dementia risk factors, vascular risk factors, WHR, and depression (Table 5). In addition, leptin was inversely associated with THV in age- and sex-adjusted models, however, additional adjustments for neurodegenerative or vascular risk factors rendered the association non-significant (Table 5). The age-, sex-, and leptin-adjusted model explained 18% and 7% percent of the interindividual variability in TCBV and THV, respectively. The partial R2 for leptin were 5% and 3% in the models predicting TCBV and THV, respectively.
Table 5.
Association of sex-standardized log-leptin levels with MRI precursors of subclinical Alzheimer’s disease
| Total cerebral brain volume | Temporal horn volume | |||
|---|---|---|---|---|
| Model | β±SE | P | β±SE | P |
| A. Age- and sex-adjusted | 0.76±0.26 | 0.004 | −0.12±0.06 | 0.033 |
| B. adjusting for basic risk factors* | 0.80±0.28 | 0.005 | −0.08±0.06 | 0.181 |
| C. Model B and vascular risk factors† | 0.88±0.31 | 0.005 | −0.05±0.07 | 0.432 |
| D. Model C plus CES-D scale | 0.88±0.31 | 0.005 | −0.05±0.07 | 0.437 |
Adjustment for age, sex, plasma homocysteine in the top age-specific quartile, APO E-genotype
Adjustment for age, sex, plasma homocysteine in the top age-specific quartile, APO E-genotype, WHR, systolic blood pressure, antihypertensive treatment, diabetes, smoking, atrial fibrillation
Abbreviations: WHR, waist-to-hip ratio; APO E, apolipoprotein E; SE, standard error; CES-D, center for epidemiologic studies depression scale Regression coefficient β indicates the increase in total cerebral brain volume and temporal horn volume per one-SD increment in sex-standardized log-leptin.
Discussion
In our moderate-sized sample from the general population, higher leptin levels at baseline were prospectively associated with a lower risk for incident AD and dementia. The association of high leptin levels with a reduced risk for all-cause dementia and AD remained significant after adjustment for traditional vascular risk factors, and for WHR. Although this association was statistically not significant in participants with higher WHR, the overall findings are consistent with an emerging, if speculative, hypothesis that one reason for the observed association of midlife central obesity with subsequent risk of AD may be an acquired resistance to effects of leptin, including its neuroprotective effects.30 In addition, in a smaller sub-sample of survivors, higher leptin levels were associated with subclinical MRI measures of healthy aging and lower AD risk, i.e. with a higher TCBV and a lower THV although the associations with THV failed to reach statistical significance.
A growing body of evidence indicates that leptin has beneficial effects on brain development and function.31,32 Leptin-deficient mice have a lower brain weight, an immature expression pattern of synaptic and glial proteins,33 and disrupted projection pathways within the hypothalamus34 indicating that leptin is necessary for normal brain development. Further, leptin appears to mediate structural and functional changes in the hippocampus and to improved memory function.6 Leptin receptors are present in the CA1 region of the hippocampus and leptin-deficient or insensitive rats show reduced synaptic plasticity and poorer performance in spatial memory tasks. Leptin facilitates NMDA receptor mediated conversion of short-term potentiation to long-term potentiation in the hippocampus35 and also improves neuronal survival.36
Leptin has also been shown to increase ApoE dependent β-amyloid uptake into the cell and reduce brain extracellular concentrations of β-amyloid, the major component of the neuritic plaques that are a histopathological hallmark of AD.37 Leptin and insulin act in a dose-dependent and synergistic manner to decrease hyperphosphorylation of tau, the primary component of the neurofibrillary tangle, the second major histopathological hallmark of AD.38 Most interesting is a recent observation that chronic leptin treatment improved memory performance in transgenic animal models of AD.39
Our epidemiological observations of an inverse association of baseline leptin concentrations with incident dementia in general and with AD in particular are consistent with these experimental results, as are our observations of a positive relation of leptin with TCBV and (in age-and sex-adjusted models) with THV. A recent small study of brain MRI in 34 elderly volunteers found that higher leptin levels were associated with larger hippocampal and parahippocampal gray matter volumes, but did not observe any association of leptin with total brain volumes; it is likely that the study was underpowered to detect an effect of the magnitude we observed.40 Together, these data support the concept that leptin exerts multiple functions in the brain, beyond those involved in food consumption and energy expenditure. Interestingly, the association of leptin with AD and all-cause dementia is independent of classic neurodegenerative and vascular risk factors suggesting that leptin might act along a new pathway relevant to cognitive function in humans. Although our study was observational, the biological plausibility of the findings, the temporal relations (leptin measurements antedated dementia), the dose-response noted, and the consistency of results in multiple analyses (including an association with subclinical structural indices that have been correlated with cognitive function) suggest that the association may be a causal one, a premise that merits further investigation. The protective effect of leptin seems particularly strong in non-obese individuals and did not reach statistical significance in obese individuals. However, this finding has to be interpreted with caution, since the number of participants and events are substantially smaller in the obese as compared to the non-obese group, limiting our statistical power to detect modest associations. The literature indicates that leptin measurements are relatively stable over time within a given individual. Intra-class correlation coefficients of repeated samples, drawn over a time period of up to 3 years, ranged around 0.80.41–43
The availability of prospective data on hard clinical endpoints (incident dementia and AD) as well as measures of subclinical disease (TCBV, THV), the comprehensive assessment of covariates and the community-based sample strengthen our study. One potential explanation for the stronger association signal with TCBV might be that TCBV is a more robust and reliable measure, with a lower inherent variability when compared to THV.18 One limitation is the restriction of our sample to older European Americans. It is unclear whether our findings are applicable to other ethnicities or age groups. Furthermore, we did not measure leptin in the cerebrospinal fluid or the brain parenchyma. However, the correlation between plasma and cerebrospinal fluid leptin is high.44 Given our sample size, we had only modest power to exclude multivariable-adjusted associations of leptin with THV and we cannot rule out that the results relating leptin to MRI measures of brain aging (which were obtained almost 8 years after leptin was assayed) were biased through selective/conditional survival. In addition, no measures of physical activity, a potential confounder of the observed associations,45 were available at the baseline examination. Leptin levels were determined only once in each participant. This might have led to some random misclassification, likely biasing our results toward the null hypothesis, although the possibility of differential misclassification cannot be excluded. Leptin levels were not measured in our participants while they were middle-aged, so we are unable to address the relationship between mid-life leptin and cognitive outcomes. Further whereas there is published data to suggest that leptin levels remain stable over time, the temporal stability of levels in obese individuals has not been specifically addressed.
Thus, in our community-based sample, higher baseline concentrations of leptin were associated with a reduced risk of incident dementia and AD, even after adjustment for WHR. Further, higher leptin levels were associated with larger brain parenchymal and smaller ventricular volumes. These findings are consistent with recent experimental data indicating that leptin improves memory function in animals through direct effects on the hippocampus and strengthen the evidence that leptin is a hormone with a broad set of actions in the central nervous system. Due to the exploratory character of the present analyses, we did not adjust for multiple comparisons and acknowledge that our findings require confirmation in independent samples. If our findings are confirmed by others, leptin levels in older adults may serve as one of several possible biomarkers for healthy brain aging and more importantly, may open new pathways for possible preventive and therapeutic intervention.39 Further exploration of the molecular and cellular basis for the observed association may expand our understanding of the pathophysiology underlying brain aging and the development of AD.
Supplementary Material
Online supplementary Table 1. Among dementia-free participants who attended examination 22 and have subsequent follow-up for incident dementia, comparison of those participants with (n=785) and without (n=275) leptin measured
Online supplementary Table 2. Clinical and biochemical characteristics of participants with and without MRI.
Online supplementary Table 3. Clinical and biochemical as well as other characteristics of our study sample stratified by sex.
Online supplementary Table 4. Association of sex-standardized log-leptin with incident dementia and incident Alzheimer’s disease, starting follow-up 3 years after the baseline examination 22 (when leptin was assayed)
Acknowledgments
Funding/Support: This work was supported by National Institutes of Health/National Heart, Lung, and Blood Institute Contract N01-HC-25195, N01HV28178, RO1 DK080739, and 2K24HL04334 (Dr Vasan), the National Institute on Aging ( R01 AG16495; AG08122, AG 033193, AG031287) and the National Institute of Neurological Disorders and Stroke (R01 NS17950). The content is solely the responsibility of the authors and does not necessarily represent the official views of the National Institute of Neurological Disorders and Stroke, the National Heart Lung and Blood Institute, the National Institute of Aging or the National Institutes of Health. The funding organizations: the National Heart, Lung and Blood Institute, the National Institute of Aging and the National Institute of Neurological Diseases and Stroke had no role in the design and conduct of the study; collection, management, analysis and interpretation of the data; and preparation, review, or approval of the manuscript.
Footnotes
Disclosures: Dr. Roubenoff is an employee of Biogen Idec, Inc, but reports no conflict of interest with the subject of this paper.
Conflicts of interest: none
Authors contributions: Study concept and design: Beiser, Vasan, Seshadri; Acquisition of data: Tan, Au, DeCarli, Auerbach, Wolf, Seshadri (dementia, MRI) and Harris, Roubenoff (leptin); Analyses and interpretation of data: Lieb, Beiser, Vasan, Wolf, Seshadri; drafting the manuscript: Lieb, Beiser, Seshadri; Critical revision of the manuscript for important intellectual content: Vasan, Tan, Au, Harris, Roubenoff, Auerbach, DeCarli, Wolf; Statistical expertise: Beiser; Obtained funding: Vasan, Seshadri, Wolf. Dr. Beiser, who is a faculty member at a medical school, was responsible for all the statistical analyses. The corresponding author, Dr. Seshadri, had full access to all the data in the study and takes responsibility for the integrity of the data and the accuracy of the data analysis.
Reference List
- 1.Peila R, Rodriguez BL, Launer LJ. Type 2 diabetes, APOE gene, and the risk for dementia and related pathologies: The Honolulu-Asia Aging Study. Diabetes. 2002;51(4):1256–1262. doi: 10.2337/diabetes.51.4.1256. [DOI] [PubMed] [Google Scholar]
- 2.2008 Alzheimer’s disease facts and figures. Alzheimers Dement. 2008;4(2):110–133. doi: 10.1016/j.jalz.2008.02.005. [DOI] [PubMed] [Google Scholar]
- 3.Wolf PA, Beiser A, Elias MF, Au R, Vasan RS, Seshadri S. Relation of obesity to cognitive function: importance of central obesity and synergistic influence of concomitant hypertension. The Framingham Heart Study. Curr Alzheimer Res. 2007;4(2):111–116. doi: 10.2174/156720507780362263. [DOI] [PubMed] [Google Scholar]
- 4.Whitmer RA, Gunderson EP, Barrett-Connor E, Quesenberry CP, Jr, Yaffe K. Obesity in middle age and future risk of dementia: a 27 year longitudinal population based study. BMJ. 2005;330(7504):1360. doi: 10.1136/bmj.38446.466238.E0. [DOI] [PMC free article] [PubMed] [Google Scholar]
- 5.Elmquist JK, Maratos-Flier E, Saper CB, Flier JS. Unraveling the central nervous system pathways underlying responses to leptin. Nat Neurosci. 1998;1(6):445–450. doi: 10.1038/2164. [DOI] [PubMed] [Google Scholar]
- 6.Harvey J, Solovyova N, Irving A. Leptin and its role in hippocampal synaptic plasticity. Prog Lipid Res. 2006;45(5):369–378. doi: 10.1016/j.plipres.2006.03.001. [DOI] [PMC free article] [PubMed] [Google Scholar]
- 7.Li XL, Aou S, Oomura Y, Hori N, Fukunaga K, Hori T. Impairment of long-term potentiation and spatial memory in leptin receptor-deficient rodents. Neuroscience. 2002;113(3):607–615. doi: 10.1016/s0306-4522(02)00162-8. [DOI] [PubMed] [Google Scholar]
- 8.Cooke SF, Bliss TV. Plasticity in the human central nervous system. Brain. 2006;129(Pt 7):1659–1673. doi: 10.1093/brain/awl082. [DOI] [PubMed] [Google Scholar]
- 9.Barrett-Connor E, Edelstein S, Corey-Bloom J, Wiederholt W. Weight loss precedes dementia in community-dwelling older adults. J Nutr Health Aging. 1998;2(2):113–114. [PubMed] [Google Scholar]
- 10.Power DA, Noel J, Collins R, O’Neill D. Circulating leptin levels and weight loss in Alzheimer’s disease patients. Dement Geriatr Cogn Disord. 2001;12(2):167–170. doi: 10.1159/000051252. [DOI] [PubMed] [Google Scholar]
- 11.Giesel FL, Thomann PA, Hahn HK, et al. Comparison of manual direct and automated indirect measurement of hippocampus using magnetic resonance imaging. Eur J Radiol. 2008;66(2):268–273. doi: 10.1016/j.ejrad.2007.06.009. [DOI] [PubMed] [Google Scholar]
- 12.Frisoni GB, Geroldi C, Beltramello A, et al. Radial width of the temporal horn: a sensitive measure in Alzheimer disease. AJNR Am J Neuroradiol. 2002;23(1):35–47. [PMC free article] [PubMed] [Google Scholar]
- 13.Gosche KM, Mortimer JA, Smith CD, Markesbery WR, Snowdon DA. Hippocampal volume as an index of Alzheimer neuropathology: findings from the Nun Study. Neurology. 2002;58(10):1476–1482. doi: 10.1212/wnl.58.10.1476. [DOI] [PubMed] [Google Scholar]
- 14.Ridha BH, Barnes J, Bartlett JW, et al. Tracking atrophy progression in familial Alzheimer’s disease: a serial MRI study. Lancet Neurol. 2006;5(10):828–834. doi: 10.1016/S1474-4422(06)70550-6. [DOI] [PubMed] [Google Scholar]
- 15.Dawber TR, MEADORS GF, MOORE FE., Jr Epidemiological approaches to heart disease: the Framingham Study. Am J Public Health Nations Health. 1951;41(3):279–281. doi: 10.2105/ajph.41.3.279. [DOI] [PMC free article] [PubMed] [Google Scholar]
- 16.Geerlings SW, Beekman AT, Deeg DJ, Twisk JW, Van Tilburg W. Duration and severity of depression predict mortality in older adults in the community. Psychol Med. 2002;32(4):609–618. doi: 10.1017/s0033291702005585. [DOI] [PubMed] [Google Scholar]
- 17.Ma Z, Gingerich RL, Santiago JV, Klein S, Smith CH, Landt M. Radioimmunoassay of leptin in human plasma. Clin Chem. 1996;42(6 Pt 1):942–946. [PubMed] [Google Scholar]
- 18.DeCarli C, Massaro J, Harvey D, et al. Measures of brain morphology and infarction in the framingham heart study: establishing what is normal. Neurobiol Aging. 2005;26(4):491–510. doi: 10.1016/j.neurobiolaging.2004.05.004. [DOI] [PubMed] [Google Scholar]
- 19.Seshadri S, Wolf PA, Beiser A, et al. Stroke risk profile, brain volume, and cognitive function: the Framingham Offspring Study. Neurology. 2004;63(9):1591–1599. doi: 10.1212/01.wnl.0000142968.22691.70. [DOI] [PubMed] [Google Scholar]
- 20.Jack CR, Jr, Petersen RC, Xu Y, et al. Rate of medial temporal lobe atrophy in typical aging and Alzheimer’s disease. Neurology. 1998;51(4):993–999. doi: 10.1212/wnl.51.4.993. [DOI] [PMC free article] [PubMed] [Google Scholar]
- 21.Davis PC, Gearing M, Gray L, et al. The CERAD experience, Part VIII: Neuroimaging-neuropathology correlates of temporal lobe changes in Alzheimer’s disease. Neurology. 1995;45(1):178–179. doi: 10.1212/wnl.45.1.178. [DOI] [PubMed] [Google Scholar]
- 22.Akomolafe A, Beiser A, Meigs JB, et al. Diabetes mellitus and risk of developing Alzheimer disease: results from the Framingham Study. Arch Neurol. 2006;63(11):1551–1555. doi: 10.1001/archneur.63.11.1551. [DOI] [PubMed] [Google Scholar]
- 23.Tan ZS, Beiser AS, Vasan RS, et al. Inflammatory markers and the risk of Alzheimer disease: the Framingham Study. Neurology. 2007;68(22):1902–1908. doi: 10.1212/01.wnl.0000263217.36439.da. [DOI] [PubMed] [Google Scholar]
- 24.American Psychiatric Association. Diagnostic and Statistical Manual of Mental Disorders. 4. 1994. Text Revision (DSMIV-TR) [Google Scholar]
- 25.McKhann G, Drachman D, Folstein M, Katzman R, Price D, Stadlan EM. Clinical diagnosis of Alzheimer’s disease: report of the NINCDS-ADRDA Work Group under the auspices of Department of Health and Human Services Task Force on Alzheimer’s Disease. Neurology. 1984;34(7):939–944. doi: 10.1212/wnl.34.7.939. [DOI] [PubMed] [Google Scholar]
- 26.Peltz G, Sanderson M, Perez A, Sexton K, Ochoa CD, Fadden MK. Serum leptin concentration, adiposity, and body fat distribution in Mexican-Americans. Arch Med Res. 2007;38(5):563–570. doi: 10.1016/j.arcmed.2006.12.009. [DOI] [PubMed] [Google Scholar]
- 27.Whitmer RA, Gustafson DR, Barrett-Connor E, Haan MN, Gunderson EP, Yaffe K. Central obesity and increased risk of dementia more than three decades later. Neurology. 2008;71(14):1057–1064. doi: 10.1212/01.wnl.0000306313.89165.ef. [DOI] [PubMed] [Google Scholar]
- 28.Wulsin LR, Evans JC, Vasan RS, Murabito JM, Kelly-Hayes M, Benjamin EJ. Depressive symptoms, coronary heart disease, and overall mortality in the Framingham Heart Study. Psychosom Med. 2005;67(5):697–702. doi: 10.1097/01.psy.0000181274.56785.28. [DOI] [PubMed] [Google Scholar]
- 29.Saad MF, Damani S, Gingerich RL, et al. Sexual dimorphism in plasma leptin concentration. J Clin Endocrinol Metab. 1997;82(2):579–584. doi: 10.1210/jcem.82.2.3739. [DOI] [PubMed] [Google Scholar]
- 30.Tezapsidis N, Smith MA, Ashford JW. Central obesity and increased risk of dementia more than three decades later. Neurology. 2009;72(11):1030–1031. [PubMed] [Google Scholar]
- 31.Harvey J, Shanley LJ, O’Malley D, Irving AJ. Leptin: a potential cognitive enhancer? Biochem Soc Trans. 2005;33(Pt 5):1029–1032. doi: 10.1042/BST20051029. [DOI] [PubMed] [Google Scholar]
- 32.Tang BL. Leptin as a neuroprotective agent. Biochem Biophys Res Commun. 2008;368(2):181–185. doi: 10.1016/j.bbrc.2008.01.063. [DOI] [PubMed] [Google Scholar]
- 33.Ahima RS, Bjorbaek C, Osei S, Flier JS. Regulation of neuronal and glial proteins by leptin: implications for brain development. Endocrinology. 1999;140(6):2755–2762. doi: 10.1210/endo.140.6.6774. [DOI] [PubMed] [Google Scholar]
- 34.Bouret SG, Draper SJ, Simerly RB. Trophic action of leptin on hypothalamic neurons that regulate feeding. Science. 2004;304(5667):108–110. doi: 10.1126/science.1095004. [DOI] [PubMed] [Google Scholar]
- 35.Shanley LJ, Irving AJ, Harvey J. Leptin enhances NMDA receptor function and modulates hippocampal synaptic plasticity. J Neurosci. 2001;21(24):RC186. doi: 10.1523/JNEUROSCI.21-24-j0001.2001. [DOI] [PMC free article] [PubMed] [Google Scholar]
- 36.Doherty GH, Oldreive C, Harvey J. Neuroprotective actions of leptin on central and peripheral neurons in vitro. Neuroscience. 2008;154(4):1297–1307. doi: 10.1016/j.neuroscience.2008.04.052. [DOI] [PubMed] [Google Scholar]
- 37.Fewlass DC, Noboa K, Pi-Sunyer FX, Johnston JM, Yan SD, Tezapsidis N. Obesity-related leptin regulates Alzheimer’s Abeta. FASEB J. 2004;18(15):1870–1878. doi: 10.1096/fj.04-2572com. [DOI] [PubMed] [Google Scholar]
- 38.Greco SJ, Sarkar S, Johnston JM, et al. Leptin reduces Alzheimer’s disease-related tau phosphorylation in neuronal cells. Biochem Biophys Res Commun. 2008 doi: 10.1016/j.bbrc.2008.09.026. [DOI] [PMC free article] [PubMed] [Google Scholar]
- 39.Tezapsidis N, Johnston JM, Smith MA, et al. Leptin: a novel therapeutic strategy for Alzheimer’s disease. J Alzheimers Dis. 2009;16(4):731–740. doi: 10.3233/JAD-2009-1021. [DOI] [PMC free article] [PubMed] [Google Scholar]
- 40.Narita K, Kosaka H, Okazawa H, Murata T, Wada Y. Relationship Between Plasma Leptin Level and Brain Structure in Elderly: A Voxel-Based Morphometric Study. Biol Psychiatry. 2008 doi: 10.1016/j.biopsych.2008.10.006. [DOI] [PubMed] [Google Scholar]
- 41.Stattin P, Lukanova A, Biessy C, et al. Obesity and colon cancer: does leptin provide a link? Int J Cancer. 2004;109(1):149–152. doi: 10.1002/ijc.11668. [DOI] [PubMed] [Google Scholar]
- 42.Linkov F, Gu Y, Arslan AA, et al. Reliability of tumor markers, chemokines, and metastasis-related molecules in serum. Eur Cytokine Netw. 2009;20(1):21–26. doi: 10.1684/ecn.2009.0146. [DOI] [PMC free article] [PubMed] [Google Scholar]
- 43.Lee JH, Reed DR, Price RA. Leptin resistance is associated with extreme obesity and aggregates in families. Int J Obes Relat Metab Disord. 2001;25(10):1471–1473. doi: 10.1038/sj.ijo.0801736. [DOI] [PubMed] [Google Scholar]
- 44.Nam SY, Kratzsch J, Kim KW, Kim KR, Lim SK, Marcus C. Cerebrospinal fluid and plasma concentrations of leptin, NPY, and alpha-MSH in obese women and their relationship to negative energy balance. J Clin Endocrinol Metab. 2001;86(10):4849–4853. doi: 10.1210/jcem.86.10.7939. [DOI] [PubMed] [Google Scholar]
- 45.Rovio S, Kareholt I, Helkala EL, et al. Leisure-time physical activity at midlife and the risk of dementia and Alzheimer’s disease. Lancet Neurol. 2005;4(11):705–711. doi: 10.1016/S1474-4422(05)70198-8. [DOI] [PubMed] [Google Scholar]
Associated Data
This section collects any data citations, data availability statements, or supplementary materials included in this article.
Supplementary Materials
Online supplementary Table 1. Among dementia-free participants who attended examination 22 and have subsequent follow-up for incident dementia, comparison of those participants with (n=785) and without (n=275) leptin measured
Online supplementary Table 2. Clinical and biochemical characteristics of participants with and without MRI.
Online supplementary Table 3. Clinical and biochemical as well as other characteristics of our study sample stratified by sex.
Online supplementary Table 4. Association of sex-standardized log-leptin with incident dementia and incident Alzheimer’s disease, starting follow-up 3 years after the baseline examination 22 (when leptin was assayed)