

Abstract
Purinergic receptor activation increases cytosolic Ca2+ concentration in a fluctuating fashion, triggering oscillatory outward Ca2+-activated K+ currents in rat megakaryocytes (MKs). Whole cell and nystatin-perforated patch-clamp techniques were used to analyze changes in ionic conductance in MK with acetylsalicylic acid (ASA), a cyclooxygenase-1 inhibitor and antithrombotic agent. MKs are a model for platelet reactivity, particularly in ASA treatment failure (ASA resistance). Freshly isolated MKs were incubated 30 min in the absence or presence of 1 mM ASA. Using a K+-rich internal solution, we recorded outward currents in response to 10 μM ATP, 10 μM ADP, and 5 μM 2-methyl-thio-ADP (2MeSADP) in the voltage-clamp mode. Agonist-induced currents decreased in amplitude over time, but this decline was attenuated by ASA in both continuous and repeated agonist challenge, indicating increased MK reactivity with ASA treatment. In separate experiments, heterologous desensitization was observed when MKs were stimulated with ADP after exposure to a thromboxane receptor agonist (U46619), indicating cross talk between thromboxane and purinergic pathways. Different cells, treated with ASA or MRS2179 (P2Y1 receptor antagonist), were stimulated with 2MeSADP. The dose-response curve was shifted to the left in both cases, suggesting increased MK reactivity. ASA also caused an increased interval between currents (delay). ASA attenuated desensitization of purinergic receptors and increased delay, again suggesting cross talk between purinergic and thromboxane pathways. These findings may be relevant to ASA resistance, because individual variations in sensitivity to the multiple effects of ASA on signaling pathways could result in insensitivity to its antiplatelet effects in some patients.
Keywords: platelets, patch clamp, ADP, ATP, thromboxane
cardiovascular disease is the leading cause of morbidity and mortality in the United States and developed countries (17, 54). Platelet increased reactivity is a key factor in the development of stroke and ischemic heart disease. Therefore, platelets have become a target for pharmacological treatment of cardiovascular complications after percutaneous coronary intervention (angioplasty and stent implant) (37) as well as in stroke prevention and management. Aspirin has been shown to be effective in the acute phase of recurrent stroke (49), whereas purinergic receptor blockade in the CAPRIE study showed more effectiveness than aspirin with lower side effects such as bleeding (1). The use of drug-eluting stents and dual therapy of cyclooxygenase (COX) inhibitors and purinergic receptor P2Y12 blockers reduces the incidence of thromboembolism and ischemic episodes but with the adverse outcome of more bleeding occurrence (47, 57). Common platelet evaluation tests demonstrate that patients on aspirin or clopidogrel treatment often have inadequate response to these drugs, which has been termed “resistance” (21, 42, 57, 58). However, few studies have been performed on the electrophysiological characteristics of these anucleated formed elements because of methodological limitations primarily related to platelet size. The megakaryocyte (MK), the large cellular precursor for platelets in the bone marrow, contains all the metabolic components present in platelets and has similar sensitivity to drugs such as aspirin (8, 11, 36, 52, 53). Platelets and MKs both exhibit ionic currents and changes in shape and adhesiveness after being activated by ADP, ATP, thromboxane, collagen, thrombin, and fibrinogen via increases in cytosolic Ca2+ concentration ([Ca2+]i) (19, 23–25, 32, 33, 52). Several sources and mediators have been identified in Ca2+ signaling in platelets (24, 31, 43, 44). Summarizing the results of multiple studies, the compartmentalized model of [Ca2+]i regulation pathways in platelets and MKs consists of a G protein-mediated, protein kinase C (PKC) regulation by phospholipase Cβ (PLCβ) followed by calcium release (stored in the dense tubular system) activating the phosphoinositide (PI) cascade (10, 43). The resulting increase in [Ca2+]i activates phospholipase A2 (PLA2) and increases thromboxane A2 (TXA2) production (22). Because many different pathways converge upon Ca2+ release and storage in platelets, it has been difficult to distinguish the specific role of each pathway and how they interact with one another.
Two groups of purinergic (P2) receptors have been reported in MKs: the ATP receptor P2X1 has been characterized in mouse and rat (20, 34, 46, 52, 56), whereas two distinct types of P2Y receptors have been found, P2Y1 and P2Y12 (16, 35, 46, 52). P2 receptor agonists have been reported to induce distinct ionic currents in patch-clamp studies of mammalian MKs, depending on the agonist used and the species considered (23, 24, 33, 46, 56). For example, in the guinea pig and rat, ADP induces repetitive outward potassium currents characterized by a time-dependent rapid decay in amplitude explained by receptor desensitization (23, 24, 46, 53). In addition ADP-induced inward transient currents have also been reported in voltage-clamp studies of mouse MKs and human platelets using KCl internal solution at a holding potential (VH) of −42 mV (24, 33). ATP-induced inward transient currents in rats and mouse MKs are sensitive to P2X blockers that reveal a Ca2+-dependent K+ outward current (20, 46, 53). Ionic currents in the MK show “considerable intercellular variation” (36), with the presence of inward current quite rare in MKs from rats (23), as was the case in our study. Studies using fluorescent dyes have shown the basal [Ca2+]i to be near 0.1 μM and the resting membrane potential in platelets to be around −60 mV (30–32). Cytosolic [Ca2+] ([Ca2+]i) becomes elevated both in response to ADP binding to P2Y1 and P2Y12 receptors coupled to Gq and Gi, respectively, and consequent to ATP binding to the P2X1 receptor that directly gates a Ca2+/Na+ channel (2, 23, 24, 34, 46, 47, 52). However, ATP binds to the P2Y1 and P2Y12 receptors and ADP binds to the P2X1 receptor with lower affinity, preventing the use of these agonists to definitively determine specific receptor activation (46). Stimulation by these and more selective agonists results in homologous desensitization, a decrease in receptor sensitivity resulting in the progressive decline of the oscillating outward Ca2+-dependent K+ currents (4, 16, 52, 53, 56). In addition, heterologous desensitization, a decrease in receptor sensitivity as a result of the activation of a separate receptor pathway, has also been shown in studies with platelet aggregation using purinergic (P2) receptor agonists (3).
Acetylsalicylic acid (ASA) has been used to treat patients with a clinical history of platelet-related cardiovascular complications (60). In vitro studies have been performed with a broad range of ASA concentrations, from 5 μM to 4 mM (41). The TXA2 pathway in platelets is sensitive to COX-1 inhibition by ASA leading to less reactive platelets and reduced episodes of thrombosis (9). In some patients, however, ASA therapy fails to increase bleeding time or protect from thrombotic complications. Such “ASA resistance” is considered a treatment failure (21, 42). A recent study has shown cross-desensitization between ADP and thromboxane receptor (TP) signaling in human platelets indicating that changes in the activation state of one pathway may have effects upon the sensitivity of the other receptor system (3). Taking advantage of the MK model of platelet reactivity, we performed whole cell and the nystatin-perforated voltage-clamp experiments to investigate the effect of ASA on purinergic agonist-induced outward currents and their possible involvement in variability of platelet responses and the mechanism of ASA resistance. We describe changes in amplitude and time course of these currents in MKs with ASA treatment. Our results offer new insights into the role of the P2 and TXA2 pathways in [Ca2+]i regulation and suggest a possible model of how these pathways interact with one another.
MATERIALS AND METHODS
Materials.
ADP, ATP, ASA, 2-methyl-thio-ADP (2MeSADP) 9,11-dideoxy-11α,9α-epoxymethanoprostaglandin F2α (U46619), indomethacin, and nystatin were all from Sigma-Aldrich (St. Louis, MO); 2′-deoxy-N6-methyladenosine 3′,5′-bisphosphate tetrasodium salt (MRS2179) was from Tocris Bioscience (Ballwin, MO). For most drugs stock solutions were prepared in distilled water and diluted as needed. Nystatin and MRS2179 were prepared fresh and diluted in DMSO.
MK isolation.
Cells were collected from ∼6-wk-old male Sprague-Dawley rats (Harlan Laboratories, IN), decapitated after complete anesthesia with 2,2,2-tribromoethanol, 240 mg/kg body wt ip, in a protocol approved by the Georgetown University Animal Care and Use Committee. Marrow containing MKs was isolated from the femoral bones (41) into extracellular recording solution (ES) containing (in mM) 145 NaCl, 5 KCl, 1 CaCl2, 1 MgCl2, 10 HEPES, 10 d-glucose, adjusted to pH 7.2–7.3 with NaOH. We used apyrase (0.32 U/ml) in some experiments early; no difference was observed in terms of amplitude and duration of the outward currents as has been previously reported in some papers (23, 53). Experimental cells were incubated in 1 mM ASA or indomethacin 10 μM throughout (diluted in ES) for at least 30 min, and control cells were incubated in ES. An aliquot (100 μl) of cell suspension was plated directly onto the recording chamber, allowing 5–10 min for cell adhesion. MKs were identified by their size, the presence of several nuclei, and bright appearance with phase-contrast illumination (see Fig. 1 for examples). The experiments were carried out at room temperature (23–25°C). MKs were observed with Nikon upright or inverted phase-contrast microscopes (Tokyo, Japan), and photomicrographs were obtained with a Cohu 4912 CCD camera (Cohu, Poway, CA) using Scion software (Frederick, MD). Trypan blue exclusion test of cell viability was performed. Briefly, a sample of marrow tissue was suspended in 1 ml of extracellular solution and cells were dispersed by repetitive pipetting. One part of the cell suspension was mixed with one part of 0.4% Trypan blue, allowing 3 min for incubation. Living cells were unstained and appeared clear whereas dead cells were darkly stained (Fig. 1A) (28).
Fig. 1.
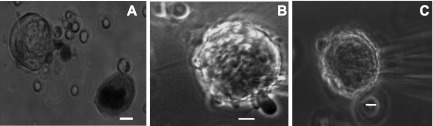
Sample megakaryocytes (MKs) studied on the basis of morphology. Brightfield photomicrographs (×40). A: stage I MK illustrating a viable cell on the left and a darker nonviable cell on the right (Trypan blue exclusion viability test). Phase contrast photomicrographs (×60). B: stage II MK with protruding pseudopodia. C: stage III MK ruffling and blebbing. Cells were in extracellular recording solution (ES) at room temperature. Calibration bars represent 10 μm.
Electrophysiological studies.
The nystatin-perforated patch-clamp technique was used in most experiments to record electrical activity in the MKs in the voltage-clamp mode, −40 mV holding potential, using an Axopatch 1-D amplifier (Molecular Devices, Sunnyvale, CA). To compare with previous studies (23, 46, 50) we also used the conventional whole cell configuration. Recording electrodes were pulled on a vertical pipette puller (Narishige, PP-83, Tokyo, Japan) from borosilicate glass capillaries (Wiretrol II, Drummond, Broomall, PA) and had resistance from 3 to 6 MΩ. The Clampex 9.2 software (Molecular Devices) was used for data acquisition with a previous junction potential correction. The internal pipette solution was modeled from Ref. 53 and had the following composition (mM): 150 KCl, 10 HEPES, pH 7.2–7.3 adjusted with NaOH. The extracellular recording solution had the same composition of that used for MK isolation listed above. ATP and ADP were applied by using a Y tube system into a chamber fed by gravity with ES (39). Applications were done soon after the whole cell configuration, or substantial decreases in access resistance were detected in the perforated recording mode and recording continued through the period of oscillatory response currents. After 1, 3, and 5 min of recovery while ES was perfused locally via Y-tube to remove the agonist, this procedure was repeated. This procedure will henceforth be referred to as the 0-, 1-, 3-, 5-min protocol. All agonists used (10 μM ADP, 10 μM ATP, and 5 μM 2MeSADP) were tested in a total of 37 preparations of cells derived from 32 rats. Thus except in five occasions control and experimental cells derived from distinct rats. Throughout the manuscript, N refers to the number of cells studies in each experimental condition from distinct preparations. U46619 (2 μM) exposure was performed for 30 s immediately before purinergic agonist application. Dose-response curves of 2MeSADP were produced by applying increasing agonist concentrations with 30 s recovery between each application, in the presence of either 1 mM ASA (37, 54), 10 μM MRS2179, or control solution.
Data analysis.
Clampfit 9.2 (Molecular Devices) was used to measure and plot the amplitude, Iperiod (duration of the peak), delay (measured as time from peak to peak; interval 1 = between peaks 1 and 2, interval 2 = between peaks 2 and 3, etc.), and to fit the dose-response curve with the Hill's equation: f(x) = Imin + {Imax − Imin/1+[EC50/(x)]h}, where Imin and Imax are the minimum and maximum evoked currents, EC50 is the agonist concentration producing 50% of the maximum response, and h is the Hill coefficient.
Currents were normalized by setting the initial response amplitude as 100% for the 0-, 1-, 3-, 5-min protocol. Dose-response currents were normalized by setting the greatest amplitude current as 100%. Microsoft Office Excel (Redmond, WA) was used to plot the raw data and normalize changes over time. Values are expressed as means ± SE, and groups were compared using two-tailed unpaired t-test followed by Bonferroni correction for multiple comparisons as needed. Statistical significance was assumed at P ≤ 0.05.
RESULTS
MK identification.
The Trypan blue exclusion test showed 65% survival (Fig. 1A). Viability remained near this level throughout the remaining experimental procedure (4–6 h). By measuring the MKs' longest axis, the range in diameter was 30 to 54 μm and the average diameter was 43 ± 7 μm, similar to previously reported observations (47). Large, round, brilliant cells were selected for patch-clamp recordings (Fig. 1, B and C).
Electrophysiological studies: ADP and ATP responses.
Three different groups of cells were distinguished in response to ADP or ATP (both at 10 μM) application: those with several repetitive outward currents (oscillations), a single sustained outward current, or lack of response to the agonist (Fig. 2, A–C). The majority of MKs studied displayed multiple oscillations and some responded with a single outward current (Table 1). The remaining cells were unresponsive (Table 1), possibly because of an immature differentiation stage or receptor downregulation. MKs were studied by using the nystatin-perforated patch-clamp configuration. In a sample of cells studied with conventional whole cell recordings as opposed to nystatin-perforated patch clamp, we did not observe significant differences, except that responses were considerably less stable. In each cell studied we used large depolarizing steps to activate voltage-gated potassium current to ascertain voltage control and exclude the possibility of closure (not shown). Access resistance was also monitored with 5 mV hyperpolarizing steps. Oscillations of outward currents decreased gradually in amplitude over time revealing desensitization and lasted from several seconds up to 20 min with use of the nystatin-perforated patch clamp (Fig. 2A).
Fig. 2.

Representative traces illustrating variable responses of distinct MKs to ATP recorded with nystatin-perforated patch clamp. Traces shown are from 3 different experiments in which 10 μM ATP was applied during the time indicated by the horizontal bar at the top. The internal solution contained (in mM) 150 KCl, 10 HEPES, pH 7.2–7.3; holding potential (VH) = −40 mV. A: ATP-induced oscillatory outward currents displaying gradual decrease in amplitude (desensitization). B: single current response in another MK. C: lack of response in a third example cell.
Table 1.
Percentage of MK displaying activity under control and experimental conditions in response to ADP and ATP 10 μM stimulation
| N | ADP (10 μM) |
ATP (10 μM) |
|||||
|---|---|---|---|---|---|---|---|
| OSC | SP | NR | OSC | SP | NR | ||
| Control | 28 | 60 | 27 | 13 | 62 | 23 | 15 |
| ASA (1 mM) | 35 | 83 | 11 | 6 | 53 | 41 | 6 |
Megakaryocytes (MKs) were studied by using the nystatin-perforated patch-clamp configuration. Holding potential (VH) = −40 mV. Control and experimental cells were stimulated with 10 μM ADP or 10 μM ATP. Cells were grouped according to agonist and response: OSC, oscillatory currents; SP, single-peak currents; NR, no response. ASA, acetylsalicylic acid. Values represent percent of total N cells.
The desensitization of currents produced by the purinergic (P2) receptor activation in MKs has been reported to be fast followed by a time-dependent recovery (3, 4, 16, 20). Therefore, we examined current amplitude during the first 30 s of agonist applications. Amplitude of the initial ATP-induced current was significantly higher in the ASA-treated MKs (control 137 ± 57 pA, n = 11; ASA 289 ± 103 pA, n = 10; P < 0.05). In contrast, ADP-induced currents were not different between control and ASA-treated MKs (control 316 ± 262 pA, n = 13; ASA 328 ± 317 pA, n = 13). The normalized average amplitude of ADP- and ATP-induced outward currents were plotted over time (Fig. 3, B and C). The amplitude of the currents in the control group (not exposed to ASA) exhibited a natural decay over time in many cells, as illustrated (Fig. 3A, top left) and previously reported. In contrast, MKs previously incubated with ASA, displayed a trend to lower decay in the ATP-stimulated cells (Fig. 3C) but not in those stimulated with ADP (Fig. 3B). Current amplitude was significantly higher in the ASA-treated MKs after ATP stimulation at both the 10- and 20-s time points (P < 0.05). Nevertheless, no difference in current amplitude decline was observed between control and ASA-treated cells after ADP stimulation.
Fig. 3.

Progressive decay of outward current amplitude during the first 30 s of purinergic agonist exposure. A: representative conventional patch-clamp recordings of oscillation in MKs showing desensitization during continuous 10 μM ATP exposure in control cells (left) and cells exposed to 1 mM acetylsalicylic acid (ASA; right). B and C: effects of ASA on the progressive decay of outward current amplitude at distinct time points during the first 30 s of continuous application of ADP (B) and ATP (C). Each value represents the percent change of normalized current amplitude, setting the first peak amplitude as 100%. Values are means ± SE for 10 μM. ADP: control n ≥ 8, ASA n ≥ 9; 10 μM. ATP: control n = 9, ASA n = 8. *P ≤ 0.05.
We also studied the changes in 10 μM ATP or 10 μM ADP evoked outward currents by repeating the 30-s exposures at 1-, 3-, and 5 min intervals after the initial application (Fig. 4) The amplitude of the first response of the oscillatory currents showed some decline with time in control conditions. In the presence of 1 mM ASA, however, the outward current was larger at each interval considered and increased progressively with time. As illustrated in Fig. 4, B and C, the amplitude of each subsequent response at the 1-, 3-, and 5-min intervals normalized to that of the initial current became significantly different between control and ASA treatments (P < 0.05) after 5 min of recovery time in the ATP experiment and at both the 3- and 5-min periods in the ADP experiment (P < 0.01 and P < 0.05, respectively).
Fig. 4.

ASA reverses time-dependent degradation of purinergic receptor agonist-induced outward current in MKs. A: example of conventional whole cell patch-clamp recordings (VH = −40 mV) of 10 μM ATP-induced outward current comparing the action of 1 mM ASA (right) to control (left) on the first oscillatory response to that of subsequent application at distinct time intervals in minutes as indicated below each trace. B: ADP summary data. Each value represents current amplitude observed with each repeated application at subsequent times (1, 3, 5 min) normalized to that of the initial application of 10 μM ADP. Values are means ± SE for control n = 9 and ASA-treated n = 15 MKs. **P ≤ 0.01 at 3 min. *P < 0.05 at 5 min. C: ATP summary data. Results obtained with a similar protocol as in B. Values are means ± SE for control n = 8; ASA-treated n = 9 MKs. *P < 0.05 at 5 min.
To further investigate the individual roles of the P2Y and P2X pathways, the P2Y1 and P2Y12 agonist 2MeSADP was used in the same protocol as that used in Fig. 4. With this agonist, in conventional whole cell recordings, the decay in the outward oscillating current amplitude was remarkable in the control but it was considerably less or in some occasions, being completely absent after ASA incubation or indomethacin treatment. Significantly less desensitization in the ASA and indomethacin group was observed at the 5-min interval (Fig. 5) (P ≤ 0.05).
Fig. 5.

ASA and indomethacin treatment prevents decline of outward current amplitude in MKs induced by a P2Y receptor selective agonist. A: example of recordings of 5 μM 2-methyl-thio-ADP (2MeSADP)-induced outward current comparing in distinct MKs the action of 1 mM ASA (right) to control (left) on the first peak of the oscillatory response obtained with the 0-, 1-, 3-, 5-min protocol. B: 2MeSADP summary data. Each value represents the current amplitude observed with each repeated application of 5 μM 2MeSADP at subsequent times (1, 3, 5 min) normalized to that of the initial application. Values are means ± SE for control n = 15, ASA 1 μM-treated n = 7, and indomethacin 10 μM-treated n = 9 MKs. *P < 0.01 compared with control.
The TXA2 pathway is sensitive to COX-1 inhibition by ASA, and we observed effects of ASA on P2-induced currents. Thus we investigated a possible heterologous desensitization between TXA receptor activation and subsequent P2 responses in an additional set of cells. In 58% of MKs (n = 19) exposed to the TXA2 agonist U46619 at a concentration of 2 μM for 30 s, we measured oscillatory outward currents upon subsequent exposure to ADP. The remaining cells exhibited single peak responses. These results were not different from those obtained in the control group in this cell set exposed to ES, of which 57% (n = 7) of cells responded to ADP with oscillatory currents. The initial response was selected to study changes in the current amplitude over time. The time-dependent decrease in the P2-induced outward current amplitude was significantly greater in the U46619-treated cells compared with control (Fig. 6A). Strikingly, after exposure to 2 μM U46619 and 10 μM ADP, significant differences were observed compared with control cells. Furthermore, even after a thorough washout for a period of 5 min, none of the 11 cells tested were able to respond to ADP whereas the control group responded (n = 7). In contrast, MKs stimulated with 10 μM ATP did not show significant differences between control and experimental cells (n = 4 and 3, respectively), with most MKs responding even 5 min after the last stimulation with ATP. These results after exposure to the selective agonist of the TXA2 pathway suggest that this pathway is heterologously related to that activated by ADP but not by ATP.
Fig. 6.

A thromboxane agonist enhances desensitization of ADP-activated current in MKs. Purinergic-induced outward current amplitude decays after 30-s exposure to U46619 measured by patch-clamp recordings (VH = −40 mV). Values represent the current amplitude observed with the 0-, 1-, 3-, 5-min protocol normalized to that of the initial application of the P2 receptor agonist. A: 10 μM ADP summary response after exposure to 2 μM U46619, demonstrating heterologous desensitization of the P2Y and thromboxane receptor (TP) receptor pathways. Values are means ± SE for control n = 7 and U46619 2 μM-treated n = 19 MKs. *P ≤ 0.05. B: 10 μM ATP summary response after the exposure to 2 μM U46619. The lack of significant changes of the response after exposure to 2 μM U46619 indicates that the P2X pathway is not affected by TP receptor stimulation. Values are means ± SE for control n = 7 and U46619 2 μM-treated n = 5 MKs. P = not significant.
The increased amplitude of the 2MeSADP-induced outward currents indicates a possible change in sensitivity of MKs to P2Y agonist after exposure to ASA. We therefore investigated the dose dependency of this effect. As shown in Fig. 7A, the maximal 2MeADP-induced current amplitude increased in those cells incubated in 1 mM ASA or exposed to 10 μM MRS2179 compared with control. A similar outcome was observed in the dose-response curve for 2MeSADP (Fig. 7B) in MKs incubated in 1 mM ASA shifted to the left, indicating increased sensitivity to this agonist. To further understand the individual role of the distinct P2Y receptors reported in MKs (14, 45), we performed a dose-response experiment in the presence of 10 μM MRS2179 to block the P2Y1 receptors while stimulating the P2Y12 receptors with the nonselective P2Y agonist 2MeSADP and observed a shift to the left very similar to that seen with ASA treatment (Fig. 7B).
Fig. 7.

ASA increases maximal response and shifts to the left the dose response to the P2Y receptor agonist 2MeSADP. Summary of outward current recorded with nystatin-perforated patch clamp in MKs upon application of increasing doses of 2MeSADP. A: maximal currents observed in response to 5 μM 2MeSADP. Values are means ± SE for control n ≥ 10, 1 mM ASA-treated n ≥ 6, and 10 μM MRS2179-treated n ≥ 9 MKs; *P = 0.05. B: dose-response curves with current values normalized to the highest outward current amplitude. Values are means ± SE. □, Values for control n ≥ 10 cells in ES (EC50 = 0.20 μM). ●, Values for n ≥ 6 MKs incubated in 1 mM ASA for at least 30 min (EC50 = 0.033 μM). ▵, Values for n ≥ 9 cells stimulated with 2MeSADP in the presence of 10 μM MRS2179 (EC50 = 0.029 μM).
To further characterize the effect of ASA, we investigated in more detail the shape of each repetitive oscillatory outward current. We defined the duration of each peak as Iperiod and the interval between peaks as delay as has been previously done by Uneyama et al. (53) (Fig. 8A). Iperiod and delay were analyzed during the first 30 s of 2MeSADP application. While there was not a statistically significant difference between the control and the ASA and indomethacin Iperiod values, the delay under ASA and indomethacin treatment was significantly longer (P ≤ 0.05) suggesting changes in the [Ca2+]i dynamics with COX-1 inhibitors treatment (Fig. 8, B and C).
Fig. 8.

Changes in delay and duration of the peak (Iperiod) during the first 30 s 5 μM 2MeSADP exposure. A: example current traces recorded with the nystatin-perforated patch-clamp configuration from a control cell stimulated with 5 μM 2MeSADP. Dashed lines indicate the Iperiod (duration of the outward current), and the double-arrowed segment defines the “delay” as the time from 1 peak to the next. B: summary data illustrating values for delay in control cells compared with MKs incubated for 30 min in 1 mM ASA or exposed to 10 μM indomethacin. Values are means ± SE for control n ≥ 14, ASA n ≥ 17 cells, and indomethacin n = 9 cells. *P ≤ 0.05. C: summary of values for Iperiod in control cells and in cells incubated with 1 mM ASA for 30 min. Values are means ± SE for control n ≥ 10, ASA n ≥ 9, and indomethacin n ≥ 5. P = not significant.
DISCUSSION
Oscillatory outward currents have been recorded from rat MKs after adding ADP, ATP, and 2MeSADP using the nystatin-perforated patch configuration. The majority of MKs displayed repetitive oscillations that decreased over time but could be evoked again upon subsequent reapplication of agonists. These findings are consistent with those previously reported for oscillatory outward potassium currents in rat MKs (23, 53). These outward currents have been shown to be produced by the opening of Ca2+-activated K+ channels, reflecting variations in [Ca2+]i (24, 35). Current oscillations displayed a time-dependent decrease in amplitude that could in part be described as desensitization (Figs. 3 and 4) (46, 58) and exhibited a wide variation in amplitude in both control and experimental MKs. The variability could be accounted for by the diversity in the degree of maturation of the cells studied; it might also be related to the recently reported variability in stromal interaction molecule 1 (STIM1) translocation next to the Orai1 channel in the plasma membrane and Ca2+ leak currents through the store-operated Ca2+ entry (SOCE) system reported to be present in MKs (5, 51, 55).
Our results show that pretreatment with ASA decreases desensitization during continuous exposure to the agonist and subsequent purinergic challenge following recovery (Figs. 3–5). The 30-s protocol of continuous agonist exposure demonstrated that ASA treatment results in higher ATP-induced normalized currents (Fig. 3C) with significance at the 0-, 5-, and 20-s time points for nonnormalized responses (data not shown) and indicates a similar trend for ADP-induced currents as raw data although not significant. A possible mechanism for this observation involves the proposed model of ASA action as antiaggregant (59). This model proposes that direct activation of P2 receptor causes a priming resulting in [Ca2+]i increase. However, this is not sufficient to induce secondary aggregation and secretion. The critical factor for aggregation and secretion is the production of TXA2 that independently activates PLC and diacyl glycerol production. This in turn activates a PKC-dependent aggregation and secretion. Thus ASA treatment of platelets inhibits aggregation and secretion by blocking TXA2 production. We speculate that in MKs this secondary step, involving TXA2, may lead to a physiological feedback that decreases priming Ca2+ oscillations. Thus interfering with TXA2 production may allow [Ca2+]i to remain in the priming oscillatory range.
An alternative possibility to explain desensitization of outward current and the effects of ASA is that the release of ATP and ADP from dense granules, resulting from activation, leads to excessive purine exposure and homologous desensitization. Thus ASA inhibiting ATP and ADP released from dense granules would prevent P2 receptor desensitization. Our results showed that ATP-induced currents were significantly higher under ASA treatment whereas ADP-induced currents were not (Fig. 3). This difference is not likely to be indicative of differences in ASA action between the P2X and P2Y receptors as the ATP and ADP solutions used were not pure and usually contained both compounds (12). More probable is that the agonistic profile of the ATP solution is such that it elicits a greater response from the P2Y pathway than the ADP solution, at least with the 30-s continuous application paradigm.
Desensitization was also observed with applications of agonist using the 0-, 1-, 3-, 5-min protocol. This was attenuated by ASA treatment. However, in this time course, the ADP-evoked current was more strongly affected by ASA treatment with two different points (3 and 5 min) whereas ATP-induced currents were significantly affected only at 5 min (Fig. 4). Because cross activation between the P2 agonists used and the receptors studied has been shown (52), and again because of the impurity in the ATP and ADP solutions, more specific agonists were necessary to study the individual roles of each of these receptors. Therefore, the repeated-exposure protocol was performed with the P2Y-nonspecific agonist 2MeSADP to study the P2Y pathway. As expected, the results were very similar to those with ADP exposure (Fig. 4 and 5), strongly supporting a role for P2Y receptors. The decline of the response with repeated application may be due to previously discussed mechanisms. However, desensitization at longer time points may be also caused by intracellular changes such as temporary depletion of Ca2+ stores, uncoupling of the receptor from signaling molecules, PKC-mediated receptor internalization (40), or potassium current-related changes. Our results would rather support the hypothesis for a major role of TXA2 in decline of P2-induced current since similar results were observed with indomethacin (Fig. 5). We speculate that TXA2 has an inhibitory effect on the P2Y pathway because blocking the production of TXA2 with ASA increased P2Y receptor sensitivity in dose-response studies of outward current in MKs. To better understand how the TP pathway heterologously affects the P2 pathway, we used the TP receptor specific agonist U46619. We found a similar result in MKs: under the 0, 1, 3, and 5 min protocol, MKs exhibited significantly lower ADP-induced currents after 30 s of exposure to 2 μM U46619 than control cells (Fig. 6). Indeed, platelet aggregometry studies have recently reported that TP stimulation results in desensitization of the P2 pathway (3, 7, 26).
In our studies with the TP agonist U46619 we observed that the desensitization to ADP was striking whereas ATP-induced currents were not affected. At both the 1- and 3-min time periods, ADP-induced currents were significantly lower in amplitude after U46619 exposure, and most notably no cells responded at the 5-min time point (Fig. 6). These results in combination with those shown in Fig. 5 indicate that the TP pathway heterologously desensitizes the P2Y pathway. Thus we conclude that by using ASA and indomethacin to block COX-1 and COX-2, highly expressed in MKs (6, 45), and therefore the production of TXA2, desensitization of the P2Y pathway is attenuated. TP activation leads to increased [Ca2+]i with PKC activation and decreases the response to ADP. When ATP was used as an agonist, less desensitization was observed, whereas the TP agonist also fails to change the response. This evidence further supports the hypothesis for a distinct profile for ATP and ADP on P2Y pathway.
We also analyzed the dose-dependent activation of outward potassium current by measuring the response to a specific P2Y receptor agonist, 2MeSADP. To better understand the individual roles of the P2Y1 and P2Y12 receptors, we compared this dose response to that observed in the presence of MRS2179 to specifically block P2Y1 receptors. The maximal 2MeSADP-induced current recorded from MKs incubated in ASA and those exposed to MRS2179 were significantly higher than control (Fig. 7A). Interestingly, the current amplitude increased in both cases to about the same extent. Additionally, dose-response curves for 2MeSADP were obtained for control, for ASA treated cells, and in the presence of MRS179 (Fig. 7B). These three curves together indicate that P2Y1 receptor activation in control conditions decreases sensitivity to the P2Y agonist and that a similar effect is seen with ASA treatment.
Comparing the control and MRS2179 dose response, we observed an increase in both efficacy and potency in the presence of drug (Fig. 7B). Thus blocking the P2Y1 receptor apparently resulted in greater and more sensitive activation of the P2Y pathway with 2MeSADP. However, we cannot definitively conclude that the P2Y1 receptor is inhibitory because of the confounding effect that desensitization has during measurement of the dose response in changing subsequent responses to increasing agonist doses in the same cell studied.
Nevertheless, when the P2Y1 receptor was blocked the maximal current amplitude was larger than control, suggesting that selective activation of P2Y1 receptor has an inhibitory role, perhaps via desensitization. Importantly, we observed that the 2MeSADP dose response was changed in a very similar way by ASA and the P2Y1 antagonist. This leads us to speculate that the mechanisms involved may be similar and may relate to desensitization occurring when P2Y1 and P2Y12 receptor are both active. This hypothesis is supported by previous reports on homologous desensitization of the P2Y1 receptor in platelets caused by PLCβ inhibition by PKC (13, 40). The similarity between the MRS2179 and the ASA-treated maximal amplitude current values (Fig. 7A) suggests that ASA treatment might be preventing a PKC-regulated P2Y1 inhibition, increasing the amplitude of maximal currents similarly to MRS2179.
In addition to current amplitude, the delay and Iperiod of purine-induced outward currents were also studied. Although Iperiod did not change significantly after ASA and indomethacin treatment, 2MeSADP-induced oscillatory currents displayed a significantly higher average delay after ASA and indomethacin (Fig. 8). This increase in delay seems consistent with lower reactivity related to the “priming” mode of MK activation. At the same time, because ASA and indomethacin treatment did not affect the Iperiod, it is unlikely that Ca2+ exit from the cytosol is affected. Iperiod is indicative of the time that [Ca2+]i is increased from baseline levels because outward K+ channels are open (46). Therefore, our data suggest that the way Ca2+ exits the cytosol, via sarco(endo)plasmic reticulum Ca2+-ATPase and Ca2+ ATPases, is not likely affected by COX inhibition. Rather, our results suggest an effect on the mobilization of intracellular Ca2+, as indicated by the increased delay under ASA and indomethacin treatment. Ca2+ increases in the cytosol from two sources: extracellular and from the dense tubular system. One or both of these systems may be altered by ASA in such a way that they act less frequently, but when they do act, they produce a higher concentration of Ca2+ in the cytosol as indicated by the increased current amplitude and delay (Figs. 3–5 and 8). Longer delay between currents during the oscillation implies more time to replenish calcium in intracellular stores. Thus, by increasing the delay, ASA treatment prevents the temporary depletion of intracellular Ca2+ stores that might represent an additional cause for the decrease of outward current observed in control conditions. The effect of ASA on delay may be linked to the reported acetylation of the DTS membrane with ASA (15). Entry of external Ca2+ to the cytosol contributes less to changes in cell reactivity, as evidenced by previous reports that the Ca2+ activated K+ currents occur even in Ca2+ free extracellular solution (24, 25, 35). The other possibility for ASA-reduced desensitization of MKs is that ASA might affect the STIM1 DTS-Ca2+ sensor sensitivity through Orai1-mediated Ca2+ entry generating higher Ca2+-induced K+ current amplitude. It has been reported that murine MKs express functional SOCE proteins and that the ADP-induced currents could be the result of Ca2+ release-activated Ca2+ (CRAC) and C-type transient receptor potential-6 (TRPC6) channels. ASA may generate high buffering with selective SOCE activation where ADP induces a typical CRAC channel. (51) In human platelets TRPC1-STIM1-IP3r interaction has been demonstrated suggesting a more complex system where ASA could play a role (29). Despite the use of antiplatelet drugs, morbidity and mortality rates in cardiovascular disease continue to be high. The standard therapy to control thrombotic episodes leading to ischemic heart disease or recurrent stroke is not enough to ensure patient survival without complications such as bleeding and especially periprocedural myocardial infarction (18). A better understanding of platelet physiology will improve the development of new strategies to control platelet reactivity. Our results are a first step in elucidating ASA mechanisms with an electrophysiological approach. However, it is difficult at the present to make firm conclusion to ASA effects and resistance as further studies will be required.
In summary, using rat MKs as a model of platelet reactivity, our results provide significant insight into the actions of ASA on purinergic-induced platelet reactivity that may contribute to future understanding of aspirin control of clot formation and the ASA resistance phenomenon.
GRANTS
Jose Young is supported by a National Secretariat for Science, Technology and Innovation of Panama (SENACYT) predoctoral scholarship, Panama. Jacob Beckerman is supported by the Howard Hughes Scholars Program.
ACKNOWLEDGMENTS
We thank Drs. John Partridge and Zhanyan Fu and Megan Janssen for advice during these experiments.
REFERENCES
- 1.A randomised, blinded, trial of clopidogrel versus aspirin in patients at risk of ischaemic events (CAPRIE) CAPRIE Steering Committee. Lancet 348: 1329–1339, 1996 [DOI] [PubMed] [Google Scholar]
- 2.Authi KS. TRP channels in platelet function. Handb Exp Pharmacol 179: 425–443, 2007 [DOI] [PubMed] [Google Scholar]
- 3.Barton JF, Hardy AR, Poole AW, Mundell SJ. Reciprocal regulation of platelet responses to P2Y and thromboxane receptor activation. J Thromb Haemost 6: 534–543, 2008 [DOI] [PubMed] [Google Scholar]
- 4.Baurand A, Eckly A, Hechler A, Kauffenstein G, Galzi JL, Cazenave JP, Léon C, Gachet C. Differential regulation and relocalization of the platelet P2Y receptors after activation: a way to avoid loss of hemostatic properties? Mol Pharmacol 67: 721–733, 2005 [DOI] [PubMed] [Google Scholar]
- 5.Bergmeier W, Stefanini L. Novel molecules in calcium signaling in platelets. J Thromb Haemost 7, Suppl 1: 187–190, 2009 [DOI] [PubMed] [Google Scholar]
- 6.Borgdorff P, Tangelder G, Paulus W. Cyclooxygenase-2 inhibitors enhance shear stress-induced platelet aggregation. J Am Coll Cardiol 48: 817–823, 2006 [DOI] [PubMed] [Google Scholar]
- 7.Bynagari YS, Nagy B, Tuluc F, Bhavaraju K, Kim S, Vijayan KV, Kunapuli S. Mechanism of activation and functional role of protein kinase C in human platelets. J Biol Chem 284: 13413–13421, 2009 [DOI] [PMC free article] [PubMed] [Google Scholar]
- 8.Carter R, Tolhurst G, Walmsley G, Vizuete-Forster M, Miller N, Mahaut-Smith MP. Molecular and electrophysiological characterization of transient receptor potential ion channels in the primary murine megakaryocyte. J Physiol 576: 151–162, 2006 [DOI] [PMC free article] [PubMed] [Google Scholar]
- 9.Catella-Lawson F, Reilly MP, Kapoor SV, Cucchiara S, De Marco S, Tournier B, Vyas S, Fitzgerald G. Cyclooxygenase inhibitors and the antiplatelet effects of aspirin. N Engl J Med 345: 1809–1817, 2001 [DOI] [PubMed] [Google Scholar]
- 10.Cavallini L, Coassin M, Borean A, Alexandre A. Prostacyclin and sodium nitroprusside inhibit the activity of the platelet inositol 1,4,5-trisphosphate receptor and promote its phosphorylation. J Biol Chem 271: 5545–5551, 1996 [DOI] [PubMed] [Google Scholar]
- 11.Cazenave JP, Gachet C. Anti-platelet drugs: do they affect megakaryocytes? Baillieres Clin Haematol 10: 163–180, 1997. [DOI] [PubMed] [Google Scholar]
- 12.Coller BS. A brief and highly selective history of ideas about platelets in health and disease. In: Platelets, edited by Michelson AD. San Diego, CA: Elsevier Academic, 2002, p. xxxvi [Google Scholar]
- 13.Crisanti P, Leon A, Lim DM, Omri B. Aspirin prevention of NMDA-induced neuronal death by direct protein kinase Cζ inhibition. J Neurochem 93: 1587–1593, 2005. [DOI] [PubMed] [Google Scholar]
- 14.Famaey P, Paulus HE, Eds. Therapeutic Applications of NSAIDS Subpopulations and New Formulations. New York: Dekker, 1992 [Google Scholar]
- 15.Hack N, Carey F, Crawford N. The inhibition of platelet cyclo-oxygenase by aspirin is associated with the acetylation of a 72kDa polypeptide in the intracellular membranes. Biochem J 223: 105–111, 1984 [DOI] [PMC free article] [PubMed] [Google Scholar]
- 16.Hardy A, Conley PB, Luo J, Benovic JL, Poole AW, Mundell S. P2Y1 and P2Y12 receptors for ADP desensitize by distinct kinase-dependent mechanisms. Blood 105: 3552–3560, 2005 [DOI] [PubMed] [Google Scholar]
- 17.Heron M, Hoyert D, Murphy S, Xu J, Kochanek K, Tejada-Vera B. Deaths: final data for 2006. Natl Vital Stat Rep 57: 1–34, 2009 [PubMed] [Google Scholar]
- 18.Hildemann SK, Bode C. Improving antiplatelet therapy for atherothrombotic disease: preclinical and clinical results with SCH 530348, the first oral thrombin receptor antagonist selective for PAR-1. Hamostaseologie 29: 349–355, 2009 [PubMed] [Google Scholar]
- 19.Hussain JF, Mahaut-Smith MP. ADP and inositol trisphosphate evoke oscillations of a monovalent cation conductance in rat megakaryocytes. J Physiol 511: 791–801, 1998 [DOI] [PMC free article] [PubMed] [Google Scholar]
- 20.Ikeda M. Characterization of functional P2X1 receptors in mouse megakaryocytes. Thromb Res 119: 343–353, 2007 [DOI] [PubMed] [Google Scholar]
- 21.Jennings L. Variability in platelet response to the antiplatelet agents aspirin and clopidogrel: mechanisms, measurement, and clinical relevance. Crit Pathw Cardiol 8: 20–28, 2009 [DOI] [PubMed] [Google Scholar]
- 22.Jin J, Quinton T, Zhang J, Rittenhouse S, Kunapuli S. Adenosine diphosphate (ADP)-induced thromboxane A2 generation in human platelets requires coordinated signaling through integrin αIIbβ3 and ADP receptors. Blood 99: 193–198, 2002 [DOI] [PubMed] [Google Scholar]
- 23.Kawa K. Voltage-gated calcium and potassium currents in megakaryocytes dissociated from guinea-pig bone marrow. J Physiol 431: 187–206, 1990 [DOI] [PMC free article] [PubMed] [Google Scholar]
- 24.Kawa K. ADP-induced rapid inward currents through Ca2+-permeable cation channels in mouse, rat and guinea-pig megakaryocytes: a patch-clamp study. J Physiol 495: 339–352, 1996 [DOI] [PMC free article] [PubMed] [Google Scholar]
- 25.Kawa K. Discrete but simultaneous release of adenine nucleotides and serotonin from mouse megakaryocytes as detected with patch- and carbon-fiber electrodes. Am J Physiol Cell Physiol 286: C119–C128, 2004 [DOI] [PubMed] [Google Scholar]
- 26.Kim JM, Koo YK, Jin J, Lee YY, Park S, Yun-Choi HS. Augmentation of U46619 induced human platelet aggregation by aspirin. Platelets 20: 111–119, 2009 [DOI] [PubMed] [Google Scholar]
- 27.Leven RM, Mullikin WH, Nachmias VT. Role of sodium in ADP- and thrombin-induced megakaryocyte spreading. J Cell Biol 96: 1234–1240, 1983 [DOI] [PMC free article] [PubMed] [Google Scholar]
- 28.Leven RM, Yee MK. Megakaryocyte morphogenesis stimulated in vitro by whole and partially fractionated thrombocytopenic plasma: a model system for the study of platelet formation. Blood 69: 1046–1052, 1987 [PubMed] [Google Scholar]
- 29.López JJ, Salido GM, Pariente JA, Rosado JA. Interaction of STIM1 with endogenously expressed human canonical TRP1 upon depletion of intracellular Ca2+ stores. J Biol Chem 281: 28254–28264, 2006 [DOI] [PubMed] [Google Scholar]
- 30.MacIntyre DE, Rink TJ. The role of platelet membrane potential in the initiation of platelet aggregation. Thromb Haemost 26: 22–26, 1982 [PubMed] [Google Scholar]
- 31.Mahaut-Smith MP, Hussain JF, Mason M. Depolarization-evoked Ca2+ release in a non-excitable cell, the rat megakaryocyte. J Physiol 515: 385–390, 1999 [DOI] [PMC free article] [PubMed] [Google Scholar]
- 32.Mahaut-Smith MP, Rink TJ, Sage SO. Single channels in human platelets activated by ADP. J Physiol 415: 24P, 1990 [Google Scholar]
- 33.Mahaut-Smith MP, Rink TJ, Sage SO. Rapid ADP-evoked currents in human platelets recorded with the nystatin permeabilized patch technique. J Biol Chem 267: 3060–3065, 1992 [PubMed] [Google Scholar]
- 34.Mahaut-Smith MP, Ennion SJ, Rolf MG, Evans RJ. ADP is not an agonist at P2X1 receptors: evidence for separate receptors stimulated by ATP and ADP on human platelets. Br J Pharmacol 131: 108–114, 2000 [DOI] [PMC free article] [PubMed] [Google Scholar]
- 35.Martinez-Pinna J, Gurung I, Vial C, Leon C, Gachet C, Evans R, Mahaut-Smith MP. Direct voltage control of signaling via P2Y1 and other Gαq-coupled receptors. J Biol Chem 280: 1490–1498, 2005 [DOI] [PubMed] [Google Scholar]
- 36.Mason MJ, Simpson AK, Mahaut-Smith MP, Robinson HP. The interpretation of current-clamp recordings in the cell-attached patch-clamp configuration. Biophys J 88: 739–750, 2005 [DOI] [PMC free article] [PubMed] [Google Scholar]
- 37.Matasić R, Dietz AB, Vuk-Pavlović S. Cyclooxygenase-independent inhibition of dendritic cell maturation by aspirin. Immunology 101: 53–60, 2000 [DOI] [PMC free article] [PubMed] [Google Scholar]
- 38.Medina HM, Bhatt DL. Evolution of anticoagulant and antiplatelet therapy: benefits and risks of contemporary pharmacologic agents and their implications for myonecrosis and bleeding in percutaneous coronary intervention. Clin Cardiol 30, Suppl 2: II4–II15 2007 [DOI] [PMC free article] [PubMed] [Google Scholar]
- 39.Murase K, Ryu PD, Randic M. Excitatory and inhibitory amino acids and peptide-induced responses in acutely isolated rat spinal dorsal horn neurons. Neurosci Lett 103: 56–63, 1989 [DOI] [PubMed] [Google Scholar]
- 40.Mundell S, Jones M, Hardy A, Barton J. Distinct roles for protein kinase C isoforms in regulating platelet purinergic receptor function. Mol Pharmacol 70: 1132–1142, 2006 [DOI] [PubMed] [Google Scholar]
- 41.O'Kane P, Xie L, Liu Z, Queen L, Jackson G, Ji Y, Ferro A. Aspirin acetylates nitric oxide synthase type 3 in platelets thereby increasing its activity. Cardiovasc Res 83: 123–130, 2009 [DOI] [PubMed] [Google Scholar]
- 42.Patrono C. Aspirin resistance: definition, mechanisms and clinical read-outs. J Thromb Haemost 1: 1770–1713, 2003 [DOI] [PubMed] [Google Scholar]
- 43.Purvis JE, Chatterjee MS, Brass LF, Diamond SL. A molecular signaling model of platelet phosphoinositide and calcium regulation during homeostasis and P2Y1 activation. Blood 112: 4069–4079, 2008 [DOI] [PMC free article] [PubMed] [Google Scholar]
- 44.Rink TJ, Sage SO. Calcium signaling in human platelets. Annu Rev Physiol 52: 431–449, 1990 [DOI] [PubMed] [Google Scholar]
- 45.Rocca B, Secchiero P, Ciabattoni G, Ranelletti F, Catani L, Guidotti L, Melloni E, Maggiano N, Zauli G, Patrono C. Cyclooxygenase-2 expression is induced during human megakaryopoiesis and characterizes newly formed platelets. Proc Natl Acad Sci USA 99: 7634–7639, 2002 [DOI] [PMC free article] [PubMed] [Google Scholar]
- 46.Somasundaram B, Mahaut-Smith MP. Three cation influx currents activated by purinergic receptor stimulation in rat megakaryocytes. J Physiol 480: 225–231, 1994 [DOI] [PMC free article] [PubMed] [Google Scholar]
- 47.Somasundaram B, Mahaut-Smith MP. A novel monovalent cation channel activated by inositol trisphosphate in the plasma membrane of rat megakaryocytes. J Biol Chem 270: 16638–16644, 1995. [DOI] [PubMed] [Google Scholar]
- 48.Tanzilli G, Greco C, Pelliccia F, Pasceri V, Barillà F, Paravati V, Pannitteri G, Gaudio C, Mangieri E. Effectiveness of two-year clopidogrel + aspirin in abolishing the risk of very late thrombosis after drug-eluting stent implantation (from the TYCOON [two-year ClOpidOgrel need] study). Am J Cardiol 104: 1357–1361 2009 [DOI] [PubMed] [Google Scholar]
- 49.The International Stroke Trial (IST): a randomized trial of aspirin, subcutaneous heparin, both, or neither among 19435 patients with acute ischaemic stroke. International Stroke Trial Collaborative Group. Lancet 349: 1569–1581, 1997 [PubMed] [Google Scholar]
- 50.Thomas D, Mason MJ, Mahaut-Smith MP. Depolarisation-evoked Ca2+ waves in the non-excitable rat megakaryocyte. J Physiol 537: 371–378, 2001 [DOI] [PMC free article] [PubMed] [Google Scholar]
- 51.Tolhurst G, Carter RN, Amisten S, Holdich JP, Erlinge D, Mahaut-Smith MP. Expression profiling and electrophysiological studies suggest a major role for Orai1 in the store-operated Ca2+ influx pathway of platelets and megakaryocytes. Platelets 19: 308–313, 2008 [DOI] [PMC free article] [PubMed] [Google Scholar]
- 52.Tolhurst G, Vial C, Léon C, Gachet C, Evans RJ, Mahaut-Smith MP. Interplay between P2Y1, P2Y12, and P2X1 receptors in the activation of megakaryocyte cation influx currents by ADP: evidence that the primary megakaryocyte represents a fully functional model of platelet P2 receptor signaling. Blood 106: 1644–1651, 2005 [DOI] [PubMed] [Google Scholar]
- 53.Uneyama C, Uneyama H, Akaike N. Cytoplasmic Ca2+ oscillation in rat megakaryocytes evoked by a novel type of purinoceptor. J Physiol 470: 731–749, 1993. [DOI] [PMC free article] [PubMed] [Google Scholar]
- 54.United States Pharmacopeial Convention Salicylates (systemic). United States Pharmacopeia/National Formulary, Drug Information for the Health Professional. I. Englewood, CO: Micromedex, 2000, p. 2734 [Google Scholar]
- 55.Várnai P, Tóth B, Tóth DJ, Hunyady L, Balla T. Visualization and manipulation of plasma membrane-endoplasmic reticulum contact sites indicates the presence of additional molecular components within the STIM1-Orai1 complex. J Biol Chem 282: 29678–29690, 2007 [DOI] [PubMed] [Google Scholar]
- 56.Vial C, Rolf M, Mahaut-Smith M, Evans R. A study of P2X1 receptor function in murine megakaryocytes and human platelets reveals synergy with P2Y receptors. Br J Pharmacol 135: 363–372, 2002 [DOI] [PMC free article] [PubMed] [Google Scholar]
- 57.Weber R, Weimar C, Diener HC. Antiplatelet agents in stroke prevention. Acute and long-term treatment strategies. Hamostaseologie 29: 326–333, 2009 [PubMed] [Google Scholar]
- 58.Weber AA, Zimmermann KC, Meyer-Kirchrath J, Schrör K. Cyclooxygenase-2 in human platelets as a possible factor in aspirin resistance. Lancet 353: 900, 1999. [DOI] [PubMed] [Google Scholar]
- 59.Werner MH, Senzel L, Bielawska A, Khan W, Hannun YA. Diacylglycerol overcomes aspirin inhibition of platelets: evidence for a necessary role for diacylglycerol accumulation in platelet activation. Mol Pharmacol 39: 547–556, 1991 [PubMed] [Google Scholar]
- 60.Worthington RE, Nakeff A. Aspirin inhibits rat megakaryocyte thromboxane synthesis. Prostaglandins 23: 841–853, 1982. [DOI] [PubMed] [Google Scholar]