Abstract
Patients receiving lithium therapy, an effective treatment for bipolar disorder, often present with acquired nephrogenic diabetes insipidus. The nephrotoxic effects of lithium can be detected 3 wk after the start of treatment and many of these symptoms may disappear in a few weeks after lithium use is stopped. Most patients, however, still have a urine-concentrating defect years after ending treatment. This prompted an investigation of the transporters involved in the urine concentration mechanism, UT-A1, UT-A3, aquaporin-2 (AQP2), and NKCC2, after discontinuing lithium therapy. Sprague-Dawley rats fed a Li2CO3-supplemented diet produced large volumes of dilute urine after 14 days. After lithium treatment was discontinued, urine osmolality returned to normal within 14 days but urine volume and urine urea failed to reach basal levels. Western blot and immunohistochemical analyses revealed that both urea transporters UT-A1 and UT-A3 were reduced at 7 and 14 days of lithium treatment and both transporters recovered to basal levels 14 days after discontinuing lithium administration. Similar analyses demonstrated a decrease in AQP2 expression after 7 and 14 days of lithium therapy. AQP2 expression increased over the 7 and 14 days following the cessation of lithium but failed to recover to normal levels. NKCC2 expression was unaltered during the 14-day lithium regimen but did increase 14 days after the treatment was stopped. In summary, the rapid restoration of UT-A1 and UT-A3 as well as the increased expression of NKCC2 are critical components to the reestablishment of urine concentration after lithium treatment.
Keywords: urea transporter, aquaporin-2, acquired nephrogenic diabetes insipidus
nephrogenic diabetes insipidus (NDI) is characterized by the inability of the kidney to concentrate urine in the presence of the antidiuretic hormone, vasopressin, therefore leading to excessive volumes of dilute urine. NDI is classified into two types: congenital NDI, which results from mutations in the vasopressin V2 receptor gene (3); or the more commonly observed form, acquired NDI, which is often an effect of hypokalemia, hypercalcemia, or certain drug therapies including the most common and effective treatment for bipolar disorder, lithium. Approximately 40% of patients receiving this therapy present with acquired NDI (19). Nephrotoxic effects of lithium may be detected 8 wk after the start of treatment (6). Patients on lithium therapy for over 10 years may suffer from chronic kidney disease or hypercalcemia (9). Lithium treatment may be discontinued to prevent further fibrosis, although, in some cases, the progression of renal failure remains (9). NDI symptoms may disappear in as little as 3 wk after lithium use is stopped; however, a little over 60% of patients continue to report concentrating defects 1 yr after ceasing lithium therapy (7).
Although plasma vasopressin levels are elevated (1), acute administration of lithium inhibits the formation of cAMP (20), thereby preventing activation of PKA. PKA phosphorylation of two critical transporters in the urine concentration mechanism, aquaporin-2 (AQP2) and UT-A1, is required for translocation and insertion of these transporters into the apical plasma membrane of the inner medullary collecting duct (5, 11). This initial dysregulation of vasopressin-regulated water reabsorption contributes to the urine-concentrating defect observed in lithium-treated rats.
We and others showed that chronic lithium administration results in a reduction of AQP2 and UT-A1 protein abundances in rat inner medulla (8, 14, 15), which further exacerbates the observed polyuria. Little work has been done to monitor the recovery of these transporters after lithium therapy has been discontinued. One study by Christensen et al. (8) showed that APQ2 abundance returned to normal after a 4-wk recovery from lithium treatment. These results do not correlate with the persistence of concentrating defects observed in patients after termination of lithium therapy. This prompted us to investigate the potential contribution of the other transporters involved in the urine concentration mechanism, UT-A1, UT-A3, and NKCC2, after discontinuation of lithium therapy.
MATERIALS AND METHODS
Experimental animals and protocol.
All animal protocols were approved by the Emory University Institutional Animal Care and Use Committee (IACUC). Male Sprague-Dawley rats (Charles River Laboratories, Wilmington, MA), weighing 100–150 g, were fed standard diet (containing 23% protein) supplemented with Li2CO3 (40 mmol/kg; Harlan Teklad, Madison, WI) for either 7 or 14 days. Male Sprague-Dawley rats that were fed unsupplemented, standard diet were used as controls for this study. This dosage and time course result in serum lithium levels comparable to therapeutic levels in human serum (0.8–1.3 meq/l) while minimizing weight loss in the rats (2, 14). Rats were given free access to tap water and a salt block to maintain sodium balance and prevent lithium intoxication. After 14 days of lithium treatment, rats were given standard diet (Purina), free access to tap water, and a salt block for either 7 or 14 days. Rats were housed individually in metabolic cages for 24 h on day 7 and day 14 of lithium treatment and day 7 and day 14 after lithium treatment was stopped. Urine volume, osmolality, and urea composition were measured over that 24-h interval.
Blood and urine analysis.
Blood lithium levels were obtained from the serum of collected trunk blood at the time of death. Lithium toxicology was determined by the Emory Medical Laboratory at the Emory University Hospital. Urine osmolality was measured on Wescor 5520 Vapor Pressure Osmometer (Wescor, Logan, UT). Urine urea concentration was determined using Infinity Urea Reagent from Thermo Scientific (Thermo Fisher Scientific, Chicago, IL).
Tissue preparation for Western blot analysis.
Kidneys were removed and dissected into inner medulla (IM) and outer medulla (OM) at 4°C. Fresh kidney tissues were homogenized in a glass tissue grinder in ice-cold isolation buffer (10 mM triethanolamine, 250 mM sucrose, pH 7.6, 1 μg/ml leupeptin, and 2 mg/ml PMSF), and then SDS was added to a final concentration of 1% for Western blot analysis of the total cell lysate. After centrifugation at 13,000 rpm for 20 min at 4°C, the protein concentration was determined by a modified Lowry method (Bio-Rad DC protein assay kit, Hercules, CA). The appropriate amount of each sample was diluted in a Tris-glycine/SDS sample buffer (125 mM Tris, pH 6.8, 4% SDS, 10% glycerol, 10% β-mercaptoethanol, 0.02% bromophenol blue) and heated at 100°C for 2 min.
Western blot analysis.
Proteins (10–20 μg/lane) were size separated by SDS-PAGE and then electroblotted to polyvinylidene difluoride membranes (Millipore, Bedford, MA). Membranes were probed with primary antibody overnight at 4°C. Antibodies derived and characterized in this laboratory including COOH-terminal UT-A1 (detects UT-A1 exclusively), NH2-terminal UT-A1 (detects UT-A1 and UT-A3 simultaneously), AQP2, and NKCC2 were used to determine the level of respective protein abundances. The secondary antibody used for detection was Alexa Fluor 680-linked anti-rabbit IgG (Invitrogen, Chicago, IL). Proteins were visualized using infrared detection with the LI-COR Odyssey protein analysis system (LI-COR, Lincoln, NE). Laser densitometry was used to quantify the intensity of the resulting bands. Densitometry values were calculated based on tubulin loading controls, normalized, and are reflected as percent of control.
Tissue preparation for immunohistochemistry.
In accordance with IACUC-approved protocols, animals were initially anesthetized with isofluorane (Hospira, Lake Forest, IL) in a chamber and then transferred to anesthesia by nose piece for the remainder of the perfusion process. The rat was opened with an abdominal incision projecting to the sternum. The diaphragm was cut to expose the abdominal aorta, and a 21-gauge needle was inserted in the aorta. The vasculature was perfused with 1× PBS solution for 1–2 min, or until the kidney changed color from red/brown to beige/white by the removal of the blood. Then, both kidneys were perfusion fixed with 4% paraformaldehyde for 7 additional min. The kidneys were cut transversely into thick slices (3–4 mm) and placed in 4% paraformaldehyde overnight at 4°C.
Tissue blocks from whole kidneys were dehydrated in a graded series of ethanol (2 h each in 70, 96, and 99%, respectively) and xylene (overnight). The perfusion-fixed kidneys were subjected to paraffin embedding. Paraffin sections (5 μm thick) were cut on a Leica microtome and dried overnight at 37°C.
Immunoperoxidase staining.
Slides with kidney sections were placed in xylene overnight and then rehydrated in a graded series of ethanol (30 min in 99% ethanol and 10 min in 96% ethanol) and endogenous peroxidases were blocked with H2O2 (1% H2O2 solution in methanol) for 30 min. Target retrieval was accomplished by microwaving samples with 10 mmol/l Tris and 0.5 mmol/l EGTA (TEG) buffer. To prevent nonspecific antibody binding, sections were further blocked with 50 mmol/l NH4Cl in PBS (30 min) followed by 3 × 10-min incubation with 1% BSA, 0.2% gelatin, and 0.05% saponin in PBS. Tissue sections were incubated overnight at 4°C in a humidified chamber with primary antibody (1:50,000 COOH-terminal UT-A1, 1:10,000 AQP2, 1:2,000 NKCC2). The tissue sections were then incubated the following day with secondary antibody (anti-rabbit IgG) conjugated to horseradish peroxidase (GE Healthcare/Amersham Biosciences, Piscataway, NJ) for 2 h at room temperature. The secondary antibody was washed off with 0.1% BSA, 0.2% gelatin, and 0.05% saponin in PBS three times, for 10 min each. Positive staining was visualized using a diaminobenzidine dye (brown; Amreso, Solon, OH). Cell nuclei were also counterstained with hematoxylin (blue; EMD Chemicals, Gibbstown, NJ). Images were collected with an Olympus 1X51 inverted fluorescence microscope using a SIS-CC12 CLR camera. Photos of the stained tissues were taken at ×10 and ×40 magnifications.
Statistical analysis.
Values are SE from each experimental group where n = 12. Densitometry values were calculated based on tubulin loading controls. The densitometries from each group of animals were averaged, normalized to the untreated control values, and the data were presented as means ± SE for the percent change from the control value. To test for statistical significance between the multiple groups, we used an ANOVA followed by Newman-Keuls test. The criterion for statistical significance was P < 0.05.
RESULTS
In vivo parameters.
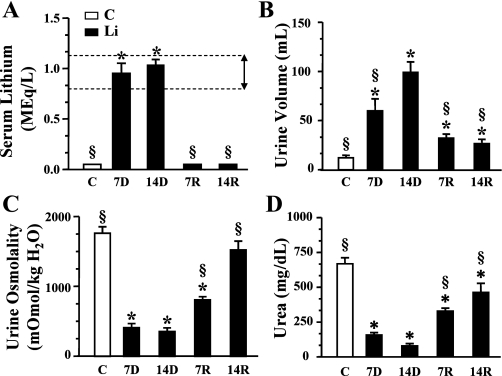
The rats were fed a chow supplemented with lithium for 7 or 14 days followed by replacement with normal (unsupplemented) chow for an additional 14 days as described in materials and methods. Control animals were fed unsupplemented chow for the duration of the study. Samples of blood were collected at death which occurred at 7 and 14 days of lithium feeding (7D, 14D) and 7 and 14 days postlithium removal (7R, 14R). The plasma lithium levels were reported to be <0.2 meq/l in the nonlithium-fed animals. After 7 days of lithium feeding, the animals achieved plasma lithium levels of 1.0 ± 0.1 meq/l which is comparable to human therapeutic levels (0.8–1.3 meq/l; Fig. 1A). After 14 days on the lithium diet, serum lithium levels continued to remain high (1.0 ± 0.1 meq/l) but were not statistically different from the 7-day measurements. Serum lithium concentration returned to levels <0.2 meq/l within 7 days of cessation of Li feeding and remained low for the additional 7 days that were followed in this study (Fig. 1A). Rats were individually housed in metabolic cages to determine urine output over 24 h. Whereas control rats excreted 13 ± 1.6 ml of urine over 24 h, there was a significant increase in the volume of urine produced by the rats receiving lithium after 7 days of the onset of the feeding protocol (61 ± 11 ml; Fig. 1B). Rats on the lithium diet for 14 days produced on average 101 ± 9.99 ml of urine during 24 h which was significantly higher than urine output of their 7-day counterparts and an approximate eightfold increase over control animals. Urine output was significantly reduced 7 days (33 ± 3.4 ml) and 14 days (27 ± 3.4 ml) after discontinuing the lithium treatment; however, the volume excreted remained significantly greater than that of control animals. In addition to the increase in urine volume, lithium-fed animals also displayed a corresponding decrease in the urine osmolality after 7 days (412 ± 55.9 mosmol/kgH2O) and 14 days (353 ± 52.7 mosmol/kgH2O) compared with control animals (1,765 ± 90.66 mosmol/kgH2O; Fig. 1C). Upon the cessation of the lithium-feeding regimen, the urine osmolality began to return to control levels after 7 days (806 ± 45.6 mosmol/kgH2O). Two weeks postlithium feeding, the recovered animals’ urine osmolality was 1,521 ± 127.9 mosmol/kgH2O, reflecting a significant return to control osmolality. The urine urea levels in the lithium-fed animals were reduced at 7 days (157 ± 21.4 mg/dl) compared with control urea levels (600 ± 56.9 mg/dl; Fig. 1D). Urine urea was further reduced at 14 days (86 ± 19 mg/dl). Upon cessation of Li feeding, urine urea levels rebounded to 327 ± 21.7 and 446 ± 60.1 mg/dl after 7 and 14 days, respectively (Fig. 1D). Interestingly, urine urea levels did not significantly recover to normal levels.
Fig. 1.
In vivo parameters. Control and lithium-treated rat values presented as bar graphs giving means ± SE. Open bars represent control animals and filled bars are lithium-treated rats. C, control untreated animals; 7D, 7-day lithium treatment; 14D, 14-day lithium treatment; 7R, 7-day refeeding normal chow; 14R, 14 days of refeeding. N = 12 rats/group. *P < 0.05 vs. controls. §P < 0.05 vs. 14D. A: plasma Li levels in control vs. Li-treated animals. The horizontal dashed lines represent the theraputic range of lithium found in human patients undergoing lithium therapy (marked with a double headed arrow). B: 24-h urine volumes for each group of rats. C: urine osmolality for each group of rats. D: urine urea nitrogen for each group of rats.
Changes in the urea transporters after lithium treatment and recovery.
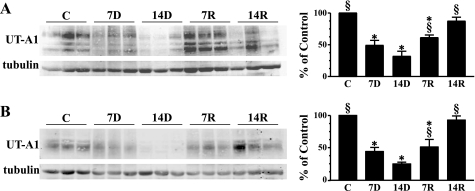
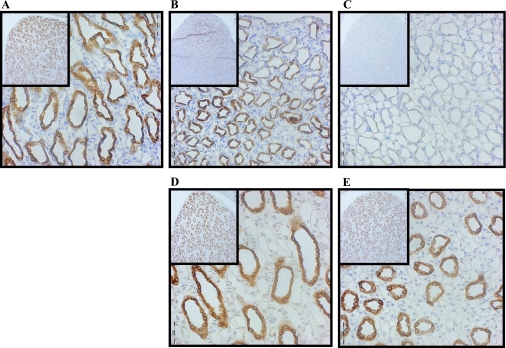
UT-A1 is one of the two urea transporters located in the in the IM. UT-A1 is localized to the apical membrane of inner medullary collecting ducts in both IM tip and base tissues. After 7 days of lithium feeding, Western blot analysis showed that the protein abundance of UT-A1 in the IM tip was significantly reduced by 49% compared with control animal expression (Fig. 2A). UT-A1 expression in the IM tip was further decreased after 14 days of lithium treatment. These results confirm previous reports from our laboratory (14). The protein abundance of both 117- and 97-kDa glycoprotein forms of UT-A1 rebounded about twofold 7 days after cessation of lithium feeding (Fig. 2A). UT-A1 protein abundance was returned to normal after 14 days in the absence of lithium (Fig. 2A). In the IM base, where only the 97-kDa isoform of UT-A1 is observed, the same trend existed with a significant decrease in transporter abundance at 7 and 14 days of lithium treatment (Fig. 2B). During the recovery period postlithium feeding, UT-A1 expression in the IM base was increased about twofold after 7 days and a complete recovery of the transporter was observed after 14 days (Fig. 2B). In an animal model of diabetes mellitus, which is also characterized by polyuria, there is a redistribution of the 117-kDa UT-A1 from the IM tip to the base. This was not observed in the lithium-treated animals. Immunohistochemistry of kidneys from experimental animals probed with an antibody to UT-A1, while not quantitative, also showed a decrease with lithium treatment and an increase on lithium removal (Fig. 3, A-E). The micrographs also show that there is an equal loss of protein throughout the IM (shown at ×10 magnification in the figure inset). UT-A1 was observed throughout the cell and at the apical surface (×40 magnification). This localization of UT-A1 was not altered in the lithium-treated animal.
Fig. 2.
Western blot analysis of UT-A1 in inner medulla (IM) tip and IM base. A: provided are 3 representative samples of IM tip lysates from each lithium treatment/recovery group. C, 7D, 14D, 7R, and 14R represent the same experimental groups defined in Fig. 1. Western blots were imaged and analyzed using a LI-COR Odyssey infrared imaging system (LI-COR Biosciences). The bar graph represents densitometry values calculated based on tubulin-loading controls that have been normalized to percent of control. Values are SE from each experimental group where n = 12. B: Western blot of IM base lysates and bar graph; n = 12/experimental group and n = 6/control group. *P < 0.05 vs. controls. §P < 0.05 vs. 14D.
Fig. 3.
Immunohistochemistry of UT-A1 after lithium feeding and recovery. Shown are ×40 magnification micrographs of IM sections of 3-mm kidney slices stained with primary antibody against UT-A1 and horseradish peroxidase (HRP)-linked secondary antibody (brown). Nuclei were counterstained with hematoxylin (blue). Insets are ×10 magnifications of the same slices showing overall distribution of the protein in the IM. All micrographs were matched for exposure. A: control. B: 7-day lithium fed. C: 14-day lithium fed. D: 7-day postlithium feeding. E: 14-day postlithium feeding.
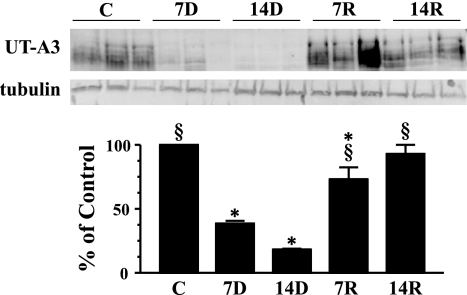
The other urea transporter found in the IM, UT-A3, predominately exists in the IM tip where it is localized to the basolateral membrane of the inner medullary collecting duct. Western blot analysis showed that UT-A3 expression in the IM tip was significantly reduced by 61% after 7 days and 82% after 14 days of lithium feeding (Fig. 4). Animals that were on standard chow for 7 days after lithium treatment showed a four-fold increase in UT-A3 expression and after 14 days, a complete recovery of transporter expression in the IM tip.
Fig. 4.
Western blot analysis of UT-A3 in IM tip. Provided are 3 representative samples of IM tip lysates. C, 7D, 14D, 7R, and 14R represent the same experimental groups defined in Fig. 1. The bar graph represents densitometry values calculated based on tubulin-loading controls that have been normalized to percent of control. Values are SE from each experimental group where n = 12. *P < 0.05 vs. controls. §P < 0.05 vs. 14D.
Changes in AQP after lithium treatment and recovery.
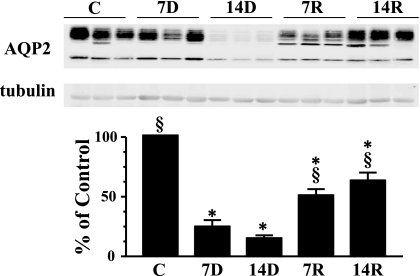
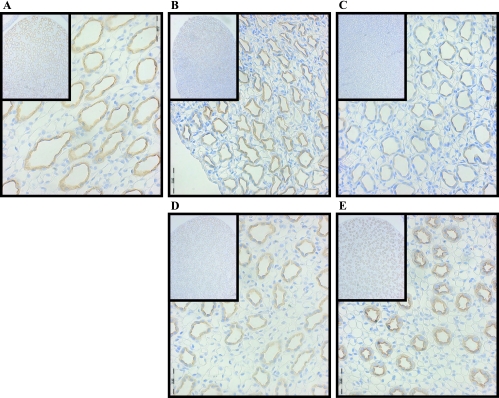
AQP2 in the IM has been reported to decrease in response to chronic lithium treatment in previous reports (8, 13, 14). This was confirmed in this study (Fig. 5). AQP2 has also been observed during a 4-wk recovery period during which it returned to control levels. In this study, AQP2 abundance in the IM tip was increased by 71% upon cessation of Li feeding after 7 days and 77% after 14 days. However, during the 2 wk studied, AQP2 abundance in the IM tip did not return to control levels (Fig. 5). AQP2 expression in IM base followed the same pattern as observed in the IM tip (data not shown). Like AQP2 in the IM tip, protein abundance of AQP2 in the IM base did not return to control levels after the 2-wk recovery from lithium feeding. This is also apparent in the immunohistochemical analysis of this protein (Fig. 6, A-E). There is a drastic decrease in the levels of AQP2 after 7 and 14 days of lithium feeding. AQP2 expression begins to increase after 7 days postlithium feeding and transporter levels continue to increase after a 14-day recovery period. The location of the protein within the IM cells is also of interest. Control cells show AQP2 both within the cells and at the apical surface. After 7 days of lithium treatment, in the cells that still express AQP2, the distribution appears to be the same. At 14 days of lithium exposure, AQP2 levels are virtually undetectable. After withdrawal of lithium, AQP2 reappears, but is oriented almost exclusively at the apical surface (Fig. 6, A-E).
Fig. 5.
Western blot analysis of aquaporin-2 (AQP2) in IM tip. Provided are 3 representative samples of IM tip lysates. C, 7D, 14D, 7R, and 14R represent the same experimental groups defined in Fig. 1. The bar graph represents densitometry values calculated based on tubulin-loading controls that have been normalized to percent of control. Values are SE from each experimental group where n = 12. *P < 0.05 vs. controls. §P < 0.05 vs. 14D.
Fig. 6.
Immunohistochemistry of AQP2 after lithium feeding and recovery. Shown are ×40 magnification micrographs of IM sections of 3-mm kidney slices stained with primary antibody against AQP2 and HRP-linked secondary antibody (brown). Nuclei were counterstained with hematoxylin (blue). Insets are ×10 magnifications of the same slices showing overall distribution of the protein in the IM. All micrographs were matched for exposure. A: control. B: 7D. C: 14D. D: 7-day postlithium feeding. E: 14-day postlithium feeding.
We also examined AQP1 expression in these animals. Similar to previous reports (15), chronic lithium treatment did not affect AQP1 expression in the IM after either 7 or 14 days. Additionally, recovery from lithium treatment also did not change the protein abundance of the water channel (data not shown). The lack of change in AQP1 expression after lithium treatment indicated that the reduction of UT-A1, UT-A3, and APQ2 observed in the IM was not due to toxicity.
Changes in NKCC2 after lithium treatment and recovery.
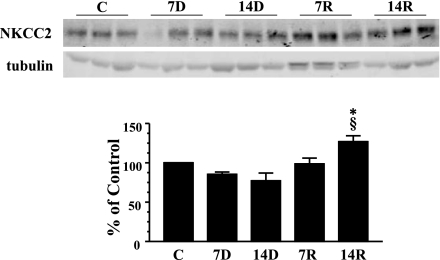
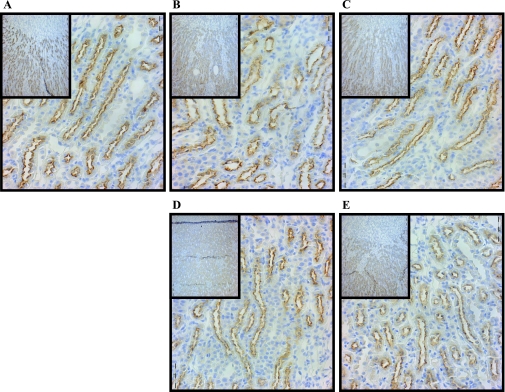
The Na-K-2Cl cotransporter, NKCC2, is found in the OM and cortex. Western blot analysis of the OM of rats fed lithium diet for 7 and 14 days suggested a slight decrease in the protein abundance of NKCC2 compared with control animals; however, this trend was not found to be statistically significant (Fig. 7). After the exchange of lithium food for standard chow, NKCC2 levels were unchanged after 7 days. Interestingly, at 14 days, NKCC2 levels were significantly increased by 13% over the control amount of the transporter (Fig. 7). There was no apparent change in the abundance of NKCC2 expression in all experimental groups examined by immunohistochemistry (Fig. 8). NKCC2 protein was observed intracellularly at the apical surface and this was unchanged at any of the time points observed (Fig. 8).
Fig. 7.
Western blot analysis of NKCC2 in outer medulla (OM). Provided are 3 representative samples of IM tip lysates. C, 7D, 14D, 7R, and 14R represent the same experimental groups defined in Fig. 1. The bar graph represents densitometry values calculated based on tubulin-loading controls that have been normalized to percent of control. Values are SE from each experimental group where n = 12. *P < 0.05 vs. controls. §P < 0.05 vs. 14D.
Fig. 8.
Immunohistochemistry of NKCC2 after lithium feeding and recovery. Shown are ×40 magnification micrographs of OM sections of 3-mm kidney slices stained with primary antibody against NKCC2 and HRP-linked secondary antibody (brown). Nuclei were counterstained with hematoxylin (blue). Insets are ×10 magnifications of the same slices showing overall distribution of the protein in the IM. All micrographs were matched for exposure. A: control. B: 7D. C: 14D. D: 7-day postlithium feeding. E: 14-day postlithium feeding.
DISCUSSION
This study examined the effects of chronic lithium treatment on the transporters involved in the urine concentration mechanism, as well as the recovery of UT-A1, UT-A3, AQP2, and NKCC2 2 wk after the discontinuation of lithium treatment. In this study, we established a relevant animal model for lithium treatment, confirmed previous studies examining the effects of lithium treatment, and provided new information concerning the urea transporter UT-A3 as well as insight into the reestablishment of urine concentration after recovery.
Initial physiologic measurements of rats on the lithium diet over time showed that within 7 days, the plasma levels of lithium were equivalent to that observed in patients. While continued treatment after 14 days did not show a significant increase from 7 days of treatment, some animals were above 1.3 meq/l; a level that is toxic for patients. Lithium-treated rats also produced high volumes of dilute urine, indicative of acquired NDI, within 7 days of treatment. The volume of excreted urine was further increased after 14 days of treatment. With the combined potential for shock due to extreme volume loss as well as approaching lithium toxicity, we decided that 14 days was a proper endpoint.
Animals were returned to standard diet after 14 days of lithium treatment and monitored for 14 days. Within 7 days postlithium treatment, plasma lithium levels returned to normal. Both urine volume and concentration showed progress toward returning to control levels after 7 days. After a 14-day recovery period, urine volume still remained high compared with control levels and urine osmolality appeared to remain low but was statistically not different from control urine concentration. This confirms previous reports where a longer recovery period was investigated (8). Additionally, the remaining polyuria in our animal model after the termination of lithium therapy parallels what is observed in the clinic.
We next investigated if one of the contributing osmoles, urea, was affected by the lithium treatment and recovery. Urine urea was dramatically reduced with 7 days of lithium treatment and remained low after 14 days of treatment. Following a 7-day recovery period, urine urea levels were increased. Despite a further increase in urine urea levels after 14-day postlithium treatment, levels did not return to control. This led to an interesting query considering that overall urine osmolality was reestablished after 14 days, suggesting that another contributing osmole besides urea must be increased in the recovery process.
Investigation of the urea transporter UT-A1 showed over a 50% decrease in protein abundance after 14 days of lithium treatment in both IM tip and base tissue, reconfirming our previously published results (2, 14). After 7 and 14 days of lithium treatment, immunohistochemistry of the IM showed a loss of UT-A1 abundance. Of the UT-A1 that was detected, expression appeared more apical after 7 days of treatment than control animals. The increased apical localization is likely due to the increased vasopressin levels that others reported in plasma (1). After 14 days of lithium treatment, animals that were removed from the drug and allowed to recover for 7 days showed an increase in UT-A1 abundance in both IM tip and base tissues. However, UT-A1 levels did not return to normal until 14 days after lithium therapy ceased. Immunohistochemistry showed that there was no difference in UT-A1 localization after recovery from lithium treatment.
UT-A3, which is expressed in the IM tip, also showed altered expression after lithium treatment. Like UT-A1, UT-A3 was dramatically decreased after rats were treated for 7 days with lithium. After 14 days of lithium treatment, protein abundance was further reduced. Animals that were allowed to recover for 7 days after lithium exposure had increased UT-A3 expression. UT-A3 protein abundance was completely restored after 14-day recovery postlithium diet. The effect of lithium on UT-A3 expression has not been examined before to our knowledge. While UT-A1 regulates urea movement from the lumen into the cell, UT-A3 is thought to control movement of urea from the cell into the interstium (4). The reduction of both transporters by lithium therapy indicates that transepithelial urea transport is completely compromised and the osmotic gradient required for urine concentration is destroyed.
Although both urea transporters return to basal levels 14 days after lithium treatment, urine urea levels are still significantly lower. This may be due to altered expression of proteins involved in urea transporter function and/or trafficking considering that proteomic analysis demonstrated that several proteins involved in various signaling cascades have altered expression after 14 days of lithium treatment (17).
AQP2 expression in the IM tip and base was significantly reduced within 7 days of lithium treatment. Further reduction in protein abundance was observed after 14 days of lithium treatment. Results were confirmed using immunohistochemistry. As observed by others, the AQP2 that is present after lithium treatment is largely localized to the apical region of the inner medullary collecting duct (8). AQP2 abundance did increase 7 days after lithium therapy but was still ∼50% of basal level expression. Immunohistochemistry performed after the 7-day recovery period showed that AQP2 was increased and was highly associated with the apical surface. Both of these findings are similar to the 7-day lithium recovery studies performed by Marples et al. (16). What is perhaps most interesting is that rats in the Marples et al. study were treated with lithium 35 days before the 7-day recovery period, whereas we saw almost identical findings in rats treated only 14 days before the 7-day recovery period. This suggests that despite the duration of lithium treatment, recovery of AQP2 expression after ceasing lithium intake is the same. It would be interesting to investigate whether the recovery rate of the urea transporters’ abundance was also independent of the duration of lithium treatment. Fourteen days after lithium treatment, AQP2 expression was slightly higher but still had not reached basal expression levels and most of the protein was found at the apical membrane in the inner medullary collecting duct. Another study found that AQP2 expression was restored after a 28-day recovery period post 28 days of lithium treatment (8). This slow recovery of AQP2 expression is reflective of the slow recovery of patients after lithium therapy.
NKCC2 expression in the OM remained constant after 7 and 14 days of lithium treatment. This is similar to previous studies (18) and confirmed in our immunohistochemical studies. There was no change in NKCC2 expression 7 days postlithium recovery; however, there was a slight but significant increase in NKCC2 expression in the 14-day recovery group. This increase in NKCC2 abundance may explain how urine osmolality reaches a basal level despite the lack of osmoles contributed by urea.
In summary, lithium-treated animals have a reduction in UT-A1, UT-A3, and AQP2 expression while NKCC2 expression remains unchanged. UT-A1 and UT-A3 return to normal levels 14 days after ceasing lithium therapy, whereas AQP2 levels remain 40% lower than basal expression. NKCC2 expression is increased after 14 days of recovery and likely contributes to returning urine osmolality to normal. There are some cases where plasma vasopressin levels remain high after cessation of lithium treatment (10). Chronic exposure to vasopressin has been shown to upregulate the expression of NKCC2 (12) which could explain the increased expression observed in our animals.
GRANTS
Funding for this work was provided by National Institutes of Health Grants R01-DK-62081, R01-DK-41707, P01-DK-61521, K01-DK-082733, and American Heart Association (AHA) Grant-in-Aid 0655280B and AHA postdoctoral Grant 0725545B.
DISCLOSURES
No conflicts of interest are declared by the authors.
ACKNOWLEDGMENTS
The authors thank C. Denson and T. von Bergen for additional technical support and preparation of this manuscript.
REFERENCES
- 1.Anai H, Ueta Y, Serino R, Nomura M, Kabashima N, Shibuya I, Takasugi M, Nakashima Y, Yamashita H. Upregulation of the expression of vasopressin gene in the paraventricular and supraoptic nuclei of the lithium-induced diabetes insipidus rat. Brain Res 772: 161–166, 1997 [DOI] [PubMed] [Google Scholar]
- 2.Bedford JJ, Leader JP, Jing R, Walker LJ, Klein JD, Sands JM, Walker RJ. Amiloride restores renal medullary osmolytes in lithium-induced nephrogenic diabetes insipidus. Am J Physiol Renal Physiol 294: F812–F820, 2008 [DOI] [PubMed] [Google Scholar]
- 3.Bichet DG. Nephrogenic diabetes insipidus. Am J Med 105: 431–442, 1998 [DOI] [PubMed] [Google Scholar]
- 4.Blount MA, Klein JD, Martin CF, Tchapyjnikov D, Sands JM. Forskolin stimulates phosphorylation and membrane accumulation of UT-A3. Am J Physiol Renal Physiol 293: F1308–F1313, 2007 [DOI] [PubMed] [Google Scholar]
- 5.Blount MA, Mistry AC, Frohlich O, Price SR, Chen G, Sands JM, Klein JD. Phosphorylation of UT-A1 urea transporter at serines 486 and 499 is important for vasopressin-regulated activity and membrane accumulation. Am J Physiol Renal Physiol 295: F295–F299, 2008 [DOI] [PMC free article] [PubMed] [Google Scholar]
- 6.Boton R, Gaviria M, Batlle DC. Prevalence, pathogenesis, and treatment of renal dysfunction associated with chronic lithium therapy. Am J Kidney Dis 10: 329–345, 1987 [DOI] [PubMed] [Google Scholar]
- 7.Bucht G, Wahlin A. Renal concentrating capacity in long-term lithium treatment and after withdrawal of lithium. Acta Med Scand 207: 309–314, 1980 [DOI] [PubMed] [Google Scholar]
- 8.Christensen BM, Marples D, Kim YH, Wang W, Frokiær J, Nielsen S. Changes in cellular composition of kidney collecting duct cells in rats with lithium-induced NDI. Am J Physiol Cell Physiol 286: C952–C964, 2004 [DOI] [PubMed] [Google Scholar]
- 9.Grunfeld JP, Rossier BC. Lithium nephrotoxicity revisited. Nat Rev Nephrol 5: 270–276, 2009 [DOI] [PubMed] [Google Scholar]
- 10.Guirguis AF, Taylor HC. Nephrogenic diabetes insipidus persisting 57 months after cessation of lithium carbonate therapy: report of a case and review of the literature. Endocr Pract 6: 324–328, 2000 [DOI] [PubMed] [Google Scholar]
- 11.Hoffert JD, Pisitkun T, Wang G, Shen RF, Knepper MA. Quantitative phosphoproteomics of vasopressin-sensitive renal cells: regulation of aquaporin-2 phosphorylation at two sites. Proc Natl Acad Sci USA 103: 7159–7164, 2006 [DOI] [PMC free article] [PubMed] [Google Scholar]
- 12.Kim GH, Ecelbarger CA, Mitchell C, Packer RK, Wade JB, Knepper MA. Vasopressin increases Na-K-2Cl cotransporter expression in thick ascending limb of Henle's loop. Am J Physiol Renal Physiol 276: F96–F103, 1999 [DOI] [PubMed] [Google Scholar]
- 13.Kim GH, Lee JW, Oh YK, Chang HR, Joo KW, Na KY, Earm JH, Knepper MA, Han JS. Antidiuretic effect of hydrochlorothiazide in lithium-induced nephrogenic diabetes insipidus is associated with upregulation of aquaporin-2, Na-Cl cotransporter, and epithelial sodium channel. J Am Soc Nephrol 15: 2836–2843, 2004 [DOI] [PubMed] [Google Scholar]
- 14.Klein JD, Gunn RB, Roberts BR, Sands JM. Downregulation of urea transporters in the renal inner medulla of lithium-fed rats. Kidney Int 61: 995–1002, 2002 [DOI] [PubMed] [Google Scholar]
- 15.Kwon TH, Laursen UH, Marples D, Maunsbach AB, Knepper MA, Frokiær J, Nielsen S. Altered expression of renal AQPs and Na+ transporters in rats with lithium-induced NDI. Am J Physiol Renal Physiol 279: F552–F564, 2000 [DOI] [PubMed] [Google Scholar]
- 16.Marples D, Christensen S, Christensen EI, Ottosen PD, Nielsen S. Lithium-induced downregulation of aquaporin-2 water channel expression in rat kidney medulla. J Clin Invest 95: 1838–1845, 1995 [DOI] [PMC free article] [PubMed] [Google Scholar]
- 17.Nielsen J, Hoffert JD, Knepper MA, Agre P, Nielsen S, Fenton RA. Proteomic analysis of lithium-induced nephrogenic diabetes insipidus: mechanisms for aquaporin 2 downregulation and cellular proliferation. Proc Natl Acad Sci USA 105: 3634–3639, 2008 [DOI] [PMC free article] [PubMed] [Google Scholar]
- 18.Nielsen J, Kwon TH, Praetorius J, Kim YH, Frokiær J, Knepper MA, Nielsen S. Segment-specific ENaC downregulation in kidney of rats with lithium-induced NDI. Am J Physiol Renal Physiol 285: F1198–F1209, 2003 [DOI] [PubMed] [Google Scholar]
- 19.Stone KA. Lithium-induced nephrogenic diabetes insipidus. J Am Board Fam Pract 12: 43–47, 1999 [DOI] [PubMed] [Google Scholar]
- 20.Thomsen K, Shirley DG. A hypothesis linking sodium and lithium reabsorption in the distal nephron. Nephrol Dial Transplant 21: 869–880, 2006 [DOI] [PubMed] [Google Scholar]


