Abstract
Recent studies suggest that the metabolic syndrome is associated with renal disease. We previously reported that a high-fructose diet, but not a high-glucose diet, can induce metabolic syndrome and accelerate chronic renal disease in rats. We now examined the effects of a high-fructose diet on normal rat kidneys. Three groups of Sprague-Dawley rats were pair fed a special diet containing 60% fructose, 60% glucose, or control standard rat chow for 6 wk, and then histological studies were performed. The effect of fructose to induce cell proliferation in cultured proximal tubular cells was also performed. Fructose diet, but not glucose diet, significantly increased kidney weight by 6 wk. The primary finding was tubular hyperplasia and proliferation involving all segments of the proximal tubules while glomerular changes were not observed. This is the same site where the fructose transporters (GLUT2 and -5) as well as the key enzyme in fructose metabolism (ketohexokinase) were expressed. Consistently, fructose also induced proliferation of rat proximal tubular cells in culture. In vivo, tubular proliferation was also associated with focal tubular injury, with type III collagen deposition in the interstitium, an increase in α-smooth muscle actin positive myofibroblasts, and an increase in macrophage infiltration. In conclusion, a high-fructose diet induces cell proliferation and hyperplasia in proximal tubules, perhaps via a direct metabolic effect. The effect is independent of total energy intake and is associated with focal tubulointerstitial injury. These studies may provide a mechanism by which metabolic syndrome causes renal disease.
Keywords: dextrose, glucose transporter-2, glucose transporter-5, ketohexokinase, fructokinase
the metabolic syndrome refers to a constellation of signs characterized by truncal obesity, dyslipidemia, mildly elevated blood pressure, and insulin resistance. Several studies have suggested that mild renal disease is associated with this syndrome (6). However, exactly how metabolic syndrome may cause renal disease remains unknown.
Our group has been interested in the role of excessive intake of fructose in the pathogenesis of metabolic syndrome and renal disease. The primary sources of fructose in the Western diet are from table sugar (sucrose) and high-fructose corn syrup (HFCS). Fructose is of interest, since it induces the metabolic syndrome in animals, and this is not observed with rats ingesting identical amounts of dextrose (22). Fructose ingestion is also associated with renal injury. Long-term (>6 mo) exposure has been associated with proteinuria, kidney enlargement, and focal tubulointerstitial injury and glomerulosclerosis (17, 37). We also reported that chronic ingestion of fructose can accelerate established renal disease (i.e., the remnant kidney model), resulting in worse renal function, greater proteinuria, and more glomerulosclerosis; again, this was not observed in rats fed equivalent calories using a dextrose-based diet (13).
If fructose causes renal disease, an important question could be the initiating process. Fructose undergoes a unique metabolism in which it is taken up by specific transporters and then phosphorylated by ketohexokinase (KHK). KHK is most heavily expressed in the intestinal epithelium, the liver, and the kidney where it is expressed only in the proximal tubule, but not other segments of the nephron (4, 15). In addition, when a high-fructose meal is ingested, fructose enters into the circulation and is also excreted into the urine, where it may undergo absorption by the proximal tubule similar to glucose (10, 19). Hence, one might posit that the proximal tubule might be a prime site to observe fructose-dependent effects.
To identify early effects of fructose on the kidney, we have examined the effect of 6 wk treatment with either fructose, dextrose, or control diet on renal morphology in the rat. In this study, all rats were pair fed to separate the effect of total energy intake from metabolic effects of dextrose or fructose.
MATERIALS AND METHODS
Animal study.
Male Sprague-Dawley rats (n = 36) weighing 150 g (Charles Rivers Laboratories, Wilmington, MA) were randomly assigned to receive a diet of 60% fructose, 60% dextrose, or standard rat chow (Harlan-Teklad, Madison, WI). At 4 wk, blood samples were obtained from the tail vain after 4 h of fasting. At 6 wk, all animals were killed under light anesthesia. Kidneys were weighed and immediately fixed in Methyl-Carnoy's solution. The animal protocol was approved by the Animal Care and Use Committee of the University of Florida.
Renal histology.
Kidneys were sectioned (2 μm thickness) and stained by periodic acid-Schiff (PAS) for histological analysis. For immunohistochemistry, heat-induced epitope retrieval was achieved in Target Retrieval Solution (pH 9.0; Dako) for vimentin and in antigen retrieval citrate solution (BioGenex, San Ramon, CA) for GLUT2. Primary antibodies for immunostaining included a mouse monoclonal anti-rat α-smooth muscle actin (α-SMA) antibody (Sigma, St. Louis, MO), a goat polyclonal anti-human collagen III antibody (Southern Biotech, Birmingham, AL), a mouse monoclonal anti-porcine vimentin antibody (Dako, Glostrup, Denmark), a mouse monoclonal anti-rat proliferating cell nuclear antigen (PCNA) antibody (PC 10; Cappel, Aurora, OH), the mouse monoclonal anti-rat ED-1 antibody 96 (Serotec, Indianapolis, IN) that detects macrophages, a rabbit polyclonal anti-rat GLUT5 antibody (Millipore, Billerica, MA), a rabbit polyclonal anti-human GLUT2 (NH2-terminal region) antibody (Abbiotec, San Diego, CA), and a rabbit polyclonal anti-human KHK antibody (Sigma). As a secondary antibody, a horseradish peroxidase (HRP) conjugated rabbit polyclonal anti-goat antibody (Dako, Carpinteria, CA) was used for collagen III, whereas anti-mouse EnVision+System-HRP-Polymer was used for vimentin, α-SMA, and ED-1. Mach2 goat anti-rabbit IgG-HRP-polymer (Biocare, Concord, CA) was used also for GLUT2, GLUT5, and KHK. Color was developed using 3,3-diaminobenzidine (Vector Laboratories, Burlingame, CA).
Biochemical data.
Serum chemistries were measured by autoanalyzer (VetAce machine; Alpha Wasserman, West Caldwell, NJ). Serum insulin level was measured using a rat insulin ELISA kit (Crystal Chem, Downers Grove, IL). Insulin tolerance was evaluated by calculating HOMA-R [fasting glucose (mg/dl) × fasting insulin (ng/dl)/405] (20).
Histological analysis.
All slides were examined by two different researchers in a blinded manner. More than 50 glomeruli and 200 tubules in each kidney section were examined. Glomerular tuft size and tubular injury (by counting the number of tubules that exhibited the dilation or the detachment of tubular epithelial cell) were evaluated using PAS-stained tissues as previously described (24). In addition, tubular size was determined by outlining each tubular profile (Areaout) using the Axio Vision image analyzer (Carl Zeiss, Thornwood, NY). Tubular lumen dimensions were measured by outlining the apical membrane (Areain). The tubular epithelial area was calculated by subtracting Areain from Areaout. The number of tubular epithelial cells/tubule was assessed by counting the number of nuclei in a proximal tubule cross section (μm2). In turn, the size of a tubular epithelial cell was determined by dividing the area of a tubule by the number of tubular nuclei. Distal tubules were distinguished from proximal tubules by the absence of brush border, and collecting ducts were determined by the presence of two different cell types: principal cells and intercalated cells. For immunostaining quantification, all slides are stained together in a single run for each staining. Negative controls for each staining include omitting primary antibody and substituting the primary antibody with preimmune rodent serum. PCNA and ED-1 positive cells/0.25 mm2 were counted at ×400 magnification. Although PCNA signals vary between cells, only the cells with a strong signal in the nucleus were counted. Vimentin expression was evaluated by counting the number of vimentin positive tubules divided by that of total tubules. Podocyte vimentin expression was used as an internal positive control. α-SMA and type III collagen were quantified as the percent area with positive signal using the Aperio Digital Pathology Systems (Aperio Technologies, Park Center Drive Vista, CA). α-SMA expression in vascular smooth muscle cells and collagen III deposition in interstitial area were used as positive controls. For GLUT5, GLUT2, and KHK expression, the strong signal in proximal tubular cells was used as a positive control. These signals were also quantified separately in both the cortex and outer stripe of the medullas as a percent positive area in which the threshold was determined using the Aperio Digital Pathology Systems (Aperio Technologies).
Cell culture.
Rat proximal tubular cells (NRK52E) were cultured in DMEM with l-glutamine and HEPES buffer (DMEM-F-12; Invitrogen, Carlsbad, CA) and were supplemented with 10% FBS, 100 U/ml penicillin, and 10 g/ml streptomycin (Invitrogen). Cells (1X10⁴) were grown in 96-well plates and cultured at 37°C in 95% air-5% CO2 for 48 h. After starvation, cells were stimulated with 1, 5, and 10 mM fructose for 24 h in glucose-free DMEM supplemented with 5 mM glucose and 10% dialyzed FBS. The proliferative effect of fructose on NRK52E cells was examined by total cellular DNA content per well by using the CyQuant cell proliferation 153 assay kit (Invitrogen), the WST-1 proliferation assay kit (Cayman Chemical, Ann Arbor, MI), and the bromodeoxyuridine (BrdU) cell proliferation kit (Roche, Indianapolis, IN). The WST test is based on the cleavage of the tetrazolium salt WST-1 {4-[3-(4-iodophenyl)-2-(4-nitrophenyl)-2H-5-tetrazolio]-1,3-benzene disulfonate} to formazan by various mitochondrial dehydrogenase enzymes (2). To assess cellular hypertrophy, the protein-to-DNA ratio was quantified on the same individual samples (34).
Statistical analysis.
Values were expressed as means ± SD. Differences between groups were tested by one-way ANOVA followed by the Tukey's test with a significance of p < 0.05. All statistical analyses were performed by using InStat Version 3.06 (GraphPad Software, San Diego, CA).
RESULTS
General characteristics.
As shown in Table 1, serum triglycerides and cholesterol were significantly elevated in the fructose group compared with the other two groups. Although serum glucose levels were identical, rats fed the fructose diet had significantly higher serum insulin concentrations. Compatibly, the HOMA-R index demonstrated that insulin sensitivity was significantly impaired by fructose. There was no statistically significant difference in serum creatinine levels between the three groups at 4 wk.
Table 1.
General characteristics
| Control | Glucose (60%) | Fructose (60%) | |
|---|---|---|---|
| Body wt, g | 358 ± 27 | 351 ± 33 | 354 ± 25 |
| Creatinine, mg/dl | 0.41 ± 0.04 | 0.43 ± 0.06 | 0.40 ± 0.04 |
| Uric acid, mg/dl | 1.7 ± 0.2 | 1.9 ± 0.2 | 1.8 ± 0.2 |
| Triglyceride, mg/dl | 161 ± 47 | 107 ± 33 | 373 ± 145*† |
| Cholesterol, mg/dl | 76 ± 12 | 64 ± 9‡ | 90 ± 16†‡ |
| Glucose, mg/dl | 152 ± 11 | 137 ± 14‡ | 159 ± 18† |
| Serum insulin, ng/ml | 3.0 ± 1.1 | 3.2 ± 1.2 | 4.8 ± 1.6*§ |
| HOMA-R index | 1.14 ± 0.45 | 1.08 ± 0.44 | 1.89 ± 0.79*† |
Data are means ± SD.
P < 0.01 and
P < 0.05 vs. control.
P < 0.01 and
P < 0.05 vs. glucose.
Kidney enlargement.
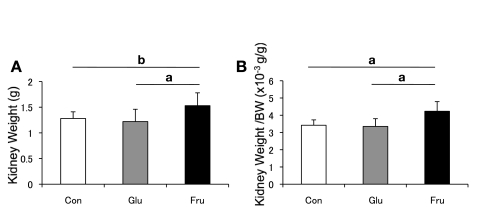
Although the glucose diet had no effect, the kidneys were markedly enlarged in fructose-fed rats at 6 wk (Fig. 1).
Fig. 1.
Kidney weight. A: left kidney weight of rats at 6 wk. B: kidney weight-to-body weight ratio at 6 wk. White square, control diet group; gray square, 60% glucose diet group; black square, 60% fructose diet group. Con, control; Glu, glucose; Fru, fructose. Data are shown as means ± SD. aP < 0.01; bP < 0.05.
Renal histology.
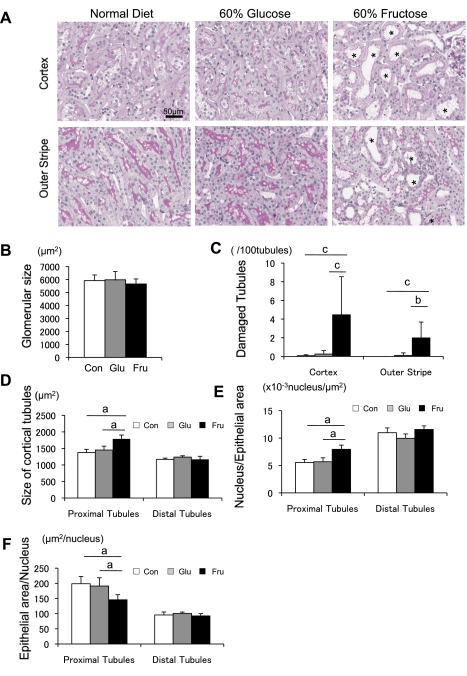
Although the glomerular tuft area was identical between the three groups (Fig. 2B), rats fed a high-fructose diet developed tubular injury, characterized by focal tubular dilatation and degeneration in the cortex and outer stripe of outer medulla. By image analysis, ∼4.46 ± 4.08% of cortical tubules and 1.98 ± 1.70% of tubules in the outer stripe were injured in fructose-fed rats, whereas glucose had no effect (Fig. 2, A and C).
Fig. 2.
Morphology of tubules in rat with normal, 60% glucose, and 60% fructose diet at 6 wk. A: periodic acid-Schiff (PAS) staining of renal cortex and outer stripe of outer medulla. Proximal tubular damage is significant in the cortex and outer stripe in fructose-fed rats. *Dilated tubules. Bar = 50 μm. B: glomerular tuft area. C: quantitative analysis of tubular injury in the renal cortex. D: size of proximal tubule and distal tubule in cortex. E: no. of nuclei/μm2 in the tubules. F: hypertrophy measurement as noted by the ratio of tubular epithelial cell/nucleus in proximal tubular cells. White square, control diet group; gray square, 60% glucose diet group; black square, 60% fructose diet group. Data are shown as means ± SD. aP < 0.01; bP < 0.05; cP < 0.001.
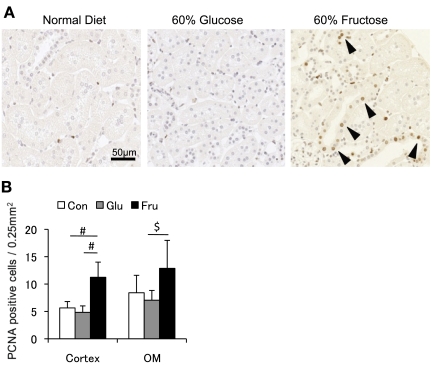
To better characterize the tubulointerstitial changes, morphological analysis was performed to assess tubular hypertrophy. Tubular size, measured by outlining the tubular epithelial cell, was significantly enlarged in fructose-fed rats compared with tubules from rats fed a normal or glucose diet (Fig. 2D). In addition, the number of nuclei per tubular cross section was significantly increased in fructose-fed rats (Fig. 2E), consistent with tubular epithelial cell hyperplasia. In turn, the tubular area/nucleus was smaller in the fructose group than in other groups, suggesting that fructose does not induce cellular hypertrophy of the proximal tubules (Fig. 2F). Consistent with this finding, actively proliferating cells, as identified by PCNA staining, were also increased in the renal cortex and outer stripe of outer medulla (Fig. 3). Many tubules were also dilated in fructose-fed rats, as shown in Fig. 2A.
Fig. 3.
Cell proliferation in the tubulointerstitium. A: immunohistochemistry for proliferating cell nuclear antigen (PCNA) in renal cortex. Positive cells are increased in rats with 60% fructose diet. Bar = 50 μm. B: quantitative analysis for PCNA positive cells in the renal cortex and outer medulla (OM). White square, control diet group; gray square, 60% glucose diet group; black square, 60% fructose diet group. Data are shown as means ± SD. #P < 0.01; $P < 0.05.
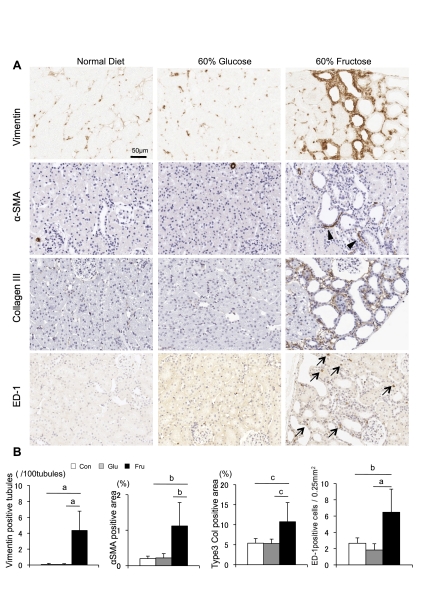
Tubulointerstitial injury was further examined by immunohistochemistry. As shown in Fig. 4, only fructose-fed rats showed significant increases in tubular vimentin expression (23) in association with increases in interstitial collagen III deposition, interstitial α-SMA expression (a marker of myofibroblasts), and macrophage (ED-1) infiltration.
Fig. 4.
Tubulointerstitial injury. A: immunohistochemistry for vimentin, α-smooth muscle actin (SMA), collagen III, and ED-1 in rats with normal diet, 60% glucose diet, and 60% fructose diet. Positive signal is shown by brown color. Arrowheads and arrows indicate α-SMA expression in the interstitium and an ED-1 positive macrophage, respectively. Bar = 50 μm. B: quantification of tubular vimentin expression (no. of vimentin positive tubules/100 tubules), interstitial α-SMA expression as a marker of myofibroblasts (%positive area in tubulointerstitium), interstitial collagen III deposition (%positive area in tubulointerstitium), and ED-1 positive macrophage infiltration (no. of positive cell/0.25 μm2 of tubulointerstitium). White square, control diet group; gray square, 60% glucose diet group; black square, 60% fructose diet group. Data are shown as means ± SD. aP < 0.001; bP < 0.01; cP < 0.05.
Fructose metabolism in proximal tubular cells.
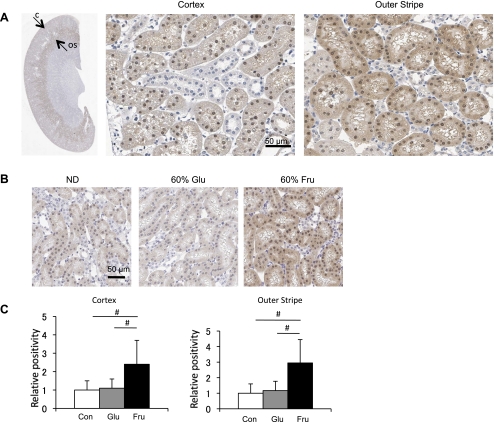
One of the 206 major sites of fructose metabolism is by the proximal tubules in the kidney (4, 15). Cirillo et al. (7) have previously reported that the metabolism of fructose by proximal tubular cells results in the production of inflammatory mediators. We therefore examined the expression of KHK (or fructokinase), the primary enzyme for fructose metabolism, in the kidney. In rats fed a normal diet, KHK was predominantly expressed in proximal tubular cells (S3 segment) of the outer stripe of the outer medulla, consistent with previous reports (4, 11). This enzyme was also lightly expressed in other segments of the proximal tubule (S1 and S2), but not in tubular cells within the inner stripe of the outer medulla and inner medulla (Fig. 5A). KHK expression was increased in rats that had been fed a high-fructose diet, whereas no changes were noted in rats on a high-glucose diet (Fig. 5, B and C). The increase in KHK expression in fructose-fed rats was within the same tubular segments that had constitutively expressed KHK.
Fig. 5.
Ketohexokinase (KHK) expression in the kidney. A: immunohistochemistry for KHK in the kidney. Low-power view demonstrates KHK is strongly expressed in the S3 proximal tubules of the outer stripe of the outer medulla (arrow labeled OS), with mild expression in proximal tubules of the renal cortex (arrow labeled C) in the normal rat kidney. A high-power view demonstrates KHK expression in tubular epithelial cell of proximal tubular cell in both cortex and outer stripe. B: KHK expression following normal diet (ND), 60% glucose diet (Glu), and 60% fructose diet (Fru) at 6 wk. C: KHK expression in renal cortex and outer stripe is quantified as the %positive area where positive signal is measured beyond a threshold. White square, control diet group; gray square, 60% glucose diet group; black square, 60% fructose diet group. Data are shown as means ± SD. Bar = 50 μm. #P < 0.001.
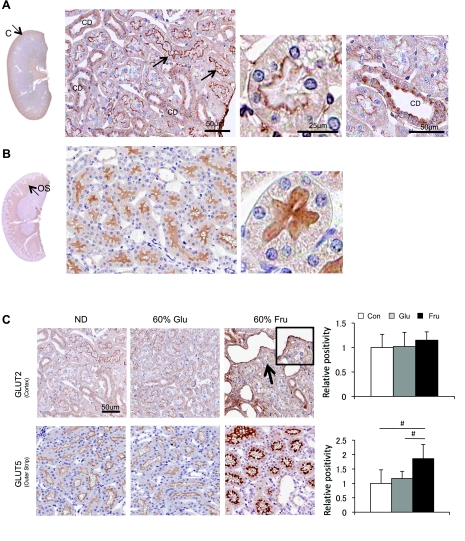
Next, we examined the expression of the two major fructose transporters (GLUT2 and GLUT5) in the kidney. GLUT2 was strongly expressed in the apical membrane of cortical proximal tubules (S1 and S2) and collecting duct, whereas such staining was virtually absent in the proximal tubules in the outer stripe (S3) (Fig. 6A). In contrast, GLUT5 was predominantly expressed in the brush border of the proximal tubules in the outer stripe (S3) while it was negative in the S1 and S2 segments of proximal tubular cells (Fig. 6B).
Fig. 6.
GLUT2 and GLUT5 expression in the kidney. A: immunohistochemistry for GLUT2 (brown color). A low-power view demonstrates that GLUT2 is mainly expressed in the renal cortex. By high-power view, GLUT2 (brown color) is localized to the brush border of cortical (S1 and S2) proximal (PT) tubules and collecting duct (CD) in the normal rat kidney. B: immunohistochemistry for GLUT5. A low-power view shows GLUT5 expression in the outer stripe (OS). A high-power view demonstrates that GLUT5 is located in the brush border of the S3 proximal tubular segment in the outer stripe of the normal rat kidney. Bar = 50 μm. C: the expression of GLUT2 and GLUT5 after 6 wk of normal diet, 60% glucose diet, or 60% fructose diet. Although GLUT2 expression does not appear altered, the 60% fructose diet is associated with increased GLUT5 expression in the S3 proximal tubular cells. Bar = 50 μm. White square, control diet group; gray square, 60% glucose diet group; black square, 60% fructose diet group. Data are means ± SD. #P < 0.001.
Interestingly, although the apical GLUT2 expression in cortical proximal tubules did not appear to be altered by diet, GLUT5 expression was significantly induced by fructose diet (Fig. 6C). The increased expression was observed in the same tubular segments that had constitutively expressed GLUT5.
Cell culture.
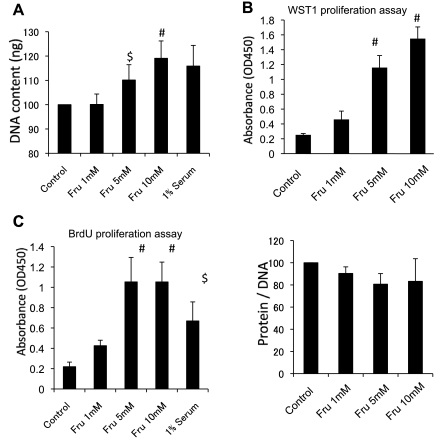
We examined if fructose can directly stimulate proliferation in proximal tubular epithelial cells in vitro. As shown in Fig. 7, fructose dose-dependently increased DNA content (a marker of cell number) at 24 h. Compatibly, an increase in cell number by WST-1 assay (Fig. 7B) and an elevated BrdU incorporation (Fig. 7C) in tubular cells exposed to fructose were consistent with cell proliferation. In contrast, the protein-to-DNA ratio, a marker of cellular hypertrophy, was not changed by fructose at 24 h.
Fig. 7.
In vitro cell proliferation assay. A: DNA content (ng/well) in NRK52E cells stimulated by varying concentrations of fructose at 24 h. B: WST-1 proliferation assay. The formazan formation in NRK25E cells was quantified at 450 nm 24 h after fructose administration. C: bromodeoxyuridine (BrdU) proliferation assay shows that fructose dose dependently stimulates cell proliferation of NRK52E cells. D: the cell protein-to-DNA ratio at 24 h after exposure to fructose in NRK52E cells. Data are shown as means ± SD. $P < 0.01 vs. control; #P < 0.05 vs. control.
DISCUSSION
In this study, we found that a high-fructose diet increased kidney weight and caused mild tubulointerstitial injury in the normal rat kidney. One potential mechanism could involve direct stimulation of proximal tubular cell proliferation by fructose. This possibility is supported by the observation that the proximal tubular epithelial cell expresses KHK, which is a primary enzyme for fructose, and that fructose transporters (GLUT5) are also located in the brush border. It is likely that GLUT2 is a main transporter of fructose in the S1 and S2 segments of the proximal tubule, whereas GLUT5 is expressed only in the S3 segment of the normal kidney. Finally, a direct effect of fructose on the proximal tubular cell was documented by the in vitro study in which fructose dose dependently stimulated cell proliferation, but not cellular hypertrophy, in a rat proximal tubule cell line (NRK52E).
The first major finding was the observation that a high-fructose diet could increase kidney weight in association with hyperplasia and proliferation. The histological studies suggested that the primary tubular cell populations involved were proximal tubular epithelial cells in the all segments. Proximal tubular cells were found to express monocyte chemoattractant protein-1 (MCP-1) (8). Likewise, an increase in renal MCP-1 expression was associated with an increase in inflammatory cells in rats with the remnant kidney that were fed a diet high in fructose (13). Interestingly, Burch et al. (4) found KHK expression and fructose metabolism in proximal tubular cells. Thus tubular cell proliferation and hyperplasia found in this study could be a consequence of fructose metabolism.
Fructose is absorbed in the small intestine by the transporters, GLUT5 and GLUT2 (3, 5, 9), and then transported via the portal vein to the liver where it is metabolized and causes ATP depletion (15). Most fructose is metabolized in the liver, especially when small amounts of fructose are ingested. However, in the setting that a large amount of fructose is taken, some fructose escapes from the liver, enters into the systemic circulation (12), and is filtered into urine in the kidney. As such, urinary fructose excretion has been found to be dose dependently increased by dietary fructose intake in humans (32) and rats (17). Given our evidence, urine fructose can be absorbed by fructose transporters located in the apical membrane in subjects ingesting a high intake of fructose. Thus this raises the possibility that this dietary factor could be contributing to early renal injury that has been documented in subjects with the metabolic syndrome.
In terms of the expression of GLUT5 and KHK, it was found that fructose (or sucrose, which contains fructose) upregulates KHK in the intestinal epithelium and hepatocytes (14, 18, 21, 36) and increases GLUT5 expression in intestinal epithelium (36). Similarly, patients with nonalcoholic fatty liver disease were found to ingest a higher amount of fructose and have increased KHK mRNA expression in their liver biopsies compared with controls (25). Thus our results suggest that GLUT5 and KHK can be upregulated by fructose in the kidney.
A well-known adverse effect of fructose is the development of dyslipidemia in humans (16, 31). We have also reported that the ingestion of 200 g of fructose for 2 wk can induce almost all features of metabolic syndrome in healthy overweight adult men, including hyperuricemia and hypertension, (26). Likewise, our model developed several metabolic abnormalities (Table 1). Thus it remains possible that some of the renal injury observed in our model could be indirect effects due to these risk factors. Proteinuria can also develop with prolonged treatment with fructose in rats (17, 27). However, in this 6-wk study, we did not note any glomerular abnormalities, suggesting that the earliest injury is limited primarily to the proximal tubular cell.
Although we quantified signals by immunohistochemistry, the reliability of this method has been disputed by several investigators (30, 33). Nevertheless, compared with visual estimates, computer-assisted image analysis provides superior accuracy and reproducibility of immunohistochemistry quantification. To provide the best reproducibility, staining for each marker was done with a single run to minimize daily variation, and a uniform method was used to establish thresholds for positive and negative staining.
GLUT2 expression was found in apical membrane in control rats, whereas previous studies documented its expression in basolateral membrane. It was documented that the antibody to the COOH-terminus detected the GLUT2 expression only in basolateral membrane (35) and suggested that the COOH-terminus could be masked in the apical membrane (1). In contrast, our antibody is an antagonist for NH2-terminus, which could explain the discordance of our result with previous reports.
In conclusion, chronic ingestion of fructose induces mild tubulointerstitial disease, and this might be because of a direct proliferative effect of fructose on the proximal tubular cell. This observation adds to our previous work showing that the proximal tubular cells also release inflammatory mediators such as MCP-1 in response to fructose (8). Additionally, chronic fructose ingestion induces renal microvascular disease that alters renal autoregulation and results in glomerular hypertension (28, 29). These combined effects could provide a mechanism for the relationship of metabolic syndrome with early renal disease. Further studies are needed to evaluate the role of fructose in renal disease.
GRANTS
This study was supported by National Heart, Lung, and Blood Institute Grant RO1 HL-68607-01 (R. J. Johnson).
DISCLOSURES
No conflicts of interest are declared by the authors.
REFERENCES
- 1.Affleck JA, Helliwell PA, Kellett GL. Immunocytochemical detection of GLUT2 at the rat intestinal brush-border membrane. J Histochem Cytochem 51: 1567–1574, 2003 [DOI] [PMC free article] [PubMed] [Google Scholar]
- 2.Berridge MV, Herst PM, Tan AS. Tetrazolium dyes as tools in cell biology: new insights into their cellular reduction. Biotechnol Annu Rev 11: 127–152, 2005 [DOI] [PubMed] [Google Scholar]
- 3.Burant CF, Takeda J, Brot-Laroche E, Bell GI, Davidson NO. Fructose transporter in human spermatozoa and small intestine is GLUT5. J Biol Chem 267: 14523–14526, 1992 [PubMed] [Google Scholar]
- 4.Burch HB, Choi S, Dence CN, Alvey TR, Cole BR, Lowry OH. Metabolic effects of large fructose loads in different parts of the rat nephron. J Biol Chem 255: 8239–8244, 1980 [PubMed] [Google Scholar]
- 5.Cheeseman CI. GLUT2 is the transporter for fructose across the rat intestinal basolateral membrane. Gastroenterology 105: 1050–1056, 1993 [DOI] [PubMed] [Google Scholar]
- 6.Chen J, Muntner P, Hamm LL, Jones DW, Batuman V, Fonseca V, Whelton PK, He J. The metabolic syndrome and chronic kidney disease in U.S. adults. Ann Intern Med 140: 167–174, 2004 [DOI] [PubMed] [Google Scholar]
- 7.Cirillo P, Gersch MS, Mu W, Scherer PM, Kim KM, Gesualdo L, Henderson GN, Johnson RJ, Sautin YY. Ketohexokinase-dependent metabolism of fructose induces proinflammatory mediators in proximal tubular cells. J Am Soc Nephrol 20: 545–553, 2009 [DOI] [PMC free article] [PubMed] [Google Scholar]
- 8.Cirillo P, Gersch MS, Mu W, Scherer PM, Kim KM, Gesualdo L, Henderson GN, Johnson RJ, Sautin YY. Ketohexokinase-dependent metabolism of fructose induces proinflammatory mediators in proximal tubular cells. J Am Soc Nephrol 20: 545–553, 2009 [DOI] [PMC free article] [PubMed] [Google Scholar]
- 9.Cook GC. Absorption products of D(-) fructose in man. Clin Sci 37: 675–687, 1969 [PubMed] [Google Scholar]
- 10.Debnam ES, Unwin RJ. Hyperglycemia and intestinal and renal glucose transport: implications for diabetic renal injury. Kidney Int 50: 1101–1109, 1996 [DOI] [PubMed] [Google Scholar]
- 11.Diggle CP, Shires M, Leitch D, Brooke D, Carr IM, Markham AF, Hayward BE, Asipu A, Bonthron DT. Ketohexokinase: expression and localization of the principal fructose-metabolizing enzyme. J Histochem Cytochem 57: 763–774, 2009 [DOI] [PMC free article] [PubMed] [Google Scholar]
- 12.Gaby AR. Adverse effects of dietary fructose. Altern Med Rev 10: 294–306, 2005 [PubMed] [Google Scholar]
- 13.Gersch MS, Mu W, Cirillo P, Reungjui S, Zhang L, Roncal C, Sautin YY, Johnson RJ, Nakagawa T. Fructose, but not dextrose, accelerates the progression of chronic kidney disease. Am J Physiol Renal Physiol 293: F1256–F1261, 2007 [DOI] [PubMed] [Google Scholar]
- 14.Grand RJ, Schay MI, Jaksina S. Development and control of intestinal and hepatic fructokinase. Pediatr Res 8: 765–770, 1974 [DOI] [PubMed] [Google Scholar]
- 15.Hallfrisch J. Metabolic effects of dietary fructose. Faseb J 4: 2652–2660, 1990 [DOI] [PubMed] [Google Scholar]
- 16.Havel PJ. Dietary fructose: implications for dysregulation of energy homeostasis and lipid/carbohydrate metabolism. Nutr Rev 63: 133–157, 2005 [DOI] [PubMed] [Google Scholar]
- 17.Kizhner T, Werman MJ. Long-term fructose intake: biochemical consequences and altered renal histology in the male rat. Metabolism 51: 1538–1547, 2002 [DOI] [PubMed] [Google Scholar]
- 18.Korieh A, Crouzoulon G. Dietary regulation of fructose metabolism in the intestine and in the liver of the rat. Duration of the effects of a high fructose diet after the return to the standard diet. Arch Int Physiol Biochim Biophys 99: 455–460, 1991 [PubMed] [Google Scholar]
- 19.Marks J, Carvou NJ, Debnam ES, Srai SK, Unwin RJ. Diabetes increases facilitative glucose uptake and GLUT2 expression at the rat proximal tubule brush border membrane. J Physiol 553: 137–145, 2003 [DOI] [PMC free article] [PubMed] [Google Scholar]
- 20.Matthews DR, Hosker JP, Rudenski AS, Naylor BA, Treacher DF, Turner RC. Homeostasis model assessment: insulin resistance and beta-cell function from fasting plasma glucose and insulin concentrations in man. Diabetologia 28: 412–419, 1985 [DOI] [PubMed] [Google Scholar]
- 21.Miyamoto K, Hase K, Takagi T, Fujii T, Taketani Y, Minami H, Oka T, Nakabou Y. Differential responses of intestinal glucose transporter mRNA transcripts to levels of dietary sugars. Biochem J 295: 211–215, 1993 [DOI] [PMC free article] [PubMed] [Google Scholar]
- 22.Nakagawa T, Hu H, Zharikov S, Tuttle KR, Short RA, Glushakova O, Ouyang X, Feig DI, Block ER, Herrera-Acosta J, Patel JM, Johnson RJ. A causal role for uric acid in fructose-induced metabolic syndrome. Am J Physiol Renal Physiol 290: F625–F631, 2006 [DOI] [PubMed] [Google Scholar]
- 23.Nakagawa T, Sasahara M, Haneda M, Kataoka H, Nakagawa H, Yagi M, Kikkawa R, Hazama F. Role of PDGF B-chain and PDGF receptors in rat tubular regeneration after acute injury. Am J Pathol 155: 1689–1699, 1999 [DOI] [PMC free article] [PubMed] [Google Scholar]
- 24.Nakayama T, Sato W, Kosugi T, Zhang L, Campbell-Thompson M, Yoshimura A, Croker BP, Johnson RJ, Nakagawa T. Endothelial injury due to eNOS deficiency accelerates the progression of chronic renal disease in the mouse. Am J Physiol Renal Physiol 296: F317–F327, 2009 [DOI] [PMC free article] [PubMed] [Google Scholar]
- 25.Ouyang X, Cirillo P, Sautin Y, McCall S, Bruchette JL, Diehl AM, Johnson RJ, Abdelmalek MF. Fructose consumption as a risk factor for non-alcoholic fatty liver disease. J Hepatol 48: 993–999, 2008 [DOI] [PMC free article] [PubMed] [Google Scholar]
- 26.Perez-Pozo SE, Schold J, Nakagawa T, Sánchez-Lozada LG, Johnson RJ, Lillo JL. Excessive fructose intake induces features of metabolic syndrome in healthy adult males: role of uric acid in the hypertensive response. Int J Obesity In press. [DOI] [PubMed] [Google Scholar]
- 27.Reungjui S, Roncal CA, Mu W, Srinivas TR, Sirivongs D, Johnson RJ, Nakagawa T. Thiazide diuretics exacerbate fructose-induced metabolic syndrome. J Am Soc Nephrol 18: 2724–2731, 2007 [DOI] [PubMed] [Google Scholar]
- 28.Sanchez-Lozada LG, Tapia E, Bautista-Garcia P, Soto V, Avila-Casado C, Vega-Campos IP, Nakagawa T, Zhao L, Franco M, Johnson RJ. Effects of febuxostat on metabolic and renal alterations in rats with fructose-induced metabolic syndrome. Am J Physiol Renal Physiol 294: F710–F718, 2008 [DOI] [PubMed] [Google Scholar]
- 29.Sanchez-Lozada LG, Tapia E, Jimenez A, Bautista P, Cristobal M, Nepomuceno T, Soto V, Avila-Casado C, Nakagawa T, Johnson RJ, Herrera-Acosta J, Franco M. Fructose-induced metabolic syndrome is associated with glomerular hypertension and renal microvascular damage in rats. Am J Physiol Renal Physiol 292: F423–F429, 2007 [DOI] [PubMed] [Google Scholar]
- 30.Seidal T, Balaton AJ, Battifora H. Interpretation and quantification of immunostains. Am J Surg Pathol 25: 1204–1207, 2001 [DOI] [PubMed] [Google Scholar]
- 31.Stanhope KL, Schwarz JM, Keim NL, Griffen SC, Bremer AA, Graham JL, Hatcher B, Cox CL, Dyachenko A, Zhang W, McGahan JP, Seibert A, Krauss RM, Chiu S, Schaefer EJ, Ai M, Otokozawa S, Nakajima K, Nakano T, Beysen C, Hellerstein MK, Berglund L, Havel PJ. Consuming fructose-sweetened, not glucose-sweetened, beverages increases visceral adiposity and lipids and decreases insulin sensitivity in overweight/obese humans. J Clin Invest 119: 1322–1334, 2009 [DOI] [PMC free article] [PubMed] [Google Scholar]
- 32.Tasevska N, Runswick SA, McTaggart A, Bingham SA. Urinary sucrose and fructose as biomarkers for sugar consumption. Cancer Epidemiol Biomarkers Prev 14: 1287–1294, 2005 [DOI] [PubMed] [Google Scholar]
- 33.Taylor CR. Standardization in immunohistochemistry: the role of antigen retrieval in molecular morphology. Biotech Histochem 81: 3–12, 2006 [DOI] [PubMed] [Google Scholar]
- 34.Terada Y, Inoshita S, Nakashima O, Tamamori M, Ito H, Kuwahara M, Sasaki S, Marumo F. Cell cycle inhibitors (p27Kip1 and p21CIP1) cause hypertrophy in LLC-PK1 cells. Kidney Int 56: 494–501, 1999 [DOI] [PubMed] [Google Scholar]
- 35.Thorens B, Cheng ZQ, Brown D, Lodish HF. Liver glucose transporter: a basolateral protein in hepatocytes and intestine and kidney cells. Am J Physiol Cell Physiol 259: C279–C285, 1990 [DOI] [PubMed] [Google Scholar]
- 36.Weiser MM, Quill H, Isselbacher KJ. Effects of diet on rat intestinal soluble hexokinase and fructokinase activities. Am J Physiol 221: 844–849, 1971 [DOI] [PubMed] [Google Scholar]
- 37.Zaoui P, Rossini E, Pinel N, Cordonnier D, Halimi S, Morel F. High fructose-fed rats: a model of glomerulosclerosis involving the renin-angiotensin system and renal gelatinases. Ann NY Acad Sci 878: 716–719, 1999 [DOI] [PubMed] [Google Scholar]


