Abstract
Kidney proton-secreting A-intercalated cells (A-IC) respond to systemic acidosis by accumulating the vacuolar ATPase (V-ATPase) in their apical membrane and by increasing the length and number of apical microvilli. We show here that the cell-permeant cAMP analog CPT-cAMP, infused in vivo, results in an almost twofold increase in apical V-ATPase accumulation in AE1-positive A-IC within 15 min and that these cells develop an extensive array of apical microvilli compared with controls. In contrast, no significant change in V-ATPase distribution could be detected by immunocytochemistry in B-intercalated cells at the acute time point examined. To show a direct effect of cAMP on A-IC, we prepared cell suspensions from the medulla of transgenic mice expressing EGFP in IC (driven by the B1-subunit promoter of the V-ATPase) and exposed them to cAMP analogs in vitro. Three-dimensional reconstructions of confocal images revealed that cAMP induced a time-dependent growth of apical microvilli, starting within minutes after addition. This effect was blocked by the PKA inhibitor myristoylated PKI. These morphological changes were paralleled by increased cAMP-mediated proton extrusion (pHi recovery) by A-IC in outer medullary collecting ducts measured using the ratiometric probe BCECF. These results, and our prior data showing that the bicarbonate-stimulated soluble adenylyl cyclase (sAC) is highly expressed in kidney intercalated cells, support the idea that cAMP generated either by sAC, or by activation of other signaling pathways, is part of the signal transduction mechanism involved in acid-base sensing and V-ATPase membrane trafficking in kidney intercalated cells.
Keywords: proton pump, H+-ATPase, immunocytochemistry, membrane trafficking, acid-base sensing, phosphorylation
proton secretion by the renal proximal tubule and collecting duct is induced by a variety of factors, including systemic acidemia and basolateral CO2 elevation. This increased acid secretion occurs at least in part by inducing the apical accumulation of the vacuolar proton pumping ATPase (V-ATPase) in A-type intercalated cells (A-IC) in both the cortical and medullary collecting ducts of the kidney. Simultaneously, bicarbonate-secreting B-type IC (B-IC) are “inactivated” by acidosis, a process that involves the endocytotic removal of basolateral plasma membrane V-ATPases that are characteristic of this cell type (6, 53). The sensing mechanism in IC that detects changes in acid-base status and regulates plasma membrane V-ATPase expression remains largely unknown.
Based on our work on proton-secreting cells in the epididymis, we proposed that luminal bicarbonate may play a central role in this process via its stimulatory effect on the soluble adenylyl cyclase (sAC), an atypical cyclase distinct from canonical transmembrane adenylyl cyclases, which generates intracellular cAMP in response to increased intracellular HCO3− concentration (42). We have previously shown that sAC is expressed in many segments of the kidney tubule, but its expression is especially elevated in IC, where it is colocalized in a protein complex with the V-ATPase. Furthermore, sAC and V-ATPase are concentrated together in the apical domain of IC of rats treated with the carbonic anhydrase inhibitor acetazolamide (45). This drug inhibits proximal tubule reabsorption of HCO3− and results in metabolic acidosis and distal delivery of increased luminal HCO3− concentrations. The A-IC respond to these events by dramatically increasing their apical surface area and increasing apical V-ATPase expression (4).
These findings relating sAC activity to proton secretion led us to examine the possible signaling pathway by which V-ATPase-rich apical microvilli develop in A-IC when proton secretion increases in response to acidosis or equivalent stimuli. Our hypothesis that the sAC-regulated cAMP signaling pathway is involved in this process requires as an essential step that cAMP itself can lead to the extension of microvilli and the apical enrichment of V-ATPase in these cells. Using in vivo infusion of cAMP, and direct cAMP analog treatment of medullary A-IC in vitro, we show here that both events indeed occur upon acute cAMP stimulation and that intracellular pH (pHi) recovery of acid-loaded A-IC is stimulated by cAMP, consistent with the hypothesis that cAMP is a central regulator of proton secretion by renal collecting duct A-IC.
MATERIALS AND METHODS
Antibodies.
An affinity-purified antibody against the V-ATPase A subunit was used to localize the V-ATPase in IC in single staining experiments. This rabbit polyclonal antibody was raised against a synthetic peptide corresponding to the C-terminal region of mouse ATP6V1A (the V-ATPase 70-kDa “A” subunit) as previously described (23). For double staining studies, an affinity-purified chicken antibody was raised against the same sequence as the previously described rabbit anti-ATP6V1B1 (the V-ATPase 56-kDa “B1” subunit isoform) antibody and was found to have the same specificity as this antibody (44). To positively identify cortical collecting duct A-IC, an anti-AE1 anion exchanger affinity-purified rabbit polyclonal antibody was used (3, 8), kindly provided by Dr. Seth Alper (Beth Israel Deaconess Medical Center, Boston, MA). An affinity-purified anti-pendrin rabbit polyclonal antibody (51) generously provided by Dr. Ines E. Royaux [National Human Genome Research Institute, National Institutes of Health (NIH), Bethesda, MD] was used to identify B-IC in the cortical collecting duct. A monoclonal calbindin antibody (mouse IgG1 isotype, Sigma-Aldrich, St. Louis, MO) was used as a connecting and distal tubule marker.
The following affinity-purified secondary antibodies were used: Alexa Fluor 594 goat anti-rabbit IgG (H+L, Invitrogen, Carlsbad, CA) at 2.5 μg/ml, FITC-conjugated donkey anti-rabbit IgG (H+L) at 1.75 μg/ml (Jackson ImmunoResearch Laboratories, West Grove, PA), and Cy3-conjugated donkey anti-chicken IgY (H+L) at 1.5 μg/ml (Jackson).
Tissue preparation and treatment of rats with cAMP.
Adult male Sprague-Dawley rats (Charles River Laboratories, Wilmington, MA) were housed under standard conditions and maintained on a standard rodent diet. All animal studies were approved by the Massachusetts General Hospital Subcommittee on Research Animal Care, in accordance with the NIH, Department of Agriculture, and Association for the Assessment and Accreditation of Laboratory Animal Care requirements.
Rats were anesthetized using pentobarbital sodium (Nembutal, 50 mg/kg body wt ip, Abbott Laboratories, Abbott Park, IL). The left and right femoral veins were exposed, and a 200-μl bolus injection of 20 mM 8-(4-chlorophenylthio)-cAMP (CPT-cAMP; Sigma-Aldrich) dissolved in PBS (0.9% NaCl in 10 mM phosphate buffer, pH 7.4) was injected intravenously into the right femoral vein. Immediately following the bolus injection, a steady infusion of 16 mM CPT-cAMP at 2.4 ml/h was made into the left femoral vein via a catheter. After 15 min, the infusion was stopped and the animal was perfused via the left cardiac ventricle with PBS followed by paraformaldehyde-lysine-periodate fixative (PLP) as previously described (44). Three control rats were injected and infused with PBS alone, and three rats were injected and infused with cAMP as described above. Following the perfusion with PLP, the kidneys were dissected, sliced, and further fixed by immersion in PLP for 4 h at room temperature and subsequently overnight at 4°C. Kidneys were then rinsed extensively in PBS and stored at 4°C in PBS containing 0.02% sodium azide. A further two rats were also treated with cAMP (same concentration as above) and theophylline (a cAMP phosphodiesterase inhibitor, as 200-μl bolus iv injection of 15 mM followed by infusion of 12 mM at 2.4 ml/h for 15 min) in an attempt to maximize the cAMP effect.
Immunofluorescence and confocal microscopy.
PLP-fixed kidney slices were cryoprotected in PBS containing 0.9 M sucrose, embedded in Tissue-Tek OCT compound 4583 (Sakura Finetek, Torrance, CA), frozen at −20°C, and 4 μm sections were cut on a Leica CM3050 S cryostat (Leica Microsystems, Bannockburn, IL). Sections were rehydrated in PBS and treated with 1% (wt/vol) SDS for 4 min for retrieval of antigenic sites, as previously described (15). After washing for 3 × 5 min in PBS, sections were incubated for 15 min in 1% (wt/vol) bovine serum albumin in PBS as a blocking step, and then incubated for 90 min with primary antibody diluted in Dako antibody diluent (Dako, Carpinteria, CA). After 3 × 5-min washes in PBS, the secondary antibody was applied for 1 h at room temperature and then washed off in PBS. For double immunostaining with V-ATPase and AE1 or pendrin, this protocol was repeated for the second primary antibody, followed by the appropriate secondary antibody. Slides were mounted in Vectashield medium (Vector Laboratories, Burlingame, CA) for microscopy and image acquisition. In addition to the usual specificity controls of omitting primary antibodies and incubating primary reagents with the immunizing peptides (except for the pendrin antibody, for which the peptide was not available), other control incubations were performed to confirm that the secondary anti-chicken IgG reagents did not cross-react with rabbit anti-V-ATPase primary antibodies and vice versa.
Digital images were acquired using a Nikon 80i epifluorescence microscope (Nikon Instruments, Melville, NY) equipped with an Orca 100 CCD camera (Hamamatsu, Bridgewater, NJ). Some sections were also examined using a confocal laser-scanning microscope (Zeiss Radiance 2000, Carl Zeiss Microimaging, Thornwood, NY). Epifluorescence images were acquired using IPLab version 3.2.4 image-processing software (Scanalytics, Fairfax, VA), and imported into Adobe Photoshop version CS2 image-editing software (Adobe Systems, San Jose, CA) for production of the final figures.
Quantification of apical fluorescence intensity.
Quantification of mean pixel intensity of apical B1 V-ATPase immunostaining was performed as previously described (46). Sections from three control and three cAMP-treated rats were immunostained at the same time and under identical conditions, and all digital images were acquired using the same exposure parameters. Basolateral AE1 staining was used to positively identify A-IC, and the segmentation function in IPLab was used to select the regions corresponding to the B1-associated fluorescence in the apical pole of the cells. The mean pixel intensity of every such area was measured, and the data were imported into Microsoft Excel version 10 (Microsoft, Redmond, WA) for statistical analysis. The calculation included an average of 41 cortical collecting duct (CCD) A-IC/control rat and 26 CCD A-IC/cAMP-treated rat from at least 10 different tubules for each animal. Summary data for this and following analyses were expressed for each group as means ± SE. All data were tested for significance using an unpaired Student's t-test, and only results with P values of <0.05 were considered as statistically significant.
Quantification of V-ATPase distribution in B-IC.
Images of sections from the cortex of control and CPT-cAMP-treated rat tissues were taken at ×40 magnification after double immunostaining with pendrin (FITC) and V-ATPase (Cy3) using a Nikon 80i epifluorescence microscope as described above. Connecting tubules and collecting ducts were distinguished by triple staining with a calbindin antibody, as described previously (44, 49). To ensure complete objectivity in this complex quantification, all images to be quantified were acquired at the microscope by one individual (M. Ljubojevic) who was unaware of the origin of the sections, and all counting of V-ATPase distribution was performed in a double blind manner by two different individuals (T. G. Paunescu and S. Breton). The data trends emerging from both sets of analysis were similar, and results were combined for the final statistical analysis by ANOVA.
Cells identified as B-IC based on pendrin expression were counted as previously described by our group and others (6, 53). Cells were divided into the following categories based on V-ATPase immunolocalization: tight basolateral staining (basolateral membrane domain strongly stained); loose basolateral staining (staining less compact in the basolateral membrane domain and often accompanied by cytosolic staining); diffuse (no membrane staining identified, and only cytosolic diffuse staining visible); diffuse and apical (some apical staining visible in addition to the cytosolic staining); and tight apical staining (narrow band of bright staining over most of the apical membrane region). This quantification included a total of 264 B-IC from n = 3 control rats and 245 B-IC from n = 3 cAMP-treated animals.
Immunogold electron microscopy.
Small pieces of PLP-fixed control and cAMP-infused rat kidneys were dehydrated through a graded series of ethanol to 100% ethanol and then infiltrated, embedded, and polymerized at 50°C in LR White resin (Electron Microscopy Sciences, Fort Washington, PA) as previously described (11, 52). Thin sections were incubated on drops of primary anti-V-ATPase (A-subunit) antibody diluted in Dako antibody diluent for 2 h at room temperature. After rinsing with PBS, the grids were incubated on drops of goat anti-rabbit IgG coupled to 15-nm gold particles (Ted Pella, Redding, CA) for 1 h at room temperature. Following several rinses with distilled water, the grids were poststained on drops of 2% uranyl acetate for 10 min, rinsed in distilled water, and dried. Sections were examined in a JEM-1011 transmission electron microscope (JEOL, Tokyo, Japan) at 80 kV, and images acquired using an AMT XR60 digital imaging system (Advanced Microscopy Techniques, Danvers, MA) were subsequently imported into Adobe Photoshop CS2. For the quantification of apical V-ATPases in electron micrographs of A-IC, gold particles located on the apical plasma membrane and microvilli and within 75 nm from the apical membrane (unless associated with discernible subapical vesicles) were counted manually for each cell. ImageJ version 1.42q software (National Institutes of Health, Bethesda, MD) was used to measure cell width (as a straight line between the two tight junctions) and apical membrane length (as freehand lines). Statistical analysis was performed as described above and as previously reported (42, 58). The calculation included 31 outer medullary collecting duct (OMCD) A-IC from 3 control rats and 29 OMCD A-IC from 3 cAMP-treated animals.
For the quantification of basolateral V-ATPases in electron micrographs of B-IC, thin sections were first incubated on drops of primary anti-AE1 antibody and goat anti-rabbit IgG coupled to 10-nm gold particles (Ted Pella) and then double stained with anti-V-ATPase (A-subunit) antibody and goat anti-rabbit IgG coupled to 15-nm gold particles as described above. B-IC were identified by the presence of 15-nm gold particles and the absence of 10-nm particles that labeled AE1 (which were readily detected in A-IC), and the number of particles located in the basolateral plasma membrane domain of each cell was counted manually. Results were expressed as particles per square micrometer of basolateral surface infoldings, and also as the number of gold particles per linear width of the cell at the level of the basolateral membrane. The surface area of the region of interest and the length of the measured region were measured using ImageJ version 1.42q software. The calculation included 23 CCD B-IC from 3 control rats and 25 CCD B-IC from 3 cAMP-treated animals.
Preparation of isolated cells from B1-EGFP transgenic mice.
We have previously described the generation of transgenic mice that express EGFP in IC, driven by the promoter of the V-ATPase B1-subunit, which is selectively amplified in these cells (34). Mice were anesthetized using isoflurane (Aerrane, Baxter, Deerfield, IL) in a Matrx gas chamber (1.5 units of O2 and 3 units of gas, Midmark, Orchard Park, NY). Kidneys were manually dissected under a binocular microscope, and the separated outer medullary tissue was immediately immersed in prewarmed RPMI medium (Gibco Invitrogen, Carlsbad, CA) containing 10 mM HEPES (pH 7.5), 1 mg/ml collagenase type I (Gibco Invitrogen), 1 mg/ml collagenase type II (Sigma-Aldrich), and 1 mg/ml hyaluronidase (Sigma-Aldrich). Tissue dissociation was performed for 35 min with a 10-s shaking period each 1 min at 37°C in a thermomixer (Eppendorf, Westbury, NY). Cell preparations were passed through a cell strainer with a 70-μm nylon mesh to remove undigested material, and the collected cells were then washed once with RPMI. Cells were subsequently incubated for 3 min in an ACK lysis buffer (Lonza, Walkersville, MD) to remove red blood cells, and then washed again with phosphate-buffered bathing solution. The resulting suspensions contained a mixture of isolated cells that were both EGFP positive (CD IC) and negative (all other cells).
cAMP treatment and confocal sectioning and image reconstruction of isolated IC.
Aliquots of isolated cells were placed into glass bottom dishes (WPI, Sarasota, FL) and were followed in real time, using spinning disc confocal microscopy (LCI Ultra View, PerkinElmer) in a chamber at 37°C and gassed with 95% O2-5% CO2. Some cells settled to the bottom of the dish and attached weakly, but sufficiently well to immobilize them for subsequent imaging. For some experiments, control cells were maintained in the absence of drugs, while other wells were treated with a final concentration of 1 mM CPT-cAMP with or without 10 μM myristoylated (m) PKI (added 10 min before cAMP addition), or 1 mM 8-bromo (Br)-cAMP. Images of cells were taken from control, cAMP-, and mPKI-treated wells before and after a 40-min incubation period. In other experiments, images of the cells were taken at regular intervals during cAMP treatment. At each time point, stacks of images were taken at 0.3-μm intervals along the z-axis, and three-dimensional (3D) images were reconstructed using Volocity software (Improvision, Waltham, MA) and imported as 3D projections into Adobe Photoshop for production of the final composite figure.
Isolation of OMCD.
OMCD were prepared from mouse kidney essentially as described previously (65, 68). Briefly, mice were anesthetized and perfused through the left ventricle with a phosphate/sucrose buffer (140 mM sucrose/140 mM NaH2PO4, pH 7.4) with 6 mg/ml trypsin inhibitor type II-S and 250 μg/ml collagenase (Sigma). Kidneys were harvested, transferred to a dissection microscope, coronal slices 1–2 mm in thickness were prepared, and the outer medulla was dissected. Outer medulla pieces were transferred to a digestion buffer and incubated at 37°C for 30 min, washed several times with ice-cold HEPES buffer, and stored on ice until further use. OMCD were identified under the dissection microscope, transferred on coverslips precoated with Cell-Tak (BD Biosciences, Franklin Lakes, NJ), and allowed to adhere.
pHi measurements.
Coverslips with isolated OMCD were transferred to a thermostatically controlled perfusion chamber (∼ 3 ml/min flow rate) maintained at 37°C on an inverted microscope (Zeiss Axiovert 200) equipped with a video imaging system (Visitron, Munich, Germany) for the duration of the experiment. The isolated OMCD were incubated in a HEPES-buffered Ringer solution containing the pH-sensitive dye BCECF-AM (10 μM, Molecular Probes) for 15 min and then washed to remove all nondeesterified dye.
pHi was measured microfluorometrically by alternately exciting the dye with a 10-μm-diameter spot of light at 495 and 440 nm while the emission at 532 nm was monitored with a video imaging system. Each experiment was calibrated for pHi using the nigericin/high K+ method, and the obtained ratios were converted to pHi as described (59, 65, 68). All experiments were performed in the nominal absence of bicarbonate. The initial solution was a HEPES-buffered Ringer solution (125 mM NaCl, 3 mM KCl, 1 mM CaCl2, 1.2 mM MgSO4, 2 mM KH2PO4, 32.2 mM HEPES, pH 7.4). Cells were acidified by using the NH4Cl (20 mM) prepulse technique and washed into a Na+-free solution (Na+ was replaced by equimolar concentrations of N-methyl-d-glucamine). pHi alkalinization rates were determined in the absence of Na+. Rates were calculated over the same range of pHi (6.55–6.75) for all cells studied. All chemicals were of highest purity and were purchased from Sigma and Calbiochem (VWR International, Dietikon, Switzerland). Chemicals were added to the solutions from stock solutions at the given concentrations for each experimental protocol.
RESULTS
Effect of cAMP infusion on V-ATPase distribution in A-IC in vivo.
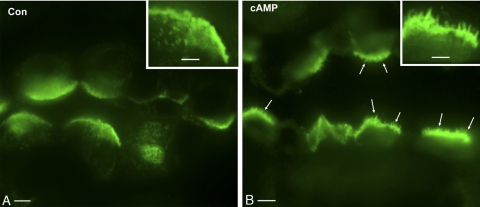
Collecting duct A-IC of rats treated with CPT-cAMP showed a marked increase in apical V-ATPase in most kidney regions, which was apparent in the cortex and outer stripe of the outer medulla. Not only was the apical staining brighter, but many cells, especially in the OMCD, also had extensive microvilli that were clearly detectable even by conventional wide-field fluorescence microscopy (Fig. 1). Confocal microscopy was also used to compare and contrast these observations to the V-ATPase immunostaining pattern in control rats. As previously described, CD IC in control tissues were strongly positive for V-ATPase, and adjacent principal cells were negative (12, 14, 16, 40, 44). IC showed the usual diverse pattern of V-ATPase staining, ranging from a tight apical band in some A-IC to basolateral staining in some B-IC. Most frequently, CCD and OMCD A-IC exhibited apical and diffuse subapical V-ATPase staining, as the highest levels of V-ATPase expression are found in the region located between the apical membrane and the nucleus (Fig. 2A). V-ATPase localization following cAMP treatment was significantly more polarized. While the apical V-ATPase staining was brighter, the subapical region between the nucleus and the apical surface appeared darker after exposure to cAMP, consistent with V-ATPase translocation from the subapical domain to the plasma membrane (Fig. 2B). The expression pattern and subcellular localization of the V-ATPase B1 subunit (not shown) were found to closely resemble those of the A subunit.
Fig. 1.
Immunofluorescence labeling for the A subunit of the V-ATPase in control (Con; A) and 8-(4-chlorophenylthio)-cAMP (CPT-cAMP)-treated (cAMP; B) rat outer medullary collecting duct (OMCD) intercalated cells (IC) imaged by conventional widefield microscopy on 5-μm kidney cryosections. The apical membranes of all A-IC exhibit bright V-ATPase staining (green), but in the cAMP-treated rat (B), extensively stained microvilli are readily detectable (arrows; see also inset). In contrast, the apical membranes of IC from the control rat (A) have a much smoother appearance. Bar = 5 μm. Inset bar = 2.5 μm.
Fig. 2.
Confocal microscopy showing A-subunit V-ATPase immunostaining in the OMCD of control and cAMP-treated rat kidney. In IC from control animals (A), the V-ATPase (green) localizes throughout the region between the apical membrane and the cell nucleus identified by 4,6-diamidino-2-phenylindole staining (blue), and few apical microvilli are seen. Following CPT-cAMP treatment, the apical membrane staining is brighter and exhibits clearly visible microvilli, whereas the subapical staining above the nucleus appears depleted (B). Bars = 5 μm.
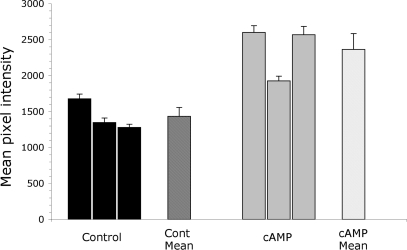
Quantification of the staining pattern in CCD A-IC positively identified by double staining with an AE1 antibody revealed a significant increase in apical V-ATPase staining in cAMP-treated rats (Fig. 3). Mean pixel intensity (MPI) increased significantly by almost 65% in the cAMP-treated group (n = 3 animals for both groups, P = 0.01). Unpaired t-test analyses comparing sets of MPI data from control vs. treated animal pairs showed in all cases that the differences were also statistically significant (with P values varying from <0.0001 to 0.0175).
Fig. 3.
Mean pixel intensity of apical B1 V-ATPase-associated immunofluorescence in 3 control (black bars) and 3 cAMP-treated rats (gray bars) is shown as means ± SE. The dark gray bar represents the average of the control group, 1,433 ± 123 (n = 3). The average mean pixel intensity (MPI) of all 124 cells quantified from the 3 control animals was 1,477. The light gray bar represents the average of the cAMP-treated group, 2,364 ± 219 (n = 3), representing a 65% increase over controls. The corresponding average MPI of all 77 A-ICs quantified from cAMP-treated rats was 2,415.
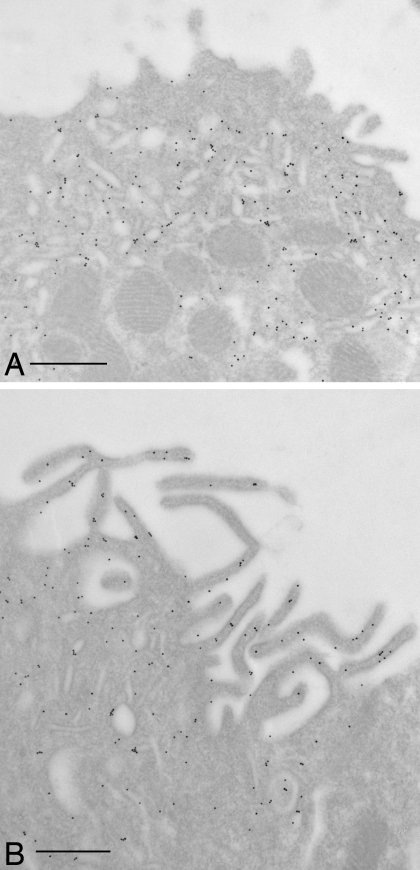
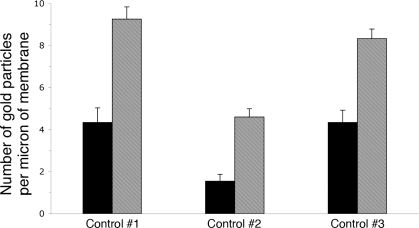
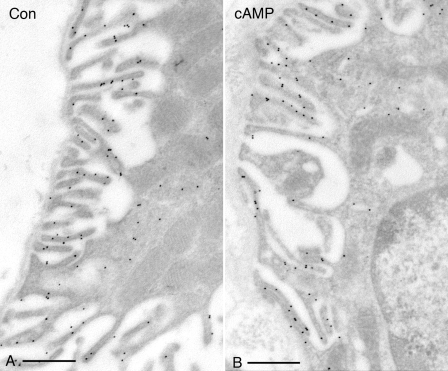
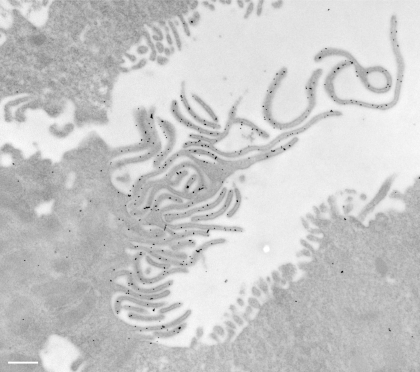
To confirm the increased apical staining pattern seen by fluorescence microscopy, immunogold staining was performed on ultrathin sections for electron microscopy. As seen in Fig. 4, many A-IC from the outer medulla of cAMP-exposed rats had a marked increase in the complexity of their apical microvilli compared with cells from control animals, and these microvilli showed extensive immunogold labeling. Gold particle quantification revealed an almost twofold increase in the number of apical particles per IC in cAMP-treated rats, which was statistically significant (Fig. 5A). To quantify the development of apical microvilli in cells from the cAMP-treated rats compared with controls, we measured the apical membrane length and normalized it to the cell width to account for the cell-to-cell variation. This parameter increased significantly by ∼60% after cAMP treatment (Fig. 5B). The cell width did not change significantly upon cAMP treatment (P > 0.05), indicating that the measured increase in the total apical membrane length was in fact due to the increased number and length of the apical microvilli in treated tissues. However, this membrane amplification accounted only in part for the increase in the apical V-ATPase density measured as the number of gold particles. When normalized to the apical membrane length, the gold particle density also increased significantly by >50% after cAMP treatment (Fig. 5C). We also quantified the gold particle labeling over the apical membrane of control A-IC and compared it to the density of labeling over the extensive apical vesicles that characterize these cells. The labeling intensity in gold particles per micrometer length of the vesicle membrane was more than double that of the apical membrane under nonstimulated conditions (Fig. 6).
Fig. 4.
Immunogold electron microscopy on LR White resin-embedded rat kidney showing distribution of the V-ATPase A subunit in the apical domain of A-type IC from OMCD. The A-subunit of the V-ATPase is labeled with 10-nm gold particles. The V-ATPase is mainly associated with the subapical cytoplasm and vesicles in control animals (A) and is expressed at high levels on the extensive apical membrane microvilli that develop in cAMP-treated rats (B). Bars = 0.5 μm.
Fig. 5.
Quantification of gold particle density and apical membrane length in LR White resin-embedded control and cAMP-treated rat collecting duct A-type IC. The cAMP treatment induces a 2-fold increase in the number of gold particles located to the apical membrane and microvilli, from 70 ± 12 to 130 ± 18 (means ± SE; A). The apical membrane length normalized to the cell width increases after cAMP treatment from 3.8 ± 0.3 to 6.0 ± 0.7 (B). Gold particle density per unit length of membrane also increased from 3.1 ± 0.4 to 4.7 ± 0.2 particles/μm (C). All increases are statistically significant, as indicated by the respective P values. The quantification includes n = 31 OMCD A-IC from 3 control rats and n = 29 cells from 3 cAMP-treated animals.
Fig. 6.
Comparison of gold particle labeling intensity (particles per μm length of membrane) of the apical plasma membrane (solid bars) vs. the membranes of subapical vesicles (hatched bars) in A-IC from outer medullary collecting ducts of control, nonstimulated rat kidneys. The labeling intensity of the vesicles was significantly greater (P < 0.002 for each tissue) than that of the apical surface under nonstimulated conditions in all tissues examined. The quantification compared the labeling intensity of a total of 121 vesicles from 14 different OMCD IC from 3 animals with the control values for membrane labeling that are also presented in Fig. 5.
cAMP does not acutely affect V-ATPase distribution in B-IC in vivo.
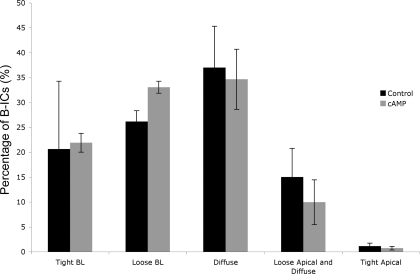
In the CCD, bicarbonate-secreting B-IC coexist alongside A-IC. After exposure to cAMP, B-IC (identified by apical pendrin staining) showed a large diversity in their V-ATPase staining patterns. These B-IC showed no obvious well-defined growth of apical microvilli after cAMP, and many still retained a distinct basolateral V-ATPase distribution. A two-way ANOVA analysis showed no significant shift in V-ATPase staining between the categories: tight basolateral, loose basolateral, diffuse, diffuse and apical, and tight apical, in B-IC after 15-min cAMP treatment (Fig. 7), the same time point at which a remarkable growth in apical microvilli was detectable in A-IC. Furthermore, by immunogold electron microscopy, no detectable change in basolateral membrane staining for V-ATPase was induced by cAMP treatment at the acute time point examined in this study (Fig. 8). Quantification of the basolateral immunogold labeling in B-IC (identified by the absence of basolateral AE1 staining) confirmed that no significant change in V-ATPase abundance occurred either when expressed as particles per unit area occupied by the basolateral membrane infoldings [22.6 ± 2.9 particles/μm2 in controls; 27.0 ± 2.1 particles/μm2 in cAMP-treated tissues; means ± SE, not significant (NS)], or as particles per unit width (μm) of the basolateral pole of the cell (19.5 ± 1.6 in controls vs. 23.8 ± 2.1 in cAMP-treated tissues, means ± SE, NS).
Fig. 7.
Quantification of the percentage of B-IC showing various patterns of V-ATPase staining before and after cAMP treatment in vivo. The staining categories were based on those previously used to define V-ATPase localization in IC (6, 53). BL, basolateral. No visually detectable or statistically significant change in the numbers of B-IC with the different staining patterns was detectable in any of the cAMP-treated animals compared with controls. (P = 0.88 by 2-way ANOVA).
Fig. 8.
Immunogold labeling of the V-ATPase A subunit in the basolateral region of B-IC from cortical collecting ducts of control (A) and cAMP-treated (B) LR White resin-embedded rat kidneys. The basolateral labeling intensity was not significantly different in control tissues compared with those exposed to cAMP. Quantitative data supporting this observation are provided in results. Bar = 0.5 μm.
Effect of cAMP on isolated A-IC in vitro.
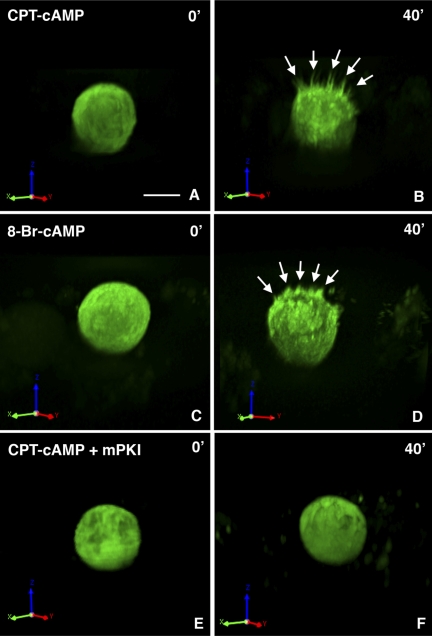
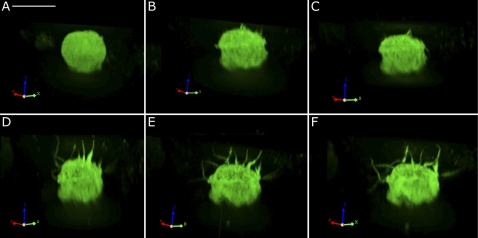
To determine whether the stimulatory effect of cAMP infusion on V-ATPase membrane insertion and microvillar growth in the intact animal was a direct effect on A-IC, or could have resulted from an indirect secondary effect of cAMP, we exposed A-IC in vitro to the permeant cAMP analogs CPT-cAMP and 8-Br-cAMP. For this purpose, we used only cells from the medulla to avoid possible confounding effects that would result from having a mixture of A-IC and B-IC (which did not grow microvilli in vivo at the time points we examined) in the suspensions. As shown in Fig. 9, these isolated cells, identified by their high expression of EGFP, showed morphological changes in response to both CPT-cAMP (Fig. 9, A and B) and 8-Br-cAMP (Fig. 9, C and D) that were reminiscent of those seen in vivo. Most of the EGFP-positive cells developed distinct apical microvilli-like projections after treatment, and in a few cells they eventually became almost as long as the rest of the cell body. One such cell shown in Fig. 10 had no microvilli initially, but long, slender structures emerged from the cell in a time-dependent manner after exposure to CPT-cAMP. In addition, these isolated IC seem to retain at least partial cell polarity in vitro, since all of the microvilli emanate from what appears to be the apical pole of the cell, and few if any from the opposite (basolateral) surface. A 3D rotation of the cell in Fig. 10 before and during cAMP stimulation is shown in the supplemental movie files (Supp. Figs. 1–3; all supplementary material for this article is available on the journal web site). This effect on microvillar growth was completely inhibited by treatment of cells with the PKA inhibitor mPKI before and during CPT-cAMP exposure (Fig. 9, E and F).
Fig. 9.
Spinning disk confocal microscopy showing representative examples of microvillar development induced by CPT-cAMP (A and B) and 8-bromo (Br)-cAMP (C and D) treatment of IC that were isolated from the medulla of transgenic mice that express EGFP driven by the promoter of the V-ATPase B1 subunit. A and C show the cells before cAMP analog addition, and B and D show the same cells after 40-min exposure to the respective cAMP analog with new apical microvilli now clearly visible (arrows). E and F show a cell that was first exposed to the PKA inhibitor myristoylated (m) PKI and then for 40 min to CPT-cAMP in the continued presence of mPKI. No microvillar growth was detectable in the presence of mPKI. Bar = 5 μm
Fig. 10.
Spinning disc confocal microscopy showing an example of a dramatic morphological change induced by CPT-cAMP treatment that was seen in some of the IC isolated from transgenic mice expressing EGFP driven by the promoter of the V-ATPase B1 subunit. This cell initially had no visible microvilli (A) but progressively developed an array of extensive microvilli-like projections at the “apical” pole after 12 (B), 24 (C), 36 (D), 48 (E), and 60 min (F) of exposure to 1 mM CPT-cAMP. Bar = 10 μm.
While most cells examined in vivo did not exhibit such an extreme elongation of microvilli as some of the cells in vitro, we did find occasional cells in which the apical pole elaborated very long structures. The example of very extensive, V-ATPase-rich apical microvillar formation shown in Fig. 11 is from an animal that was infused for 15 min with both cAMP and theophylline, a phosphodiesterase inhibitor, in an attempt to maximize the intracellular concentration of cAMP.
Fig. 11.
Immunogold electron microscopy (LR White resin-embedded rat kidney) showing an extreme example of extensive growth of V-ATPase (A subunit)-containing apical microvilli at the apical domain of an OMCD A-IC from a rat infused for 15 min with both cAMP and theophylline. Bar = 0.5 μm.
cAMP stimulates proton secretion in vitro.
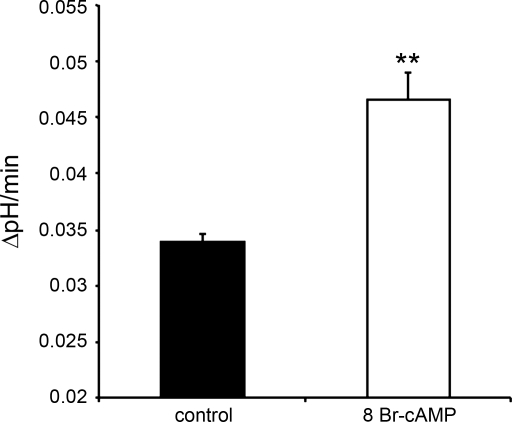
To test whether the morphological changes induced by cAMP were paralleled by changes in V-ATPase activity, we used isolated mouse OMCD and measured pHi recovery rates in single IC after an ammonium chloride prepulse. We have shown previously that pHi recovery under the experimental conditions used here reflects mostly V-ATPase activity (65). The rate of pHi recovery was 0.034 ± 0.003 pH units/min (n = 44 cells, 5 OMCD, 5 mice) in untreated OMCD and increased significantly to 0.047 ± 0.002 pH units/min (n = 110 cells, 7 OMCD, 3 mice) (**P = 0.0036) (Fig. 12) after 15-min incubation with 300 μM 8-Br-cAMP, a 40% increase that correlates well with our immunocytochemical and morphological data.
Fig. 12.
V-ATPase activity measured as intracellular pH (pHi) recovery rate in OMCD A-IC from control and cAMP-treated mice, shown here as means ± SE. The rate of pHi recovery increased significantly (**P = 0.0036) after 15-min exposure to 300 μM 8-Br-cAMP (n = 110 cAMP-treated cells from 3 mice).
DISCUSSION
Acidification events are critical to normal cell and organ function, and defects lead to several pathological conditions in humans (2). Therefore, it is important to understand how “professional” proton-secreting cells such as IC in the kidney respond to various environmental and cellular cues. Recycling of the V-ATPase between intracellular vesicles and the plasma membrane is a characteristic of cells that are involved in proton secretion in different tissues and organs, and it is central to acid-base regulation by the kidney (9, 55, 64, 67). Higher rates of H+ secretion correlate with increased levels of plasma membrane V-ATPase expression and increased apical microvillar extension, and regulation of this process is under tight physiological control (1, 5, 12, 31, 64). This distinguishes “professional” proton-secreting cells from other cell types in which the V-ATPase is an intracellular enzyme that maintains a low pH in various organelles (33). However, the specific mechanisms that govern V-ATPase recycling in the kidney and other organs are, for the most part, understood only at the most generic level.
A key unresolved issue specific to renal physiology is how extracellular acid-base status is sensed by renal epithelial cells to initiate their homeostatic response to these stimuli. The factors that have been suggested include, not surprisingly, pH, CO2, and bicarbonate as well as a number of potential hormonal stimuli (64). Indeed, early elegant studies by Schwartz, van Adelsberg and Al-Awqati (54, 61) showed that basolateral CO2 elevation, together with an initial increase in calcium, stimulates proton secretion by proximal tubules and collecting duct IC. This happens at least in part by inducing the apical insertion of V-ATPase in these cells. Some candidate proteins including the Pyk2 tyrosine kinase in the proximal tubule have been implicated in pHi sensing (28), and a family of G protein-coupled receptors can generate cAMP or inositol 1,4,5-trisphosphate/calcium signals in response to acidic extracellular pH in some cell types including osteoblasts (30). Critically, our previous work on proton-secreting cells in the epididymis has revealed that apical V-ATPase accumulation is stimulated by luminal bicarbonate via a soluble adenylate cyclase (sAC)-mediated increase in intracellular cAMP (42).
Work from the group of Levin and Buck (18, 25, 29, 69) showed that sAC is activated directly by bicarbonate ions, and that calcium can further modify its activity. In addition to monitoring acid-base status by responding to intracellular bicarbonate concentration, sAC could also act as a CO2 sensor, because an elevation of intracellular CO2 levels would increase the intracellular bicarbonate concentration via the action of cytosolic carbonic anhydrases (70). Indeed sAC is associated with CO2 sensing in bacteria and fungi (26, 36). This is potentially important in light of the stimulatory effect of basolateral CO2 on V-ATPase-mediated proton secretion (54). However, metabolic acidosis is characterized by a low HCO3− concentration, and Pco2 will be lowered by the compensatory increase in ventilation, resulting in respiratory alkalosis. Under such conditions, sAC activity might be low, and other receptors, including GPR4 (57, 60) may be more important sources of cAMP. In contrast, sAC may be an important regulator of the V-ATPase when excessive HCO3− is delivered distally due to deficient reabsorption in the proximal tubule. This could occur during dysfunctional states such as Fanconi syndrome, after treatment with the carbonic anhydrase inhibitor acetazolamide, or following supplementation with NaHCO3− as discussed, for example, by Wall et al. (66).
We have shown previously that sAC is expressed in many kidney tubule segments, including proximal and distal tubules, thick ascending limbs, and collecting ducts (42), and is found at very high levels in IC, where it forms a protein complex with the V-ATPase (45). The electroneutral sodium bicarbonate transporter NBC3 also associates with the V-ATPase in intercalated cells (48), supporting the existence of a bicarbonate-regulated signaling complex involving the V-ATPase. Clearly, for this hypothesis to be validated, cAMP must be shown to stimulate V-ATPase membrane accumulation and activity in renal IC. Our present data show that this is the case, and that the effect of cAMP on V-ATPase-rich microvillar membrane extension is both rapid and direct. In addition, the extent of the increase in pHi recovery (which is dependent on V-ATPase activity under the conditions tested) stimulated by cAMP in A-IC from the OMCD (a 40% increase) is consistent with the increase in total apically associated V-ATPase in these cells measured by immunocytochemistry and morphology (a 60–90% increase), given the different sensitivities of these very distinct techniques. Obviously, cAMP can be generated inside these cells not only via the action of sAC. Indeed, classic studies suggested that IC can respond to stimulation of G protein-coupled receptors by adrenergic agonists such as isoproterenol and norepinephrine (24, 37, 38). Proton secretion in perfused rabbit OMCD and in C11-Madin-Darby canine kidney cells was reported to increase in response to cAMP (19, 21). ANG II also stimulates proton secretion by A-IC and induces apical V-ATPase accumulation in the CCD (47). However, while ANG II was reported to reduce proton secretion in the OMCD in one study (66), another showed a Ca2+-dependent increase in V-ATPase activity and trafficking in this segment upon ANG II stimulation (50). Finally, aldosterone also induces apical V-ATPase accumulation in IC from the OMCD in a PKC-dependent manner (68). Thus the HCO3−/sAC system is but one of the possible sensors linked to signaling pathways that could induce a rise in intracellular cAMP and V-ATPase trafficking in these cells.
By analogy with the epididymal clear cell (43) and the blowfly salivary gland (63), cAMP is likely to function via activation of PKA. We have recently shown that activation of exchange proteins directly activated by cAMP (EPACs) is not necessary for V-ATPase membrane accumulation to occur in the epididymis (43). The ultimate effect of cAMP elevation and PKA activation may be via phosphorylation of some V-ATPase subunits. Database sequence searches reveal many putative phosphorylation sites on several subunits of the V-ATPase. A recent large-scale phosphoproteomics analysis of different mouse tissues confirmed that several of these sites are indeed phosphorylated in mouse kidney (personal communication from Dr. Steven Gygi, Dept. of Cell Biology, Harvard University). The sites identified in his group's analysis are S695 and S700 in Atp6v0a2; S111 in Atp6v1b2; S65 in Atp6v1g3; S59 in Atp6v1h; and S384, Y386, and S568 in Atp6v1a. Of these residues, S695 in the a2 subunit, S111 in B2, S59 in H, and S384 in A are within known PKA consensus sequences (RKDS, KKTS, KRSS, and RLAS, respectively) identified using a combination of tools on scansite.mit.edu, NetPhosK, and KinasePhos. These and the other sites are also targets for additional kinases including PKG, AKT, ATM, and CKI. We propose, therefore, that phosphorylation by PKA of one or more subunits of the V-ATPase, following sAC-dependent cAMP production (or by an alternative protein kinase), might contribute to the plasma membrane targeting of V-ATPase in IC. The identification and function of these and other predicted sites are currently under investigation in our laboratory.
Recently, phosphorylation of the C and A subunits of the V-ATPase by PKA has been demonstrated in the blowfly salivary gland (63) and HEK-293 cells, respectively (20), supporting this notion. In agreement with its lack of PKA phosphorylation sites, subunit E is not phosphorylated in yeast (41). An early study showed that the brain isoform of the V-ATPase B subunit (presumably the B2 isoform) is phosphorylated in vitro by AP50, a subunit of the clathrin assembly protein AP-2 (39). In Arabidopsis, a WNK kinase (AtWNK8) binds to and phosphorylates the V-ATPase C subunit (22).
There has been considerable interest concerning the functional and phenotypic relationship between so-called A- and B-IC (1, 56, 64). A-IC have apical V-ATPase and basolateral AE1 anion exchanger, while B-IC have either apical or basolateral (or often bipolar) V-ATPase (13), but have no detectable AE1 (3). Several other features distinguish A- and B-IC, including apical expression of the anion exchanger pendrin (51) and sodium/hydrogen exchanger regulatory factor 1 (NHERF1) expression in B- but not A-IC (10). In acute and chronic metabolic and respiratory acidosis, the number of IC with apical V-ATPase increases, and the number of cells with basolateral pumps decreases (5, 6, 53). The reverse situation has been reported in metabolic alkalosis. A-IC might also respond to luminal bicarbonate during metabolic acidosis if sufficient HCO3− is delivered distally, as discussed earlier. This effect is mimicked by acetazolamide treatment, which inhibits proximal tubule HCO3− reabsorption (4). We show here that A-IC respond to cAMP treatment by accumulating V-ATPase in their apical membrane and by developing their apical microvilli. Our quantitative data show that subapical vesicles in A-IC are enriched in V-ATPase compared with the apical membrane of nonstimulated cells, suggesting that exocytosis of these vesicles would be sufficient to explain the increase in apical membrane V-ATPase density and activity upon cAMP stimulation. However, our work in epididymal clear cells has also shown that upon stimulation of proton secretion, endocytosis of apical membrane that is depleted in V-ATPase protein also occurs, further increasing the density of V-ATPase at the cell surface upon vesicle exocytosis (7, 42). However, we found no evidence that cAMP induces a significant change in V-ATPase distribution in the B-IC population after acute cAMP exposure, although an increase in V-ATPase activity is possible. Additionally, changes in B-IC V-ATPase distribution may occur over a longer time frame. Indeed, the Al-Awqati group (1) has shown that the extracellular matrix protein hensin is involved in the establishment and maintenance of the “differentiated” A-IC phenotype, but this process occurs over a longer time period (hours) and may not be involved in the acute phase (minutes) of the response to acid-base changes.
How one IC cell subtype responds to cAMP by increasing V-ATPase insertion into the apical membrane while the other apparently fails to respond to the same acute stimulus is an intriguing cell physiological question, since they both contain similar V-ATPase holoenzymes that should be substrates for enzymatic modification as a result of cAMP elevation. Interestingly, ANG II also was reported to affect V-ATPase distribution only in A-IC but not in B-IC in the CCD (47). Thus the repertoire of intracellular signaling molecules as well as the assembly of macromolecular complexes required for the transmission of signals may be important. Of note, only B-IC express the scaffolding protein NHERF1 (10) that in other cells links parathyroid hormone activation and phospholipase C stimulation by bringing both molecules into close proximity (17, 32). Other modulatory mechanisms may include differential expression of other acid/base transporters, including CAXII (basolateral in A-cells) (27) and ammonium transporters (62), as well as regulation of other transporters by CO2/HCO3− and/or pH, including the apical anion exchanger pendrin in B-cells (35). The activity of local phosphodiesterases is also undoubtedly important in restricting cytosolic cAMP diffusion within these cells.
In summary, we show here that cAMP has profound effects on the distribution and function of the V-ATPase in type A-IC and on the stimulation of long membrane extensions and microvilli in these cells. These events are crucial markers of IC activation, and the in vivo stimuli and mechanisms that lead to this dramatic phenotypic change are currently under investigation.
GRANTS
This work was supported by National Institutes of Health grants DK-73266 (to T. G. Păunescu), DK-42956 (to D. Brown), DK-38452 (to S. Breton and D. Brown), and HD-40793 (to S. Breton). C. A. Wagner was supported by the Swiss National Science Foundation (3100A0-122217). L. M. Russo is the recipient of an Advanced Postdoctoral Award from the Juvenile Diabetes Research Foundation International. The Microscopy Core Facility of the Program in Membrane Biology received additional support from the Boston Area Diabetes and Endocrinology Research Center (DK-57521) and from the Center for the Study of Inflammatory Bowel Disease (DK-43341).
DISCLOSURES
No conflicts of interest are declared by the authors.
ACKNOWLEDGMENTS
We thank Dr. Steven Gygi, Dept. of Cell Biology, Harvard University, for kindly sharing his unpublished phosphoproteomics data with us. We gratefully acknowledge the technical assistance of David J. Linshaw in performing the immunostaining studies.
REFERENCES
- 1.Al-Awqati Q. Terminal differentiation of intercalated cells: the role of hensin. Annu Rev Physiol 65: 567–583, 2003 [DOI] [PubMed] [Google Scholar]
- 2.Alper SL. Genetic diseases of acid-base transporters. Annu Rev Physiol 64: 899–923, 2002 [DOI] [PubMed] [Google Scholar]
- 3.Alper SL, Natale J, Gluck S, Lodish HF, Brown D. Subtypes of intercalated cells in rat kidney collecting duct defined by antibodies against erythroid band 3 and renal vacuolar H+-ATPase. Proc Natl Acad Sci USA 86: 5429–5433, 1989 [DOI] [PMC free article] [PubMed] [Google Scholar]
- 4.Bagnis C, Marshansky V, Breton S, Brown D. Remodeling the cellular profile of collecting ducts by chronic carbonic anhydrase inhibition. Am J Physiol Renal Physiol 280: F437–F448, 2001 [DOI] [PubMed] [Google Scholar]
- 5.Bastani B, Haragsim L. Immunocytochemistry of renal H-ATPase. Miner Electrolyte Metab 22: 382–395, 1996 [PubMed] [Google Scholar]
- 6.Bastani B, Purcell H, Hemken P, Trigg D, Gluck S. Expression and distribution of renal vacuolar proton-translocating adenosine triphosphatase in response to chronic acid and alkali loads in the rat. J Clin Invest 88: 126–136, 1991 [DOI] [PMC free article] [PubMed] [Google Scholar]
- 7.Beaulieu V, Da Silva N, Pastor-Soler N, Brown CR, Smith PJ, Brown D, Breton S. Modulation of the actin cytoskeleton via gelsolin regulates vacuolar H+-ATPase recycling. J Biol Chem 280: 8452–8463, 2005 [DOI] [PubMed] [Google Scholar]
- 8.Breton S, Alper SL, Gluck SL, Sly WS, Barker JE, Brown D. Depletion of intercalated cells from collecting ducts of carbonic anhydrase II-deficient (CAR2 null) mice. Am J Physiol Renal Fluid Electrolyte Physiol 269: F761–F774, 1995 [DOI] [PubMed] [Google Scholar]
- 9.Breton S, Brown D. New insights into the regulation of V-ATPase-dependent proton secretion. Am J Physiol Renal Physiol 292: F1–F10, 2007 [DOI] [PubMed] [Google Scholar]
- 10.Breton S, Wiederhold T, Marshansky V, Nsumu NN, Ramesh V, Brown D. The B1 subunit of the H+ATPase is a PDZ domain-binding protein. Colocalization with NHE-RF in renal B-intercalated cells. J Biol Chem 275: 18219–18224, 2000 [DOI] [PubMed] [Google Scholar]
- 11.Brown D. Analysis of protein expression by immunocytochemistry. In: Gene Probes: A Practical Approach, edited by Hames BD, Higgins S. Oxford, UK: Oxford University Press, 1996, p. 267–311 [Google Scholar]
- 12.Brown D, Breton S. Mitochondria-rich, proton-secreting epithelial cells. J Exp Biol 199: 2345–2358, 1996 [DOI] [PubMed] [Google Scholar]
- 13.Brown D, Hirsch S, Gluck S. An H+-ATPase in opposite plasma membrane domains in kidney epithelial cell subpopulations. Nature 331: 622–624, 1988 [DOI] [PubMed] [Google Scholar]
- 14.Brown D, Hirsch S, Gluck S. Localization of a proton-pumping ATPase in rat kidney. J Clin Invest 82: 2114–2126, 1988 [DOI] [PMC free article] [PubMed] [Google Scholar]
- 15.Brown D, Lydon J, McLaughlin M, Stuart-Tilley A, Tyszkowski R, Alper S. Antigen retrieval in cryostat tissue sections and cultured cells by treatment with sodium dodecyl sulfate (SDS). Histochem Cell Biol 105: 261–267, 1996 [DOI] [PubMed] [Google Scholar]
- 16.Brown D, Păunescu TG, Breton S, Marshansky V. Regulation of the V-ATPase in kidney epithelial cells: dual role in acid-base homeostasis and vesicle trafficking. J Exp Biol 212: 1762–1772, 2009 [DOI] [PMC free article] [PubMed] [Google Scholar]
- 17.Capuano P, Bacic D, Roos M, Gisler SM, Stange G, Biber J, Kaissling B, Weinman EJ, Shenolikar S, Wagner CA, Murer H. Defective coupling of apical PTH receptors to phospholipase C prevents internalization of the Na+-phosphate cotransporter NaPi-IIa in Nherf1-deficient mice. Am J Physiol Cell Physiol 292: C927–C934, 2007 [DOI] [PubMed] [Google Scholar]
- 18.Chen Y, Cann MJ, Litvin TN, Iourgenko V, Sinclair ML, Levin LR, Buck J. Soluble adenylyl cyclase as an evolutionarily conserved bicarbonate sensor. Science 289: 625–628, 2000 [DOI] [PubMed] [Google Scholar]
- 19.Gekle M, Wunsch S, Oberleithner H, Silbernagl S. Characterization of two MDCK-cell subtypes as a model system to study principal cell and intercalated cell properties. Pflügers Arch 428: 157–162, 1994 [DOI] [PubMed] [Google Scholar]
- 20.Hallows KR, Alzamora R, Li H, Gong F, Smolak C, Neumann D, Pastor-Soler NM. AMP-activated protein kinase inhibits alkaline pH- and PKA-induced apical vacuolar H+-ATPase accumulation in epididymal clear cells. Am J Physiol Cell Physiol 296: C672–C681, 2009 [DOI] [PMC free article] [PubMed] [Google Scholar]
- 21.Hays S, Kokko JP, Jacobson HR. Hormonal regulation of proton secretion in rabbit medullary collecting duct. J Clin Invest 78: 1279–1286, 1986 [DOI] [PMC free article] [PubMed] [Google Scholar]
- 22.Hong-Hermesdorf A, Brux A, Gruber A, Gruber G, Schumacher K. A WNK kinase binds and phosphorylates V-ATPase subunit C. FEBS Lett 580: 932–939, 2006 [DOI] [PubMed] [Google Scholar]
- 23.Hurtado-Lorenzo A, Skinner M, El Annan J, Futai M, Sun-Wada GH, Bourgoin S, Casanova J, Wildeman A, Bechoua S, Ausiello DA, Brown D, Marshansky V. V-ATPase interacts with ARNO and Arf6 in early endosomes and regulates the protein degradative pathway. Nat Cell Biol 8: 124–136, 2006 [DOI] [PubMed] [Google Scholar]
- 24.Iino Y, Troy JL, Brenner BM. Effects of catecholamines on electrolyte transport in cortical collecting tubule. J Membr Biol 61: 67–73, 1981 [DOI] [PubMed] [Google Scholar]
- 25.Kamenetsky M, Middelhaufe S, Bank EM, Levin LR, Buck J, Steegborn C. Molecular details of cAMP generation in Mammalian cells: a tale of two systems. J Mol Biol 362: 623–639, 2006 [DOI] [PMC free article] [PubMed] [Google Scholar]
- 26.Klengel T, Liang WJ, Chaloupka J, Ruoff C, Schroppel K, Naglik JR, Eckert SE, Mogensen EG, Haynes K, Tuite MF, Levin LR, Buck J, Muhlschlegel FA. Fungal adenylyl cyclase integrates CO2 sensing with cAMP signaling and virulence. Curr Biol 15: 2021–2026, 2005 [DOI] [PMC free article] [PubMed] [Google Scholar]
- 27.Kyllonen MS, Parkkila S, Rajaniemi H, Waheed A, Grubb JH, Shah GN, Sly WS, Kaunisto K. Localization of carbonic anhydrase XII to the basolateral membrane of H+-secreting cells of mouse and rat kidney. J Histochem Cytochem 51: 1217–1224, 2003 [DOI] [PubMed] [Google Scholar]
- 28.Li S, Sato S, Yang X, Preisig PA, Alpern RJ. Pyk2 activation is integral to acid stimulation of sodium/hydrogen exchanger 3. J Clin Invest 114: 1782–1789, 2004 [DOI] [PMC free article] [PubMed] [Google Scholar]
- 29.Litvin TN, Kamenetsky M, Zarifyan A, Buck J, Levin LR. Kinetic properties of “soluble” adenylyl cyclase. Synergism between calcium and bicarbonate. J Biol Chem 278: 15922–15926, 2003 [DOI] [PubMed] [Google Scholar]
- 30.Ludwig MG, Vanek M, Guerini D, Gasser JA, Jones CE, Junker U, Hofstetter H, Wolf RM, Seuwen K. Proton-sensing G-protein-coupled receptors. Nature 425: 93–98, 2003 [DOI] [PubMed] [Google Scholar]
- 31.Madsen KM, Tisher CC. Structure-function relationships in H+-secreting epithelia. Fed Proc 44: 2704–2709, 1985 [PubMed] [Google Scholar]
- 32.Mahon MJ, Donowitz M, Yun CC, Segre GV. Na+/H+ exchanger regulatory factor 2 directs parathyroid hormone 1 receptor signalling. Nature 417: 858–861, 2002 [DOI] [PubMed] [Google Scholar]
- 33.Mellman I. The importance of being acid: the role of acidification in intracellular membrane traffic. J Exp Biol 172: 39–45, 1992 [DOI] [PubMed] [Google Scholar]
- 34.Miller RL, Zhang P, Smith M, Beaulieu V, Păunescu TG, Brown D, Breton S, Nelson RD. V-ATPase B1-subunit promoter drives expression of EGFP in intercalated cells of kidney, clear cells of epididymis and airway cells of lung in transgenic mice. Am J Physiol Cell Physiol 288: C1134–C1144, 2005 [DOI] [PubMed] [Google Scholar]
- 35.Milton AE, Weiner ID. Regulation of B-type intercalated cell apical anion exchange activity by CO2/HCO3. Am J Physiol Renal Physiol 274: F1086–F1094, 1998 [DOI] [PubMed] [Google Scholar]
- 36.Mogensen EG, Janbon G, Chaloupka J, Steegborn C, Fu MS, Moyrand F, Klengel T, Pearson DS, Geeves MA, Buck J, Levin LR, Muhlschlegel FA. Cryptococcus neoformans senses CO2 through the carbonic anhydrase Can2 and the adenylyl cyclase Cac1. Eukaryot Cell 5: 103–111, 2006 [DOI] [PMC free article] [PubMed] [Google Scholar]
- 37.Morel F, Chabardes D, Imbert M. Functional segmentation of the rabbit distal tubule by microdetermination of hormone-dependent adenylate cyclase activity. Kidney Int 9: 264–277, 1976 [DOI] [PubMed] [Google Scholar]
- 38.Morel F, Doucet A. Hormonal control of kidney functions at the cell level. Physiol Rev 66: 377–468, 1986 [DOI] [PubMed] [Google Scholar]
- 39.Myers M, Forgac M. The coated vesicle vacuolar (H+)-ATPase associates with and is phosphorylated by the 50-kDa polypeptide of the clathrin assembly protein AP-2. J Biol Chem 268: 9184–9186, 1993 [PubMed] [Google Scholar]
- 40.Nelson RD, Guo XL, Masood K, Brown D, Kalkbrenner M, Gluck S. Selectively amplified expression of an isoform of the vacuolar H+-ATPase 56-kilodalton subunit in renal intercalated cells. Proc Natl Acad Sci USA 89: 3541–3545, 1992 [DOI] [PMC free article] [PubMed] [Google Scholar]
- 41.Owegi MA, Carenbauer AL, Wick NM, Brown JF, Terhune KL, Bilbo SA, Weaver RS, Shircliff R, Newcomb N, Parra-Belky KJ. Mutational analysis of the stator subunit E of the yeast V-ATPase. J Biol Chem 280: 18393–18402, 2005 [DOI] [PubMed] [Google Scholar]
- 42.Pastor-Soler N, Beaulieu V, Litvin TN, Da Silva N, Chen Y, Brown D, Buck J, Levin LR, Breton S. Bicarbonate-regulated adenylyl cyclase (sAC) is a sensor that regulates pH-dependent V-ATPase recycling. J Biol Chem 278: 49523–49529, 2003 [DOI] [PMC free article] [PubMed] [Google Scholar]
- 43.Pastor-Soler NM, Hallows KR, Smolak C, Gong F, Brown D, Breton S. Alkaline pH- and cAMP-induced V-ATPase membrane accumulation is mediated by protein kinase A in epididymal clear cells. Am J Physiol Cell Physiol 294: C488–C494, 2008 [DOI] [PMC free article] [PubMed] [Google Scholar]
- 44.Păunescu TG, Da Silva N, Marshansky V, McKee M, Breton S, Brown D. Expression of the 56-kDa B2 subunit isoform of the vacuolar H+-ATPase in proton-secreting cells of the kidney and epididymis. Am J Physiol Cell Physiol 287: C149–C162, 2004 [DOI] [PubMed] [Google Scholar]
- 45.Păunescu TG, Da Silva N, Russo LM, McKee M, Lu HA, Breton S, Brown D. Association of soluble adenylyl cyclase with the V-ATPase in renal epithelial cells. Am J Physiol Renal Physiol 294: F130–F138, 2008 [DOI] [PubMed] [Google Scholar]
- 46.Păunescu TG, Russo LM, Da Silva N, Kovacikova J, Mohebbi N, Van Hoek AN, McKee M, Wagner CA, Breton S, Brown D. Compensatory membrane expression of the V-ATPase B2 subunit isoform in renal medullary intercalated cells of B1-deficient mice. Am J Physiol Renal Physiol 293: F1915–F1926, 2007 [DOI] [PubMed] [Google Scholar]
- 47.Pech V, Zheng W, Pham TD, Verlander JW, Wall SM. Angiotensin II activates H+-ATPase in type A intercalated cells. J Am Soc Nephrol 19: 84–91, 2008 [DOI] [PMC free article] [PubMed] [Google Scholar]
- 48.Pushkin A, Abuladze N, Newman D, Muronets V, Sassani P, Tatishchev S, Kurtz I. The COOH termini of NBC3 and the 56-kDa H+-ATPase subunit are PDZ motifs involved in their interaction. Am J Physiol Cell Physiol 284: C667–C673, 2003 [DOI] [PubMed] [Google Scholar]
- 49.Roth J, Brown D, Norman AW, Orci L. Localization of the vitamin D-dependent calcium-binding protein in mammalian kidney. Am J Physiol Renal Fluid Electrolyte Physiol 243: F243–F252, 1982 [DOI] [PubMed] [Google Scholar]
- 50.Rothenberger F, Velic A, Stehberger PA, Kovacikova J, Wagner CA. Angiotensin II stimulates vacuolar H+-ATPase activity in renal acid-secretory intercalated cells from the outer medullary collecting duct. J Am Soc Nephrol 18: 2085–2093, 2007 [DOI] [PubMed] [Google Scholar]
- 51.Royaux IE, Wall SM, Karniski LP, Everett LA, Suzuki K, Knepper MA, Green ED. Pendrin, encoded by the Pendred syndrome gene, resides in the apical region of renal intercalated cells and mediates bicarbonate secretion. Proc Natl Acad Sci USA 98: 4221–4226, 2001 [DOI] [PMC free article] [PubMed] [Google Scholar]
- 52.Russo LM, McKee M, Brown D. Methyl-beta-cyclodextrin induces vasopressin-independent apical accumulation of aquaporin-2 in the isolated, perfused rat kidney. Am J Physiol Renal Physiol 291: F246–F253, 2006 [DOI] [PubMed] [Google Scholar]
- 53.Sabolic I, Brown D, Gluck SL, Alper SL. Regulation of AE1 anion exchanger and H+-ATPase in rat cortex by acute metabolic acidosis and alkalosis. Kidney Int 51: 125–137, 1997 [DOI] [PubMed] [Google Scholar]
- 54.Schwartz GJ, Al-Awqati Q. Carbon dioxide causes exocytosis of vesicles containing H+ pumps in isolated perfused proximal and collecting tubules. J Clin Invest 75: 1638–1644, 1985 [DOI] [PMC free article] [PubMed] [Google Scholar]
- 55.Schwartz GJ, Al-Awqati Q. Regulation of transepithelial H+ transport by exocytosis and endocytosis. Annu Rev Physiol 48: 153–161, 1986 [DOI] [PubMed] [Google Scholar]
- 56.Schwartz GJ, Barasch J, Al-Awqati Q. Plasticity of functional epithelial polarity. Nature 318: 368–371, 1985 [DOI] [PubMed] [Google Scholar]
- 57.Seuwen K, Ludwig MG, Wolf RM. Receptors for protons or lipid messengers or both? J Recept Signal Transduct Res 26: 599–610, 2006 [DOI] [PubMed] [Google Scholar]
- 58.Shum WW, Da Silva N, McKee M, Smith PJ, Brown D, Breton S. Transepithelial projections from basal cells are luminal sensors in pseudostratified epithelia. Cell 135: 1108–1117, 2008 [DOI] [PMC free article] [PubMed] [Google Scholar]
- 59.Thomas JA, Buchsbaum RN, Zimniak A, Racker E. Intracellular pH measurements in Ehrlich ascites tumor cells utilizing spectroscopic probes generated in situ. Biochemistry 18: 2210–2218, 1979 [DOI] [PubMed] [Google Scholar]
- 60.Tobo M, Tomura H, Mogi C, Wang JQ, Liu JP, Komachi M, Damirin A, Kimura T, Murata N, Kurose H, Sato K, Okajima F. Previously postulated “ligand-independent” signaling of GPR4 is mediated through proton-sensing mechanisms. Cell Signal 19: 1745–1753, 2007 [DOI] [PubMed] [Google Scholar]
- 61.van Adelsberg J, Al-Awqati Q. Regulation of cell pH by Ca2+-mediated exocytotic insertion of H+-ATPases. J Cell Biol 102: 1638–1645, 1986 [DOI] [PMC free article] [PubMed] [Google Scholar]
- 62.Verlander JW, Miller RT, Frank AE, Royaux IE, Kim YH, Weiner ID. Localization of the ammonium transporter proteins RhBG and RhCG in mouse kidney. Am J Physiol Renal Physiol 284: F323–F337, 2003 [DOI] [PubMed] [Google Scholar]
- 63.Voss M, Vitavska O, Walz B, Wieczorek H, Baumann O. Stimulus-induced phosphorylation of vacuolar H+-ATPase by protein kinase A. J Biol Chem 282: 33735–33742, 2007 [DOI] [PubMed] [Google Scholar]
- 64.Wagner CA, Finberg KE, Breton S, Marshansky V, Brown D, Geibel JP. Renal vacuolar-ATPase. Physiol Rev 84: 1263–1314, 2004 [DOI] [PubMed] [Google Scholar]
- 65.Wagner CA, Lukewille U, Valles P, Breton S, Brown D, Giebisch GH, Geibel JP. A rapid enzymatic method for the isolation of defined kidney tubule fragments from mouse. Pflügers Arch 446: 623–632, 2003 [DOI] [PubMed] [Google Scholar]
- 66.Wall SM, Fischer MP, Glapion DM, De La Calzada M. ANG II reduces net acid secretion in rat outer medullary collecting duct. Am J Physiol Renal Physiol 285: F930–F937, 2003 [DOI] [PubMed] [Google Scholar]
- 67.Wieczorek H, Brown D, Grinstein S, Ehrenfeld J, Harvey WR. Animal plasma membrane energization by proton-motive V-ATPases. Bioessays 21: 637–648, 1999 [DOI] [PubMed] [Google Scholar]
- 68.Winter C, Schulz N, Giebisch G, Geibel JP, Wagner CA. Nongenomic stimulation of vacuolar H+-ATPases in intercalated renal tubule cells by aldosterone. Proc Natl Acad Sci USA 101: 2636–2641, 2004 [DOI] [PMC free article] [PubMed] [Google Scholar]
- 69.Zippin JH, Chen Y, Nahirney P, Kamenetsky M, Wuttke MS, Fischman DA, Levin LR, Buck J. Compartmentalization of bicarbonate-sensitive adenylyl cyclase in distinct signaling microdomains. FASEB J 17: 82–84, 2003 [DOI] [PubMed] [Google Scholar]
- 70.Zippin JH, Levin LR, Buck J. CO2/HCO3−-responsive soluble adenylyl cyclase as a putative metabolic sensor. Trends Endocrinol Metab 12: 366–370, 2001 [DOI] [PubMed] [Google Scholar]


