

Abstract
The coordination of animal growth and development requires adequate nutrients. During times of insufficient food, developmental progression is slowed and stored energy is utilized to ensure that cell and tissue survival are maintained. Here, we report our finding that the Gbb/BMP signaling pathway known to play an important role in many developmental processes in both vertebrates and invertebrates, is critical in the Drosophila larval fat body for regulating energy homeostasis. Animals with mutations in the Drosophila BMP-5,7 orthologue, glass bottom boat (gbb), or in its signaling components, display phenotypes similar to nutrient-deprived and Tor mutant larvae. These phenotypes include a developmental delay with reduced overall growth, a transparent appearance, and altered total lipid, glucose and trehalose levels. We find that Gbb/BMP signaling is required in the larval fat body for maintaining proper metabolism, yet interestingly, following nutrient deprivation larvae in turn show a loss of BMP signaling in fat body cells indicating that Gbb/BMP signaling is a central player in homeostasis. Finally, despite strong phenotypic similarities between nutrient-compromised animals and gbb mutants, distinct differences are observed in the expression of a group of starvation responsive genes. Overall, our results implicate Gbb/BMP signaling as a new pathway critical for positive regulation of nutrient storage and energy homeostasis during development.
Keywords: gbb, BMP signaling, fat body, Drosophila larvae, energy homeostasis, nutrient status, TOR
Introduction
Bone Morphogenetic Proteins (BMPs) belong to the Transforming Growth Factor-β (TGF-β) superfamily of signaling molecules. These superfamily members generate secreted bioactive ligands that regulate critical cellular processes during the development of both vertebrates and invertebrates (Chen et al., 2004; Herpin et al., 2004; Hogan, 1996; Nakayama et al., 2000). In Drosophila, the vertebrate BMP2,4, and BMP5,6,7,8 orthologues are encoded by decapentaplegic (dpp) and glass bottom boat (gbb) genes, respectively. These two BMP ligands have pleiotropic functions during Drosophila development with overlapping roles in regulating growth and patterning of the wing imaginal disc, as well as non-overlapping roles in the specification of embryonic dorsoventral cell fates and retrograde signaling at the larval neuromuscular junction (Chen et al., 2004; Herpin et al., 2004; Marques, 2005; Nakayama et al., 2000; O'Connor et al., 2006; Ray and Wharton, 2001).
gbb originally received its name due to the profound transparency of third instar larvae null for gbb function (Khalsa et al., 1998). Larval transparency is a phenotype long known to be associated with extended periods of nutrient deprivation (Britton and Edgar, 1998; Hadorn, 1951). Like starved larvae, we find that the transparency of gbb mutant larvae is largely due to a decrease in opacity of the larval fat body, a functional equivalent of the white adipose tissue and liver of vertebrates (Arrese et al., 2001; Britton and Edgar, 1998; Canavoso et al., 2001). Our observation of this notable phenotypic resemblance raised the possibility that a defect in Gbb signaling could impact the nutritional status of developing larvae, and we set out to investigate this possibility.
The ability of organisms to properly obtain, store, and metabolize nutrients is essential for their growth and development. When food is plentiful, sugars are stored as glycogen in the muscles and liver of vertebrates, with fats, or lipids, stored in the form of triacylglycerides (TAGs), in the liver and adipose tissue. Both fats and sugars are similarly stored in the insect liver and adipose organ equivalent, the fat body (Arrese et al., 2001; Canavoso et al., 2001) with sugar (trehalose) levels regulated by insulin and insect glucagon (adipokinetic hormone, AKH) secreting neurosecretory cells (Leopold and Perrimon, 2007). In the absence of adequate nutrient sources, animals will mobilize their internal nutrient stores in order to utilize their energy and ensure survival (Finn and Dice, 2006; Wigglesworth, 1972). TAGs are mobilized first to provide energy for high demand tissues, followed by the mobilization of glycogen and protein stores (Arrese et al., 2001; Finn and Dice, 2006). Under severe nutrient deprivation, not only are energy stores depleted but the time to complete development and reach maturity is significantly lengthened and the overall size of the developing animal can be dramatically reduced (Edgar, 2006; Mirth and Riddiford, 2007). The developmental pathways and molecular mechanisms involved in sensing available nutrients, as well as those involved in the regulation of lipid metabolism and energy homeostasis during the development are coming to light as is their conservation between invertebrates and vertebrates.
Mis-regulation of factors responsible for coordinating nutrient storage and metabolism in mammals increases the propensity of developing metabolic disorders, such as obesity and diabetes (Fingar and Blenis, 2004; Oldham and Hafen, 2003; Wullschleger et al., 2006). In both vertebrates and invertebrates, the insulin/IGF and Target of Rapamycin (TOR) signaling pathways have been implicated in the regulation of nutrient uptake, storage, and metabolism. Insulin signaling regulates sugar levels and stimulates nutrient storage in both Drosophila and vertebrates, while a reduction in insulin signaling results in the breakdown of stored nutrients (Britton et al., 2002; Saltiel and Kahn, 2001). TOR kinase activity is influenced by amino acid availability, and decreases in TOR function have been shown to result in reduced lipid stores in both Drosophila and vertebrates (Gao et al., 2002; Hara et al., 1998; Luong et al., 2006; Radimerski et al., 2002; Stocker et al., 2003; Um et al., 2004). Consistent with these findings Tor mutant Drosophila larvae show a reduction in size and a transparent larval phenotype that has been attributed to the utilization of stored energy (Hennig and Neufeld, 2002; Zhang et al., 2000). Thus, as is true of insulin signaling, TOR responds to the nutritional state of both mammals and Drosophila and plays a key role in the balance of energy stores.
Recent studies have shown that many of the pathways critical for metabolism are conserved between vertebrates and insects (Canavoso et al., 2001; Garofalo, 2002; Oldham and Hafen, 2003; Pan et al., 2004). This conservation and the tractable nature of Drosophila melanogaster genetics provide an ideal model system to identify key regulators of nutrient sensing, energy storage, and metabolism. Central to sustaining proper energy homeostasis during development is the larval fat body, as it coordinates the function and growth of multiple tissues with the energy demands of the organism. For example, a reduction in the ability of the fat body to sense amino acids leads to a reduction in both cell growth and cell proliferation of other tissues, such as the larval salivary glands and imaginal discs (Colombani et al., 2003). Furthermore, the fat body is in intimate communication with tissues producing hormonal signals, such as the brain and ring gland, which are critical for maintaining a stable equilibrium between energy storage and utilization (Edgar, 2006; Mirth and Riddiford, 2007).
In Drosophila larvae, TAGs from ingested foodstuffs are broken down in the midgut by digestive lipases, transported across the midgut endodermal epithelium into the hemolymph, and ultimately stored in vesicles, or lipid droplets within the fat body (Arrese et al., 2001). These stores are utilized as the primary energy source for the high demands of metamorphosis. However, during periods of food scarcity, stored TAGs can be metabolized prior to metamorphosis through the hormonal stimulation of lipases (Beenakkers et al., 1985). Mobilized lipids are ultimately transported to various target tissues, where the energy released by β-oxidation of fatty acids allows for continued growth and organismal survival (Arrese et al., 2001; Canavoso et al., 2001). A recent study has implicated the involvement of a cluster of hepatocyte-like cells, the larval oenocytes, in lipid mobilization by demonstrating that during periods of fasting, oenocytes accumulate lipids through a process that is dependent upon the appropriate metabolic functioning of the fat body (Gutierrez et al., 2007).
Based on the striking phenotypic similarity between gbb mutants and nutrient deprived larvae, we investigated the possibility that BMP signaling is important in regulating the nutritional status of Drosophila during larval development. Here, we report that the Gbb/BMP signaling pathway plays a critical role in regulating metabolism. Gbb/BMP signaling occurs in fat body cells and affects metabolic stores such that nutritional status and growth are properly achieved during the larval stages with the appropriate developmental progression.
Materials and Methods
Drosophila melanogaster strains
Flies were raised at 25°C on standard cornmeal/sugar/agar food. Oregon R flies were used as wild-type control in all experiments. Alleles are described in Flybase (www.flybase.net) except for the hypomorphic Tor15 allele obtained from Sean Oldham. The following fly stocks were used for Gal4-UAS experiments: UASgbb9.9 (Khalsa et al., 1998), FB-Gal4 (Gronke et al., 2003), BO-Gal4 (Gutierrez et al., 2007), ppl-Gal4 (Colombani et al., 2003). The expression of FB-Gal4 and ppl-Gal4 is most prominent in the larval fat body with lower levels of expression in the oenocytes (FB-Gal4) or in the brain and gut (ppl-Gal4). BO-Gal4 expression is high in embryonic and early first instar larval oenocytes but is undetectable in these cells during later larval stages. For UAS-dad FLPout clones, hsFLP; UAS-dad flies were crossed to AyGal4 UASnGFP flies and allowed to lay on an apple juice plate for 6 hours. First instar larvae were collected 0-2 hours after hatching and placed in a 37°C water bath for 10-15 min to induce UAS-dad, UAS-nGFP expressing clones. These larvae were then immediately placed on Bo-C12 containing food until dissection as crawling third instar larvae.
Larval and fat body analysis
Images of wandering third instar larvae were taken on a Leica MZ FLIII stereomicroscope using the identical settings. For WT nutrient-deprived larval images, mid-third instar larvae (96hr after hatching) were placed in an empty vial on filter paper soaked in PBS and imaged 12-24 hrs later. Fat bodies were dissected from equivalently staged third instar larvae just prior to wall crawling in 1×PBT, immediately fixed in 4% paraformaldehyde, pH 7 for 10 minutes and then incubated with phalloidin for 20 minutes. Fat bodies were mounted in the same volume of 50% glycerol with cover glass spacers to ensure that samples were not compressed. For fat body cell size measurements, 579 wild-type Oregon R cells and 457 gbb1 cells from two regions: the anterior lobe and the posterior section just anterior to the larval gonad were measured from multiple fat bodies. The cell circumference was calculated using NIH Image.
Bo-C12 feeding
No more than 30 first instar larvae (0-4 hours after hatching) were placed in 0.4g food mixed with 200μl of 5μM Bo-C12 (4,4-difluoro-5-methyl-4-bora-3a,4a-diaza-s-indacene-3-dodecanoic acid (BODIPY® 500/510 C1, C12) Molecular Probes #D-3823). Larvae were raised at 25°C in the dark. Wandering third instar larval fat bodies were dissected in PBS and fixed in 4% paraformaldehyde for 5-7 minutes and stained with 1μg/mL phalloidin-TRITC (Sigma P1951) and Hoechst (1:1000 Molecular Probes H3570) for 15 min. Fat bodies were mounted in 80% glycerol, 0.5% n-propyl-galate in PBS. Fluorescent images were obtained using a LeicaTCS-SP2-AOBS confocal microscope. All confocal images within an experiment were obtained under the same settings. The absolute level of Bo-C12 fluorescence present in fat body lipid droplets of the same genotype could vary slightly; however, differences between different genotypes or treatments were consistent from experiment to experiment, where nutrient-deprived larvae and BMP mutant fat bodies exhibited higher levels of fluorescence when compared to those from wild-type fed larvae. VOX and DeskVox (http://www.calit2.net/∼jschulze/projects/vox/) were used to analyze confocal Z-series/3D data sets.
Immunohistochemistry
Fat bodies of crawling third instar larvae were dissected and fixed in 4% formaldehyde for 10 minutes, blocked in 1% Normal Goat Serum (NGS) and 0.1% Triton-X in PBS for 1 hour. Primary antibody (anti-PS1 1:1000) (Persson et al., 1998) was added and tissue was incubated at room temperature for 2 hours. Secondary antibody (Alexa 568) was used at 1:3000. Fat bodies were stained with Hoechst (1:1000) and mounted in 80% glycerol and 0.5% N-propyl-galate in PBS. Images were taken using the same settings with a Zeiss 510 confocal laser scanning microscope.
Wing disc area
Female larvae raised at 25°C were dissected in PBS and wing imaginal discs fixed for 20 minutes in 4% paraformaldehyde/PBS. Discs were then stained with 1μg/mL Phalloidin-TRITC (Sigma P1951) for 20 minutes at room temperature. Area was determined using Image J (http://rsbweb.nih.gov/ij/). Wing disc area was traced three times, each time determining the area in pixels, and an average for each wing disc was calculated. 10-12 wing discs were examined for each genotype. For wild-type starved larval conditions, the larvae were placed on PBS soaked filter paper for 12 hours prior to pupariation.
Oenocyte analysis
Crawling third instar larvae (either fed or starved up to 24 hours before crawling) were dissected in PBS and stained with Oil Red O according to Gutierrez et al., 2007. Immunohistochemistry was carried out as for larval fat bodies (above), except the body walls of dissected third instar larvae were fixed for 20 minutes. Tissues were mounted in 80% glycerol, 0.5% n-propyl-galate, and images were taken using the same settings on a Zeiss Axiovert 200M light microscope.
Construction of UASgbbRNAi
A ∼400bp region of gbb with little to no homology with other sequences in the genome was amplified by PCR using the following forward and reverse primers: 5′GAGAGATCTCGAACTGCGTCACG3′ and 5′CATGGAATTCGTCGTCCAGCTTG3′, and cloned into the BglII and EcoRI sites of SympUAST-w. Multiple transgenic lines were generated and tested for their ability to phenocopy gbb loss of function when crossed to various Gal4 lines.
RT-PCR analysis
mRNA was isolated using RNAeasy kit (Qiagen 74104) from wild type or mutant early third instar or second instar larvae that had been fed or starved for 12 hours after the third instar or 4 hours after the second instar molt, respectively. cDNA was produced by oligo dT and MLV-reverse transcriptase (Sigma). The cycling profile was optimized for each gene primer set and for amplification within the logarithmic phase (see also Zinke et al., 2002). All primers (Supplemental Table 2) span an intron(s) except gbb, which does not have an intron. PCR products from at least 2 separate RNA samples were run on 0.8% agarose gel, which was stained with Vistra Green (Amersham RPN5786 1:10,000) for 1 hour. Gels were scanned on a Typhoon 9410, and ImageQuant software was used to determine the intensity of each band. The ratio of intensities of bands for the gene of interest to actin was then determined in each sample.
TAG analysis
Lipids were isolated from 10 wandering third instar larvae using an assay modified from (Bligh and Dyer, 1959). Lipids were spotted on a Silica chromatography plate (Baker Si250, Mallinckrodt Chemicals) and resolved in a chamber lined with Whatman paper and in heptane:isopropyl ether:acetic acid (60:40:4) using lipid standards (1787-1AMP Sigma). TLC plate was allowed to dry and placed in a chamber with iodide crystals for at least one hour and immediately scanned. ImageQuant software was used to analyze intensity and area of bands for TAGs. TAG amount was normalized for weight of the larvae, and each genotype was compared to the TAG levels of normally fed wild-type larvae.
GC-MS
Lipids were isolated according to Kunte et al. 2006 using a known amount of C15 as an internal control. To yield fatty acid methyl esters, the lipid extract was dried under helium and incubated at 50°C with 50μl of benzene, 50μl of methanol, and 5 drops of trimethylsilyldiazomethane (Sigma 362832). GC-MS analysis was performed using a JEOL JMS-600 mass spectrometer operated in the electron impact ionization mode. The GC was equipped with a 30m HP-5MS column. Amount of each fatty acid class was compared to C15, and total lipid was compared to C15 relative to the wild-type fed larvae sample.
Statistics
Data presented are mean ± SEM. The student's t-test was used for comparisons between 2 groups. Significance was assumed for p vales <0.05 unless otherwise noted.
Results
gbb mutant larvae exhibit growth defects
gbb mutants progress through development at a slower rate than wild-type larvae and gbb null animals die prior to pupation (Wharton et al., 1999). During the third larval instar, gbb mutants appear morphologically distinct from their wild-type counterparts. At equivalent developmental times during the third instar, gbb mutant larvae are slightly smaller than wild-type larvae but exhibit a markedly transparent appearance (Figure 1A,D). This transparency is primarily due to a change in opacity of the fat body. All regions of the fat body are present in gbb mutant larvae, however, the size of individual cells is reduced (Figure 1B) such that the entire organ is somewhat smaller in overall size. In addition to the smaller size and the dramatic transparency of gbb mutant fat bodies, the intracellular lipid droplets in mutant fat body cells are more variable in size than that seen in wild type fat bodies, with mutant cells often having only 2-4 very large lipid droplets per cell (Figure 1B,C). A change in lipid droplet size is often associated with a change in lipid metabolism (Brasaemle, 2007) and could be an indication that in gbb mutants, the metabolism of lipids, or metabolism in general, is in some way altered.
Figure 1. gbb mutants exhibit abnormal growth and altered fat body morphology.
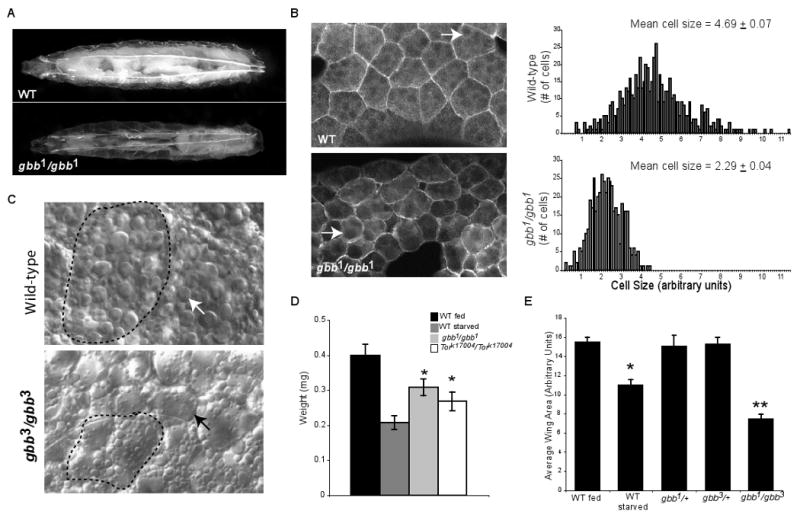
A. gbb null larvae (gbb1/gbb1) are transparent and slightly smaller compared to wild-type larvae of the same developmental stage. B. (Left panels) Phalloidin staining of dissected fat bodies reveals a difference in the size of fat body cells between wild-type and gbb mutants. (Right panels) The distribution of fat body cell sizes is shown for third instar wild-type and gbb null larvae, where the average cell size is approximately 50% smaller than wild-type fat bodies. (n>450). C. High magnification Nomarski images of dissected wild type and gbb mutant fat bodies. Variation in the size and distribution of lipid droplets (arrow) is apparent in gbb mutant tissue. Cell out line - dotted line. D. The body mass of thrid instar larvae is reduced for gbb and Tor mutants, as well as for wild type larave that have been deprived of nutrients. E. The size of crawling third instar larval wing imaginal discs is approximately 30% smaller in wild-type larvae deprived of nutrients for 12 hours compared with discs from fed wild-type larvae. Wing discs from crawling gbb1/gbb3 larvae are 50% reduced in size compared with control discs. (n>10) * and ** p<0.0001 compared with wild-type fed and control discs, respectively (student's t-test).
We had previously observed a general reduction in the size of gbb mutant larval organs, such as the brain and imaginal discs (Khalsa et al., 1998). In some tissues such as the larval salivary glands where it is possible to count all cells, we have noted that gbb1 mutants have a 14±3 % reduction in cell number (n=28). Here, we document that late third instar gbb mutant wing imaginal discs are in fact 50 percent smaller in overall area compared to the area of wild-type wing discs of the same developmental stage (Figure 1E). These findings are consistent with a requirement for gbb in ensuring normal growth of cells and tissues. Like gbb mutants, larvae mutant for genes encoding other BMP signaling components, sax (a type I receptor) and Mad (encoding the R-Smad) also show larval transparency and a reduction in organ size.
Loss of Gbb signaling leads to a reduction in metabolic stores
Larval transparency, reduced cell and tissue growth, and a change in lipid droplet size are all phenotypes strikingly similar to those observed in wild-type larvae that have been deprived of nutrients (Britton and Edgar, 1998) (Figure 1D,E; Figure S1; data not shown). These same phenotypes have also been reported in animals that lack the activity of the TOR (target of rapamycin) kinase, known to play an important role in the regulation and sensing of nutrient stores within the Drosophila fat body (Britton and Edgar, 1998; Butterworth et al., 1965; Colombani et al., 2003; Zhang et al., 2000) (Figure 2B; data not shown). The similarity of gbb mutant larval phenotypes with those of nutrient deprived wild type larvae and Tor mutant larvae led us to investigate the status of nutrient stores in gbb mutant larvae.
Figure 2. gbb mutant larvae have reduced metabolic stores.

A. Total lipids are reduced in early third instar fed gbb null and starved wild-type larvae. B. After normalization for larval weight, fed gbb null larvae and starved wild-type larvae display reduced TAG levels relative to fed wild-type larvae. C. Glucose and trehalose levels are decreased in wild-type larvae starved for 12 hours and gbb mutant larvae. *p<0.05 compared to wild-type (student's t-test). D. There is no significant change in the protein:mass ratio in gbb mutant larvae compared to wild-type larvae. Tor mutant larvae exhibit a reduced protein:mass ratio. E. GC-MS analysis indicates that early third instar fed gbb null and wild-type larvae starved for 12 hours have lower levels of short-chain fatty acids compared to wild-type fed larvae. Percent of each fatty acid type in wild-type fed larvae is given in parentheses. F,G. Short-chain fatty acids are also reduced in Tor mutant larvae.
In insects, triacylglycerides (TAGs) stored in fat body lipid droplets are the main form of stored energy (Arrese et al., 2001; Canavoso et al., 2001). Protein and glycogen deposits are also found in the fat body and the major form of circulating carbohydrates are glucose and trehalose. During periods of inadequate food, the lipids and sugars are the first stored reserves to be mobilized to ensure that there is continued growth and progression through development (Finn and Dice, 2006; Wigglesworth, 1972). We did not find a significant difference in overall protein levels between wild-type and gbb mutant third instar larvae when normalized for body mass (Figure 2D). However, we found that both lipids and sugars were reduced in gbb mutants (Figure 2A-C). We also assayed for the level of nutrient stores in wild-type larvae that had been deprived of nutrient for 12 hrs and in Tor mutant larvae. Both gbb mutants and nutrient deprived wild-type larvae show clear decreases in total lipid levels compared to fed wild-type larvae when normalized for either total body mass and/or total protein (Figure 2A), indicating that they have reduced levels of stored energy. Further analysis using thin layer chromatography (TLC) to separate lipid classes and GC-MS to analyze fatty acid chain length, revealed that gbb mutant larvae have lower levels of TAGs (Figure 2B) and significantly reduced levels of short-chain fatty acids (FAs) compared to wild-type larvae (Figure 2E). Lower levels of short-chain FAs were also observed in wild-type larvae that had been deprived of nutrients for 12 hours, as well as in normally fed Tor mutant larvae (Figure 2F,G). Tor mutant larvae were been previously shown to have reduced glucose and lipid levels (Luong et al., 2006). And the reduction we observe in short-chain FAs in Tor mutants, starved larvae as well as gbb mutants is supports the possibility that gbb mutant, Tor mutant, and fasting larvae could be metabolizing short-chain FAs as a means of obtaining energy (Gutierrez et al., 2007; Kompare and Rizzo, 2008; Reddy and Hashimoto, 2001). Consistent with these changes in nutrient stores observed in gbb mutants is the alteration in fat body morphology, specifically the change in lipid droplet size, an alteration that has been suggested to reflect changes in both lipid droplet protein content and modifications in lipid metabolism (Brasaemle, 2007).
gbb mutant larvae mount a starvation response
In principle, depleted nutrient stores in gbb mutants may result from a failure of mutant larvae to ingest food. We made use of a fluorescently labeled fatty acid, BODIPY-tagged dodecanoic acid (Bo-C12), mixed into standard Drosophila food to investigate this possibility. If gbb mutants are defective in their ability to ingest food, we predicted that they would have less Bo-C12 labeled food within their guts. We observed no difference in Bo-C12 fluorescence within the lumen of wild-type and gbb mutant larval midguts after equivalent feeding regimes (Figure 3A,B), indicating that gbb mutants have no obvious defect in their ability to ingest food. However, in these experiments we observed a difference in Bo-C12 fluorescence within the midgut epithelia and fat body lipid droplets between wild type and gbb mutant larvae. When larvae were fed food with 5μM Bo-C12, gbb mutants exhibited significantly higher levels of Bo-C12 fluorescence than wild type larvae (Figure 3, Figure S2A). This difference in Bo-C12 fluorescence did not reflect an inability of Bo-C12 to be taken up by cells of the wild type midgut epithelium since dissected midguts simply incubated with Bo-C12 readily take it up into their cells (Figure S2C). Furthermore, wild-type larvae raised on food containing higher concentrations of Bo-C12 (10μM) showed high fluorescence within both the midgut epithelium and fat body lipid mdroplets (data not shown).
Figure 3. Loss of BMP signaling leads to alterations in lipid metabolism in the fat body.
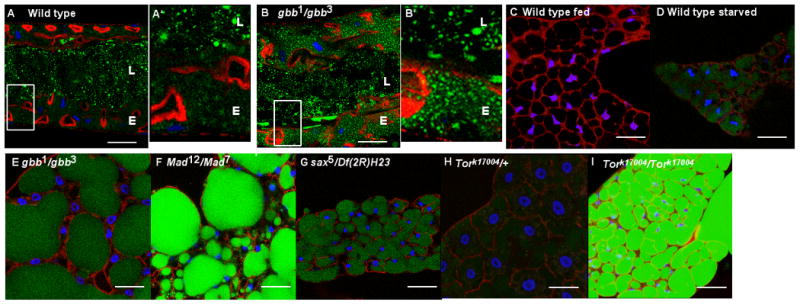
Midguts and fat bodies from wandering third instar larvae fed Bo-C12 (green) and stained with Hoechst (blue) and Phalloidin (red). A,B. Third instar wild-type (A) and gbb1/gbb3 mutant (B) guts ingest Bo-C12 from the food. (A′,B′) Magnification to 300% of regions of the midgut lumen (L) and epithelium (E), indicated by white box, illustrates the increased uptake of Bo-C12 by gbb mutants in the epithelium. C. Lipid droplets in fat body cells of wandering third instar wild-type larvae have little Bo-C12 fluorescence following continuous feeding of low levels of Bo-C12. D-I. Wild-type larvae starved for 12 hours (D), gbb1/gbb3 (E), Mad12/Mad7 (F), sax5/Df(2R)H23 (G), and Tork17004/Tork17004 (I) mutant fat bodies exhibit elevated levels of Bo-C12 fluorescence within lipid droplets indicative of increased uptake from ingested Bo-C12, likely in response to lower overall metabolic stores (see also text and Figure S2). Scale bar = 47.62μm. n> 20 for each genotype. All images were taken with identical confocal settings.
Bo-C12 is regularly used to monitor fatty acid transport in a number of systems (Tong et al 2006; Spanier et al 2009) and given the difference in Bo-C12 fluorescence observed between wild type and gbb mutant larvae following ingestion of Bo-C12 - containing food, we considered a possible explanation for the apparent difference in fatty acid transport between wild type and gbb mutants. Given that gbb mutant larvae have reduced levels of total lipids (Figure 2C), it is possible that the higher Bo-C12 fluorescence observed in gbb mutant midgut epithelia and fat bodies reflected an increase in nutrient uptake. An increase in Bo-C12 uptake would be consistent with an attempt by the mutant larvae to replenish any reduced lipid stores. Consistent with this interpretation, we found that when we fed Bo-C12 food to wild type larvae and then deprived them of any nutrients for 12 hrs they also displayed a higher level of Bo-C12 in their lipid droplets compared to the fat bodies of wild-type larvae continuously fed Bo-C12 containing food (Figure 3C,D). These observations suggest that when food is withdrawn and/or available energy stores are reduced, larvae mount a starvation response by increasing the uptake of available nutrients remaining within the gut lumen, and thus, we detect an increase in Bo-C12 uptake and transport from the midgut lumen to the fat body. If the presence of Bo-C12 fluorescence in lipid droplets of fasting larvae (Figure 3D) reflects an increase in the uptake of lipids from the gut, then a pulse of Bo-C12 food followed by a chase with standard food, whereby little to no Bo-C12 remains in the gut lumen, should result in no difference in lipid droplet fluorescence between fed and starved larvae. Indeed, no difference in the level of fat body Bo-C12 fluorescence is seen in these animals (Figure S2A). Taken together, these results indicate that Bo-C12 is readily transported from the midgut to the fat body lipid droplets upon food withdrawal and that the presence of high levels of Bo-C12 fluorescence in fat body cells is indicative of animals with altered metabolic status. Consistent with mounting a starvation response, we also found that mutant larvae appear to continually mobilize their stores, as gbb mutant (as well as Mad mutant, see below) larvae show a decrease in Bo-C12 fluorescence despite being supplied with adequate food following feeding on Bo-C12-containing food (Figure S2A).
Larvae mutant for Gbb/BMP signaling components, sax (sax5/Df(2R)H23) and Mad (Mad12/Mad7), also display high levels of Bo-C12 fluorescence in their fat body lipid droplets compared to wild-type larvae (Figure 3F,G). The increased transport of Bo-C12 into fat body lipid droplets that we observed in gbb mutant larvae is also apparent in Mad mutants. Furthermore, timed feeding experiments with Mad mutant larvae show a significant increase in Bo-C12 fluorescence by 9hrs compared to that seen in wild-type fat bodies (Figure S2B).
Given that Mad is a downstream transducer for multiple ligands in the Drosophila BMP pathway, we considered the possibility that another BMP ligand, such as the BMP 2/4 orthologue Dpp, may cooperate with Gbb as it does in a number of other developmental processes (Kawase et al., 2004; Khalsa et al., 1998; O'Connor et al., 2006; Shimmi et al., 2005). However, in this case we found that larval-lethal alleles of dpp do not exhibit larval transparency or high levels of Bo-C12 in fat body droplets (Figure S3; data not shown), suggesting that Dpp does not influence organismal metabolic status or not to the same extent as Gbb.
Tor mutants are deficient in proper nutrient sensing and show a reduction in lipid stores (Colombani et al., 2003; Luong et al., 2006). Based on our studies with Bo-C12 as a probe for fatty acid transport, we tested Tor mutants for the level of Bo-C12 fluorescence in their fat bodies. Following feeding on Bo-C12-containing food, Tor mutants display high levels of fluorescence in their fat body lipid droplets (Figure 3H,I). This high level of Bo-C12 fluorescence is indicative of increased fatty acid transport in response to compromised energy stores and is consistent with the other phenotypic similarities between Tor and gbb mutant larvae, as well as wild type larvae that have been nutrient deprived.
Gbb/BMP signaling is required in the fat body cells for proper metabolism
The larval fat body is a central player in coordinating the function of more peripheral tissues for Drosophila energy homeostasis (Leopold and Perrimon, 2007). Our data thus far indicates that the fat bodies of gbb mutants are morphologically abnormal, they exhibit abnormal transport of the Bo-C12 fatty acid, and overall the metabolic stores in gbb mutants are not at the level expected of wild type animals. It is possible that the abnormal functioning of the gbb mutant fat body results from a loss of Gbb signaling within the fat body itself or a loss from distant tissue(s) that impacts fat body morphology and function. In previous studies, we have shown that gbb is broadly expressed the imaginal discs and larval brain (Khalsa et al., 1998). Here, using both in situ hybridizations and semi-quantitative RT-PCR on isolated fat bodies, we show that gbb is also expressed in the third instar larval fat body (Figure 4A; data not shown). Furthermore, we find that wild-type fat body cells clearly receive BMP signals as indicated by the high levels of phosphorylated Mad (pMad) localized within their nuclei (Figure 4C). Wild-type levels of gbb are required for this signal, given that little to no pMad accumulates in the nuclei of gbb mutant fat body cells (Figure 4C).
Figure 4. BMP signaling in the fat body is required for proper lipid metabolism.
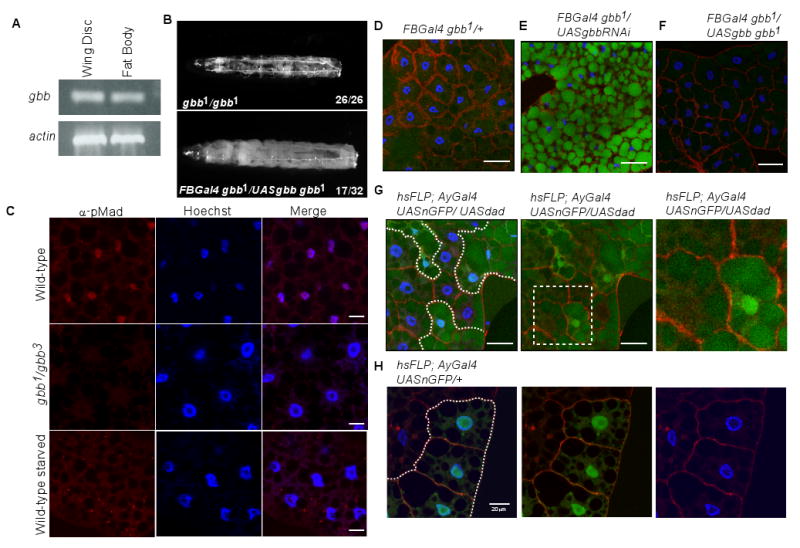
A. RT-PCR shows that gbb mRNA is expressed in isolated larval fat body tissue and wing imaginal discs, a tissue where gbb expression has previously been established (Khalsa et al., 1998). B. The clarity of 47% of gbb null larvae is rescued by expression of gbb in the fat body (FBGal4 gbb1/UASgbb9.9 gbb1). The number of transparent larvae observed is given as a ratio of total larvae examined. *p<0.01 (Chi square analysis compared to gbb1/gbb1). C. pMad accumulates in the nuclei of wild-type fat bodies (top row) but not in gbb1/gbb3 mutant fat bodies (middle row) or in approximately 65% of fat bodies from wild-type larvae deprived of nutrients for 12 hours (bottom row). n>12. Scale bar = 20μm. D,E. Knockdown of endogenous gbb expression in the fat body by RNAi leads to an increase in Bo-C12 fluorescence (green) (E) compared to control fat bodies (D). F. Fat body expression of gbb in gbb null larvae that were fed Bo-C12 restores proper lipid metabolism to little to no Bo-C12 fluorescence levels. G. FLPout clones (outlined by dotted white line and marked by the presence of nuclear GFP) overexpressing dad produce higher levels of Bo-C12 fluorescence in lipid droplets (example outlined by dotted yellow line). Scale bar = 47.62μm. H. Control FLPout clone (outlined by dotted white line and marked by the presence of nuclear GFP) in third instar larvae not fed Bo-C12 food shows lack of GFP clone marker in lipid droplets. Scale bar = 20μm.
In order to determine whether gbb endogenously expressed in fat body cells is required for proper metabolism, we knocked down gbb function in the fat body by expressing gbbRNAi (UAS-gbbRNAi) under the control of the Gal4-UAS system, by using the FB-Gal4 or ppl-Gal4 drivers, each of which have been shown to be expressed in the larval fat body (Colombani et al., 2003; Gronke et al., 2003; Gutierrez et al., 2007). In both crosses, the experimental (eg. FBGal4>UASgbbRNAi) third instar larvae were transparent, and when raised on food containing Bo-C12, their fat bodies displayed higher Bo-C12 fluorescence than those from larvae lacking UAS-gbbRNAi (Figure 4D,E and data not shown). Given that there are no other tissues in common that express both FB-Gal4 and ppl-Gal4 (see Materials and Methods), we conclude that a reduction of gbb within the fat body is primarily responsible for the obtained phenotypes.
In agreement with a role for gbb in the larval fat body, the phenotypes associated with gbb mutants including larval transparency, high levels of Bo-C12 fluorescence, and lethality are rescued by the expression of wild-type gbb in FBGal4 gbb1/UASgbb9.9 gbb1 larvae (Figures 4B,F; Table S1). A similar rescue of gbb mutant phenotypes was achieved with fat body expression of a constitutively active Sax construct (Table S1). Somewhat surprisingly, we found that when BMP signaling is blocked by the overexpression of the inhibitory Smad, Dad (hsFLP; AyGal4 UAS-nGFP/UAS-dad), Bo-C12 uptake is affected in a cell autonomous manner, as evidenced by the increase in fluorescence in fat body cells overexpressing Dad (overexpressing cells are marked by nuclear GFP) (Figure 4G). This cell autonomous elevation in lipid droplet Bo-C12 fluorescence indicates that the reduction or elimination of BMP signaling within a fat body cell alters the metabolic properties of that cell. Taken together, our findings indicate that Gbb/BMP signaling within the fat body is both necessary and sufficient to maintain normal metabolic physiology.
Finally, we find that nutrient-deprived larvae show a marked reduction or loss of nuclear pMad in their fat body cells (Figure 4C). This finding indicates that the nutritional status of animal is not only affected by a reduction in BMP signaling but an external change in nutrient availability can also alter the transduction of BMP signals. Taken together, fat body cells of third instar larvae receive and transduce BMP signals but the metabolic status of these animals both dictates and depends on fat body BMP signaling.
The molecular response to a loss in Gbb signaling is not identical to nutrient deprivation
Drosophila larvae respond to their environment by altering the expression of genes involved in the sensing and storage of nutrients (Zinke et al., 2002). A distinct change in the transcript level of genes that control the breakdown of stored lipids and proteins is seen in Drosophila larvae deprived of nutrients (Zinke et al., 1999; Zinke et al., 2002). We compared the expression levels of several of these starvation-responsive genes between wild type larvae both fed and deprived of nutrients, and from gbb mutant larvae, also both fed and nutrient deprived (Figure 5). In both fed gbb mutants and starved wild-type larvae, a lower level of expression level is seen for the amino acid transporter encoded by minidiscs (mnd), which is reportedly expressed exclusively in the fat body (Martin et al., 2000) (Figure 5A). In contrast, an increase is seen in the transcript levels of lipase3 (lip3), whose expression appears to be limited to the larval fat body (Pistillo et al., 1998), and Drosophila insulin-like peptide 2 (dilp2), whose expression is abundant in symmetrical clusters of neurons in the larval brain and in the larval salivary glands and at low levels in the imaginal discs (Brogiolo et al., 2001) (Figure 5B and F). Interestingly, other starvation-responsive genes, such as the human adipocyte triglyceride lipase (ATGL) orthologue, encoded by brummer (bmm) and a human acid lipase orthologue encoded by lipase4 (Lip4/CG6113) display a significant change in expression levels in wild-type starved larvae but not in fed gbb mutant larvae (Figure 5E; data not shown). Brummer is expressed at all stages of development and its larval expression is limited to the fat body, midgut, and gastric caeca (Gronke, 2005). In addition, the proposed long chain fatty acid transporter (CG4563) and the fatty acid synthase BcDNA:GH07626, display an expected increase and decrease in mRNA levels, respectively, in wild-type starved larvae; however, there is no change in their level of expression in fed gbb mutants (data not shown). The expression patterns of lip4, CG4563, and the fatty acid synthase BcDNA:GH07626 have not yet been determined. Taken together these results indicate that gbb mutants do not precisely mimic the transcriptional response induced by nutrient deprivation.
Figure 5. gbb mutants show alteration in the expression of some starvation-responsive genes.

A. mnd expression in early third instar larvae is reduced in wild-type larvae deprived of nutrients for 12 hours as well as in fed gbb null larvae. A further reduction in transcript levels occurs when gbb null larvae are starved for 12 hours. B. lip3 expression is increased in starved wild-type larvae and in fed gbb null larvae. Depriving gbb mutants of nutrients further increases the elevated lip3 mRNA levels. C. RfaBp mRNA levels are elevated in fed and starved gbb null larvae but are not altered in nutrient-deprived wild-type larvae. D. CG31217 (low density LDL receptor) expression is elevated in fed and starved gbb mutants relative to wild-type fed larvae. E. bmm lipase expression does not increase in gbb mutants as in wild-type starved larvae. However, bmm transcript levels slightly increase in starved gbb mutants. F. dilp2 mRNA levels are elevated in starved wild-type larvae as well as fed and starved gbb mutant larvae. In each RT-PCR sample band intensity of gene is normalized to band intensity of actin. *p<0.05 compared to wild-type fed larvae; ** p<0.05 compared to wild-type and gbb1/gbb1 fed larvae (student's t-test).
Despite not mimicking a starvation response at the transcriptional level, gbb mutants could suffer from a reduced amino acid uptake through the permease-like Mnd transporter and from alterations in lipid and sugar metabolism due to increased levels of lipase 3 and dilp2 (Zinke et al., 1999; Zinke et al., 2002). However, because our data to this point identified some similarity between gbb mutants and nutrient deprived animals with regards to metabolic stores, etc., we next asked if gbb mutants are able to properly mount a starvation response. We find that when deprived of nutrients, gbb mutants show the expected increase (lip3, bmm, and dilp2) or decrease (mnd) of gene expression that is seen in nutrient deprived wild-type larvae (Figure 5A,B,E and F). Furthermore, nutrient deprived gbb mutants show an increase in CG4563 and a decrease in BcDNA:GH07626 expression levels consistent with their ability to mount a starvation response (data not shown). Thus, the metabolic changes observed in gbb mutants result in a change in the expression of some genes involved in nutrient processing but not all. Upon nutrient deprivation wild-type larvae do not display a significant change in the level of transcription of some genes required for lipid transport, such as, Retinoid and fatty-acid binding protein (RfaBp), the vertebrate apolipoprotein 1 and 2 orthologue, and CG31217, a low density lipoprotein (LDL) receptor (Zinke et al., 2002). However, we find that transcript levels for both of these genes are increased in gbb mutants (Figure 5C,D), further highlighting the difference between the organismal responses to a loss of Gbb signaling versus the deprivation of nutrients. Another interesting difference between gbb mutant larvae and nutrient-deprived larvae is in the total level of C16:1 fatty acids present in third instar larvae. gbb mutants show similar levels of C16:1 FA as wild type fed larvae and thus, do not seem to metabolize these fatty acids as nutrient-deprived larvae (Figure 2E). Thus, while gbb mutants exhibit many morphological and physiological similarities to nutrient-deprived larvae, the molecular response to reduced Gbb signaling is different from that observed when nutrient availability is reduced.
In line with this conclusion, we find that while the oenocytes of wild-type larvae accumulate lipids during periods of nutrient deprivation (Gutierrez et al., 2007), the oenocytes of fed gbb mutants do not show an accumulation of neutral lipids (Figure S4). Upon starvation, the oenocytes of gbb mutant larvae accumulate neutral lipids, consistent with the ability of gbb mutants to elicit a starvation response.
Discussion
The nutritional status of an organism dictates its growth and maturation during development. How the balance of nutrient uptake, storage, and metabolism is coordinated with growth and developmental progression is not thoroughly understood. More recently, specific genetic and physiological pathways responsible for the coordination of growth, development and metabolism are being identified in a number of metazoan systems (Edgar, 2006; Leopold and Perrimon, 2007; Saltiel and Kahn, 2001). Here, we show that the Gbb/BMP signaling pathway regulates the metabolic status of Drosophila larvae, in addition to its role in cell fate specification. Previous studies have shown that BMP2 and BMP4, as well as a BMP transcriptional cofactor, Schnurri, can influence adipocyte differentiation (Jin et al., 2006) and that BMPs can promote the accumulation of lipids in mammalian brown pre-adipocytes (Tseng et al., 2008). However, the data presented here indicates that BMP signaling can also have a significant impact on nutrient uptake and metabolic status of the organism well after fat cell differentiation, during its progression through larval development.
gbb mutant larvae resemble nutrient deprived larvae in that they are transparent, exhibit growth defects, and utilize stored energy sources, especially short chain fatty acids (Figures 1,2). When deprived of food, wild-type larvae mount a starvation response that results in the uptake of nutrients remaining in the gut, as indicated by Bo-C12 pulse-chase experiments. Interestingly, gbb mutants show a higher level of Bo-C12 uptake despite the fact that they are not deprived of food. This indicates that while gbb mutants ingest food and take up nutrients, they are unable to maintain energy stores and thus, share physiological similarities with starved larvae. However, despite physiological and morphological similarities, nutrient-deprived wild-type larvae and fed gbb mutant larvae exhibit somewhat different gene expression profiles, based on the transcript levels of several starvation-responsive genes (Figure 5). Such dissimilarities in molecular responses suggest fundamental differences in the mechanisms responsible for ‘environmental starvation’ and ‘genetically-induced gbb mutant starvation’.
Larval transparency is perhaps the most striking aspect of the ‘starvation’ phenotype, and changes in the appearance of the larval fat body are largely responsible for this phenotype. Given that all regions of the fat body are present in gbb mutant animals, albeit exhibiting smaller cells with lipid droplets of varying sizes, and especially since these defects can be rescued by the expression of wild type gbb in the larval period, there is no indication that gbb mutants are defective in the specification and differentiation of the fat body in general, or in specific regions of this organ. Furthermore, defects in gbb mutant larvae are not evident until the late second/early third larval instar (S. Ballard and K. Wharton, personal observation). Thus, the role for Gbb signaling appears to be a later function that influences metabolism, and not one in the specification of a fat body fate or in the specific differentiation of fat body cells.
The fat body tissue is the central metabolic organ within the Drosophila larva that communicates the nutritional status of the organism to other tissues to influence their growth and function. At the same time, various tissues communicate to the fat body to promote proper storage and mobilization of energy. The defects in both the morphology and function of the fat body in gbb mutants can be at least in part accounted for by a loss or reduction in BMP signaling within the fat body itself. gbb is expressed in the fat body, and gbb is required for the nuclear localization of pMad within these cells (Figure 4), suggesting that Gbb acts within the fat body to provide active BMP signaling. A loss of Gbb/BMP signaling due to the expression of either gbb-RNAi or dad, within fat body cells compromises the nutritional status of the fat body in an autonomous manner. Expression of wild type gbb within the fat body can partially rescue larval transparency, increased levels of Bo-C12 fluorescence, and lethality caused by loss of Gbb signaling (Figure 4B and F; Table S1). Not all gbb mutant phenotypes are rescued when gbb is expressed in the fat body. The synapses at the larval neuromuscular junction (NMJ) are reduced in size in gbb mutants, with a decrease in overall bouton number (McCabe et al., 2003 and Figure S6). This undergrowth is not rescued when gbb is expressed in the fat body (Figure S6). In addition, the patterning defects observed in the adult gbb mutant wing are not rescued (S. Ballard and K. Wharton, personal observation). Furthermore, we do not find that when gbb expression is increased in the fat body of wild type larvae that a concomitant increase is seen in the size of wing discs, an effect we observe when gbb is specifically expressed in the wing imaginal disc (Khalsa et al., 1998). If Gbb were solely influencing cell/tissue growth through secretion into, and circulation via, the hemolymph, then we would expect increased expression of Gbb from tissues such as the fat body to influence distant tissues, such as the NMJ and the growth of imaginal discs. This is not what is observed, as discs from FB-Gal4/UASgbb larvae are comparable in size to wild-type discs.
However, we do find that the reduced size of gbb mutant wing imaginal discs can be partially rescued by gbb expression within the fat body (Figure S5). While it is possible, albeit unlikely as discussed above, that elevated levels of Gbb secreted into the hemolymph could be responsible for rescue, our results more strongly support the likelihood that the role of Gbb signaling in regulating metabolism via its effect on the physiology of fat body cells is rescued and thus, nutrients and energy are available for the growth of distant tissues. Our results point to an essential role for Gbb/BMP signaling within the fat body itself for regulating metabolism, however, they do not completely rule out the possibility that Gbb/BMP could also signal from another defined site to impact fat body function.
The hepatocyte-like oenocytes have been implicated in lipid metabolism based on their starvation induced accumulation of lipids following fat body depletion of lipid stores (Gutierrez et al., 2007). In gbb mutants, we did not detect an accumulation of lipids in the oenocytes as seen for starved wild-type animals which could have suggested that loss of Gbb signaling affected the communication between oenocytes and the fat body. Rather, we found that when gbb mutants were deprived of nutrients they showed an accumulation of neutral lipids, albeit not at the level of wild-type larvae, presumably because gbb mutants have lower total triglycerides than wild-type (Figure S4). Furthermore, we did not find that when a potential function of gbb in oenocytes was disrupted by the expression of gbb-RNAi by BO-Gal4 (Gutierrez et al., 2007) (BO-Gal4 gbb1/UASgbbRNAi) that there was any effect on the number of oenocytes or oenocyte clusters. Nor did we find that this manipulation induced a transparent larval phenotype or an increase of Bo-C12 in fat body lipid droplets (data not shown). Finally, we did not observe nuclear pMad in oenocytes nor a change in pMad distribution in gbb mutant or nutrient deprived larvae. Thus, the loss of gbb function does not appear to impact the specification or function of oenocytes in lipid uptake.
The larval brain is another important player in maintaining energy homeostasis and it communicates with the fat body through the secretion of insulin-like peptides (dilps) and adipokinetic hormone, AKH (glucagon), to either promote storage of nutrients or the breakdown of metabolic stores, respectively (Ikeya et al., 2002; Lee and Park, 2004; Van der Horst, 2003). We found that gbb mutant larvae have elevated levels of dilp2 expression but despite these changes we were unable to detect a synergistic genetic interaction between mutations in Gbb signaling and the insulin receptor (InR) or the insulin receptor substrate chico (M. Psotka, K. Wharton, unpublished). It is of interest, however, that an increase in insulin is associated with a mobilization of stored carbohydrates. In Drosophila, Broughton et al (2007) have shown that a specific decrease in dilp2 expression within the mNSCs (medial neurosecretory cells) of the brain results in increased levels of whole body trehalose, and interestingly, in decreased levels of dilp-3 and -5. Furthermore, it is interesting to note that profound changes in foraging behavior is associated with animals deprived of nutrients (Sokolowski, 2001), and recent work has shown that these behaviors are elicited by elevated levels of dilp2 and dilp4 (Wu et al., 2005). Consistent with these findings and the increased level of dilp2 expression observed in gbb mutants, we have observed that late third instar gbb mutant larvae forage for long periods (data not shown).
The balance between energy stored and energy expended is critical for animal growth and survival. Our results have clearly shown that a reduction in Gbb/BMP signaling impacts nutrient stores and metabolism and accordingly, we observe an up-regulation of some ‘starvation-responsive’ genes, indicating that Gbb/BMP signaling acts to promote nutrient storage. Interestingly, when animals are deprived of an external source of nutrients, we in turn observe a loss of BMP signaling (pMad) in fat body cells, consistent with the organism's need to mobilize nutrients and to postpone nutrient storage (Figure 6). The TOR pathway has been shown to be an important player in metabolism and Tor also appears to act in the Drosophila fat body. The similarities in larval phenotypes between Gbb/BMP mutants and TOR pathway mutants are striking. The fact that Tor mutants also show lower levels of short chain FAs and total lipids as well as differences in lipid transport is consistent with a central role for TOR in nutrient sensing and homeostasis. Interestingly, we find that the phenotypes of Gbb/BMP pathway mutants are affected by alterations in TOR function and vice versa (S. Ballard and K. Wharton, unpublished). Our preliminary data indicates that there is a feedback mechanism in place involving these two pathways such that the organism is able to achieve homeostasis. While the specifics of the molecular mechanisms underlying this feedback await further characterization, our observations have revealed an intimate relationship between BMP signaling and a developing organism's metabolic status, whereby Gbb/BMP signaling is critical for attaining energy homeostasis with BMP signals likely acting to influence the fat body's ability to coordinate nutrient uptake, storage, and energy availability with tissue growth. Further studies that uncover the molecular details of how BMP signaling impacts the balance of energy storage and mobilization will be critical for tackling many diseases, not only obesity and metabolic syndromes, but those that affect other tissues such as neural (Huntington's, Parkinson's, Alzheimer's, Tuberous sclerosis) and bone (fibrodysplasia ossificans progressiva) (Baggio, 2002; Farooqui et al., 2007; Shore et al., 2006) where it is clear that an individual's metabolic state impacts the presentation and progression of disease.
Figure 6. Gbb/BMP signaling regulates energy homeostasis.

The model schematizes the proposed action of Gbb/BMP signaling in the fat body to regulate energy homeostasis. gbb is expressed in fat body cells and Gbb/BMP signaling is active within this tissue through the phosphorylation and translocation of pMad to the nucleus. Gbb signaling influences the transcription of genes involved in amino acid uptake (mnd), sugar metabolism (dilp2), and lipid hydrolysis (lip3) and transport (RfaBp and CG31217 (LDL receptor)). Interestingly, in addition to its role in promoting nutirent storage BMP signaling is itself responsive to the level of metabolic stores. When nutrint levels are low the accumulation of pMad in fat body nuclei is lost.
Supplementary Material
Acknowledgments
We thank Dr. Tun-Li Shen for his expertise in GC-MS analysis, Mitch Psotka and Sarah Bowman for their contributions to the early stages of this project, especially to Figure 1. We are grateful to Peter ten Djike, Sean Oldham, Ronald Kuhnlein, Michael Pankratz, and Alex Gould for generously sharing reagents. Many thanks to Troy Shirangi, Michael McKeown, Kate O'Connor-Giles, and members of the Wharton lab for discussions and comments on the manuscript. This work was supported in part by funds from the Salomon Faculty Research Fund (Brown University), NIH GM068118 and a research grant from the Center for Research in Fibrodysplasia Ossificans Progressiva from The University of Pennsylvania awarded to K.A.W. S.L.B. was supported in part by NIH T32 GM07601.
Footnotes
Publisher's Disclaimer: This is a PDF file of an unedited manuscript that has been accepted for publication. As a service to our customers we are providing this early version of the manuscript. The manuscript will undergo copyediting, typesetting, and review of the resulting proof before it is published in its final citable form. Please note that during the production process errors may be discovered which could affect the content, and all legal disclaimers that apply to the journal pertain.
References
- Arrese EL, Canavoso LE, Jouni ZE, Pennington JE, Tsuchida K, Wells MA. Lipid storage and mobilization in insects: current status and future directions. Insect Biochem Mol Biol. 2001;31:7–17. doi: 10.1016/s0965-1748(00)00102-8. [DOI] [PubMed] [Google Scholar]
- Baggio B. Fatty acids, calcium and bone metabolism. J Nephrol. 2002;15:601–4. [PubMed] [Google Scholar]
- Beenakkers AM, Van der Horst DJ, Van Marrewijk WJ. Insect lipids and lipoproteins, and their role in physiological processes. Prog Lipid Res. 1985;24:19–67. doi: 10.1016/0163-7827(85)90007-4. [DOI] [PubMed] [Google Scholar]
- Bligh EG, Dyer WJ. A rapid method of total lipid extraction and purification. Can J Biochem Physiol. 1959;37:911–7. doi: 10.1139/o59-099. [DOI] [PubMed] [Google Scholar]
- Brasaemle DL. Thematic review series: adipocyte biology. The perilipin family of structural lipid droplet proteins: stabilization of lipid droplets and control of lipolysis. J Lipid Res. 2007;48:2547–59. doi: 10.1194/jlr.R700014-JLR200. [DOI] [PubMed] [Google Scholar]
- Britton JS, Edgar BA. Environmental control of the cell cycle in Drosophila: nutrition activates mitotic and endoreplicative cells by distinct mechanisms. Development. 1998;125:2149–58. doi: 10.1242/dev.125.11.2149. [DOI] [PubMed] [Google Scholar]
- Britton JS, Lockwood WK, Li L, Cohen SM, Edgar BA. Drosophila's insulin/PI3-kinase pathway coordinates cellular metabolism with nutritional conditions. Dev Cell. 2002;2:239–49. doi: 10.1016/s1534-5807(02)00117-x. [DOI] [PubMed] [Google Scholar]
- Brogiolo W, Stocker H, Ikeya T, Rintelen F, Fernandez R, Hafen E. An evolutionarily conserved function of the Drosophila insulin receptor and insulin-like peptides in growth control. Curr Biol. 2001;11:213–21. doi: 10.1016/s0960-9822(01)00068-9. [DOI] [PubMed] [Google Scholar]
- Butterworth FM, Bodenstein D, King RC. Adipose Tissue of Drosophila Melanogaster. I. an Experimental Study of Larval Fat Body. J Exp Zool. 1965;158:141–53. doi: 10.1002/jez.1401580203. [DOI] [PubMed] [Google Scholar]
- Canavoso LE, Jouni ZE, Karnas KJ, Pennington JE, Wells MA. Fat metabolism in insects. Annu Rev Nutr. 2001;21:23–46. doi: 10.1146/annurev.nutr.21.1.23. [DOI] [PubMed] [Google Scholar]
- Chen D, Zhao M, Mundy GR. Bone morphogenetic proteins. Growth Factors. 2004;22:233–41. doi: 10.1080/08977190412331279890. [DOI] [PubMed] [Google Scholar]
- Colombani J, Raisin S, Pantalacci S, Radimerski T, Montagne J, Leopold P. A nutrient sensor mechanism controls Drosophila growth. Cell. 2003;114:739–49. doi: 10.1016/s0092-8674(03)00713-x. [DOI] [PubMed] [Google Scholar]
- Edgar BA. How flies get their size: genetics meets physiology. Nat Rev Genet. 2006;7:907–16. doi: 10.1038/nrg1989. [DOI] [PubMed] [Google Scholar]
- Farooqui AA, Horrocks LA, Farooqui T. Modulation of inflammation in brain: a matter of fat. J Neurochem. 2007;101:577–99. doi: 10.1111/j.1471-4159.2006.04371.x. [DOI] [PubMed] [Google Scholar]
- Fingar DC, Blenis J. Target of rapamycin (TOR): an integrator of nutrient and growth factor signals and coordinator of cell growth and cell cycle progression. Oncogene. 2004;23:3151–71. doi: 10.1038/sj.onc.1207542. [DOI] [PubMed] [Google Scholar]
- Finn PF, Dice JF. Proteolytic and lipolytic responses to starvation. Nutrition. 2006;22:830–44. doi: 10.1016/j.nut.2006.04.008. [DOI] [PubMed] [Google Scholar]
- Gao X, Zhang Y, Arrazola P, Hino O, Kobayashi T, Yeung RS, Ru B, Pan D. Tsc tumour suppressor proteins antagonize amino-acid-TOR signalling. Nat Cell Biol. 2002;4:699–704. doi: 10.1038/ncb847. [DOI] [PubMed] [Google Scholar]
- Garofalo RS. Genetic analysis of insulin signaling in Drosophila. Trends Endocrinol Metab. 2002;13:156–62. doi: 10.1016/s1043-2760(01)00548-3. [DOI] [PubMed] [Google Scholar]
- Gronke S, Beller M, Fellert S, Ramakrishnan H, Jackle H, Kuhnlein RP. Control of fat storage by a Drosophila PAT domain protein. Curr Biol. 2003;13:603–6. doi: 10.1016/s0960-9822(03)00175-1. [DOI] [PubMed] [Google Scholar]
- Gronke S, Mildner A, Fellert S, Tennagels N, Petry S, Muller G, Jackle H, Kuhnlein RP. Brummer lipase is an evolutionary conserved fat storage regulator in Drosophila. Cell Metabolism. 2005;1:323–330. doi: 10.1016/j.cmet.2005.04.003. [DOI] [PubMed] [Google Scholar]
- Gutierrez E, Wiggins D, Fielding B, Gould AP. Specialized hepatocyte-like cells regulate Drosophila lipid metabolism. Nature. 2007;445:275–80. doi: 10.1038/nature05382. [DOI] [PubMed] [Google Scholar]
- Hadorn E. Developmental action of lethal factors in drosophila. Adv Genet. 1951;4:53–85. doi: 10.1016/s0065-2660(08)60231-x. [DOI] [PubMed] [Google Scholar]
- Hara K, Yonezawa K, Weng QP, Kozlowski MT, Belham C, Avruch J. Amino acid sufficiency and mTOR regulate p70 S6 kinase and eIF-4E BP1 through a common effector mechanism. J Biol Chem. 1998;273:14484–94. doi: 10.1074/jbc.273.23.14484. [DOI] [PubMed] [Google Scholar]
- Hennig KM, Neufeld TP. Inhibition of cellular growth and proliferation by dTOR overexpression in Drosophila. Genesis. 2002;34:107–10. doi: 10.1002/gene.10139. [DOI] [PubMed] [Google Scholar]
- Herpin A, Lelong C, Favrel P. Transforming growth factor-beta-related proteins: an ancestral and widespread superfamily of cytokines in metazoans. Dev Comp Immunol. 2004;28:461–85. doi: 10.1016/j.dci.2003.09.007. [DOI] [PubMed] [Google Scholar]
- Hogan BL. Bone morphogenetic proteins in development. Curr Opin Genet Dev. 1996;6:432–8. doi: 10.1016/s0959-437x(96)80064-5. [DOI] [PubMed] [Google Scholar]
- Ikeya T, Galic M, Belawat P, Nairz K, Hafen E. Nutrient-dependent expression of insulin-like peptides from neuroendocrine cells in the CNS contributes to growth regulation in Drosophila. Curr Biol. 2002;12:1293–300. doi: 10.1016/s0960-9822(02)01043-6. [DOI] [PubMed] [Google Scholar]
- Jin W, Takagi T, Kanesashi SN, Kurahashi T, Nomura T, Harada J, Ishii S. Schnurri-2 controls BMP-dependent adipogenesis via interaction with Smad proteins. Dev Cell. 2006;10:461–71. doi: 10.1016/j.devcel.2006.02.016. [DOI] [PubMed] [Google Scholar]
- Kawase E, Wong MD, Ding BC, Xie T. Gbb/Bmp signaling is essential for maintaining germline stem cells and for repressing bam transcription in the Drosophila testis. Development. 2004;131:1365–75. doi: 10.1242/dev.01025. [DOI] [PubMed] [Google Scholar]
- Khalsa O, Yoon JW, Torres-Schumann S, Wharton KA. TGF-beta/BMP superfamily members, Gbb-60A and Dpp, cooperate to provide pattern information and establish cell identity in the Drosophila wing. Development. 1998;125:2723–34. doi: 10.1242/dev.125.14.2723. [DOI] [PubMed] [Google Scholar]
- Kompare M, Rizzo WB. Mitochondrial fatty-acid oxidation disorders. Semin Pediatr Neurol. 2008;15:140–9. doi: 10.1016/j.spen.2008.05.008. [DOI] [PubMed] [Google Scholar]
- Lee G, Park JH. Hemolymph sugar homeostasis and starvation-induced hyperactivity affected by genetic manipulations of the adipokinetic hormone-encoding gene in Drosophila melanogaster. Genetics. 2004;167:311–23. doi: 10.1534/genetics.167.1.311. [DOI] [PMC free article] [PubMed] [Google Scholar]
- Leopold P, Perrimon N. Drosophila and the genetics of the internal milieu. Nature. 2007;450:186–8. doi: 10.1038/nature06286. [DOI] [PubMed] [Google Scholar]
- Luong N, Davies CR, Wessells RJ, Graham SM, King MT, Veech R, Bodmer R, Oldham SM. Activated FOXO-mediated insulin resistance is blocked by reduction of TOR activity. Cell Metab. 2006;4:133–42. doi: 10.1016/j.cmet.2006.05.013. [DOI] [PubMed] [Google Scholar]
- Marques G. Morphogens and synaptogenesis in Drosophila. J Neurobiol. 2005;64:417–34. doi: 10.1002/neu.20165. [DOI] [PubMed] [Google Scholar]
- Martin JF, Hersperger E, Simcox A, Shearn A. minidiscs encodes a putative amino acid transporter subunit required non-autonomously for imaginal cell proliferation. Mech Dev. 2000;92:155–67. doi: 10.1016/s0925-4773(99)00338-x. [DOI] [PubMed] [Google Scholar]
- Mirth CK, Riddiford LM. Size assessment and growth control: how adult size is determined in insects. Bioessays. 2007;29:344–55. doi: 10.1002/bies.20552. [DOI] [PubMed] [Google Scholar]
- Nakayama T, Cui Y, Christian JL. Regulation of BMP/Dpp signaling during embryonic development. Cell Mol Life Sci. 2000;57:943–56. doi: 10.1007/PL00000736. [DOI] [PMC free article] [PubMed] [Google Scholar]
- O'Connor MB, Umulis D, Othmer HG, Blair SS. Shaping BMP morphogen gradients in the Drosophila embryo and pupal wing. Development. 2006;133:183–93. doi: 10.1242/dev.02214. [DOI] [PMC free article] [PubMed] [Google Scholar]
- Oldham S, Hafen E. Insulin/IGF and target of rapamycin signaling: a TOR de force in growth control. Trends Cell Biol. 2003;13:79–85. doi: 10.1016/s0962-8924(02)00042-9. [DOI] [PubMed] [Google Scholar]
- Pan D, Dong J, Zhang Y, Gao X. Tuberous sclerosis complex: from Drosophila to human disease. Trends Cell Biol. 2004;14:78–85. doi: 10.1016/j.tcb.2003.12.006. [DOI] [PubMed] [Google Scholar]
- Persson U, Izumi H, Souchelnytskyi S, Itoh S, Grimsby S, Engstrom U, Heldin CH, Funa K, ten Dijke P. The L45 loop in type I receptors for TGF-beta family members is a critical determinant in specifying Smad isoform activation. FEBS Lett. 1998;434:83–7. doi: 10.1016/s0014-5793(98)00954-5. [DOI] [PubMed] [Google Scholar]
- Pistillo D, Manzi A, Tino A, Boyl PP, Graziani F, Malva C. The Drosophila melanogaster lipase homologs: a gene family with tissue and developmental specific expression. J Mol Biol. 1998;276:877–85. doi: 10.1006/jmbi.1997.1536. [DOI] [PubMed] [Google Scholar]
- Radimerski T, Montagne J, Rintelen F, Stocker H, van der Kaay J, Downes CP, Hafen E, Thomas G. dS6K-regulated cell growth is dPKB/dPI(3)K-independent, but requires dPDK1. Nat Cell Biol. 2002;4:251–5. doi: 10.1038/ncb763. [DOI] [PubMed] [Google Scholar]
- Ray RP, Wharton KA. Context-dependent relationships between the BMPs gbb and dpp during development of the Drosophila wing imaginal disk. Development. 2001;128:3913–25. doi: 10.1242/dev.128.20.3913. [DOI] [PubMed] [Google Scholar]
- Reddy JK, Hashimoto T. Peroxisomal beta-oxidation and peroxisome proliferator-activated receptor alpha: an adaptive metabolic system. Annu Rev Nutr. 2001;21:193–230. doi: 10.1146/annurev.nutr.21.1.193. [DOI] [PubMed] [Google Scholar]
- Saltiel AR, Kahn CR. Insulin signalling and the regulation of glucose and lipid metabolism. Nature. 2001;414:799–806. doi: 10.1038/414799a. [DOI] [PubMed] [Google Scholar]
- Shimmi O, Ralston A, Blair SS, O'Connor MB. The crossveinless gene encodes a new member of the Twisted gastrulation family of BMP-binding proteins which, with Short gastrulation, promotes BMP signaling in the crossveins of the Drosophila wing. Dev Biol. 2005;282:70–83. doi: 10.1016/j.ydbio.2005.02.029. [DOI] [PubMed] [Google Scholar]
- Shore EM, Xu M, Feldman GJ, Fenstermacher DA, Cho TJ, Choi IH, Connor JM, Delai P, Glaser DL, LeMerrer M, Morhart R, Rogers JG, Smith R, Triffitt JT, Urtizberea JA, Zasloff M, Brown MA, Kaplan FS. A recurrent mutation in the BMP type I receptor ACVR1 causes inherited and sporadic fibrodysplasia ossificans progressiva. Nat Genet. 2006;38:525–7. doi: 10.1038/ng1783. [DOI] [PubMed] [Google Scholar]
- Sokolowski MB. Drosophila: genetics meets behaviour. Nat Rev Genet. 2001;2:879–90. doi: 10.1038/35098592. [DOI] [PubMed] [Google Scholar]
- Stocker H, Radimerski T, Schindelholz B, Wittwer F, Belawat P, Daram P, Breuer S, Thomas G, Hafen E. Rheb is an essential regulator of S6K in controlling cell growth in Drosophila. Nat Cell Biol. 2003;5:559–65. doi: 10.1038/ncb995. [DOI] [PubMed] [Google Scholar]
- Tseng YH, Kokkotou E, Schulz TJ, Huang TL, Winnay JN, Taniguchi CM, Tran TT, Suzuki R, Espinoza DO, Yamamoto Y, Ahrens MJ, Dudley AT, Norris AW, Kulkarni RN, Kahn CR. New role of bone morphogenetic protein 7 in brown adipogenesis and energy expenditure. Nature. 2008;454:1000–4. doi: 10.1038/nature07221. [DOI] [PMC free article] [PubMed] [Google Scholar]
- Um SH, Frigerio F, Watanabe M, Picard F, Joaquin M, Sticker M, Fumagalli S, Allegrini PR, Kozma SC, Auwerx J, Thomas G. Absence of S6K1 protects against age- and diet-induced obesity while enhancing insulin sensitivity. Nature. 2004;431:200–5. doi: 10.1038/nature02866. [DOI] [PubMed] [Google Scholar]
- Van der Horst DJ. Insect adipokinetic hormones: release and integration of flight energy metabolism. Comp Biochem Physiol B Biochem Mol Biol. 2003;136:217–26. doi: 10.1016/s1096-4959(03)00151-9. [DOI] [PubMed] [Google Scholar]
- Wharton KA, Cook JM, Torres-Schumann S, de Castro K, Borod E, Phillips DA. Genetic analysis of the bone morphogenetic protein-related gene, gbb, identifies multiple requirements during Drosophila development. Genetics. 1999;152:629–40. doi: 10.1093/genetics/152.2.629. [DOI] [PMC free article] [PubMed] [Google Scholar]
- Wigglesworth V. The Principles of Insect Physiology. Chapman and Hall; London: 1972. [Google Scholar]
- Wu Q, Zhang Y, Xu J, Shen P. Regulation of hunger-driven behaviors by neural ribosomal S6 kinase in Drosophila. Proc Natl Acad Sci U S A. 2005;102:13289–94. doi: 10.1073/pnas.0501914102. [DOI] [PMC free article] [PubMed] [Google Scholar]
- Wullschleger S, Loewith R, Hall MN. TOR signaling in growth and metabolism. Cell. 2006;124:471–84. doi: 10.1016/j.cell.2006.01.016. [DOI] [PubMed] [Google Scholar]
- Zhang H, Stallock JP, Ng JC, Reinhard C, Neufeld TP. Regulation of cellular growth by the Drosophila target of rapamycin dTOR. Genes Dev. 2000;14:2712–24. doi: 10.1101/gad.835000. [DOI] [PMC free article] [PubMed] [Google Scholar]
- Zinke I, Kirchner C, Chao LC, Tetzlaff MT, Pankratz MJ. Suppression of food intake and growth by amino acids in Drosophila: the role of pumpless, a fat body expressed gene with homology to vertebrate glycine cleavage system. Development. 1999;126:5275–84. doi: 10.1242/dev.126.23.5275. [DOI] [PubMed] [Google Scholar]
- Zinke I, Schutz CS, Katzenberger JD, Bauer M, Pankratz MJ. Nutrient control of gene expression in Drosophila: microarray analysis of starvation and sugar-dependent response. Embo J. 2002;21:6162–73. doi: 10.1093/emboj/cdf600. [DOI] [PMC free article] [PubMed] [Google Scholar]
Associated Data
This section collects any data citations, data availability statements, or supplementary materials included in this article.