Abstract
Recent studies have indicated that follicle-stimulating hormone (FSH) promotes bone loss. The present study tested the hypothesis that FSH enhances the activity of bone-resorbing cytokines [interleukin (IL)-1β, tumor necrosis factor (TNF)-α, and IL-6], either by inducing their secretion or by altering their receptor expression. Thirty-six women between the ages of 20 and 50 were assessed for bone mineral density (BMD), reproductive hormone, cytokine ligand and soluble receptor concentrations, and surface expression of cytokine receptors on monocytes. In addition, isolated mononuclear cells were incubated in vitro with exogenous FSH. Univariate regression analyses indicated that BMD was inversely related to serum FSH (r = −0.29 to −0.51, P = 0.03–0.001, depending upon the skeletal site). Physical activity and body composition were also identified as significant factors by multiple regressions. Exogenous FSH induced isolated cells to secrete IL-1β, TNF-α, and IL-6 in proportion to the surface expression of FSH receptors on the monocytes. Endogenous (serum) FSH concentrations correlated with the circulating concentrations of these cytokines. None of these individual cytokines was related to BMD, but the IL-1β to IL-1 receptor antagonist (IL-1Ra) ratio was inversely related to BMD (r = −0.53, P = 0.002) in all but the most physically active women, who had significantly lower expression of IL-1 type I receptors relative to type II (decoy receptors, P = 0.01). Physical activity also correlated positively with secretion of inhibitory soluble IL-1 receptors (r = 0.53, P = 0.003). Moreover, IL-1Ra correlated strongly with percent body fat (r = 0.66, P < 0.0001). These results indicate that BMD is related to FSH concentration, physical activity, and body composition. Although each of these factors likely has direct effects on bone, the present study suggests that each may also influence BMD by modulating the activity of the osteoresorptive cytokine IL-1β.
Keywords: leptin, inhibin, physical activity
although the average age at menopause is ∼51 years, changes in hormonal concentrations and cycle regularity may begin more than 15 years earlier (18). Follicular-phase serum follicle-stimulating hormone (FSH) concentrations can increase by more than twofold between the ages of 33 and 45 years (43). Klein et al. (23) have reported that serum FSH concentrations of 40- to 45-yr-old women were higher throughout the menstrual cycle, and ∼70% higher in the early follicular phase, than in 20- to 25-yr-old women, but estradiol concentrations were similar between the two age groups. Beyond age 45, early follicular FSH concentrations increase as much as fivefold, reaching ∼50–70 mIU/ml by the time of the final menstrual period, whereas estradiol concentrations fall by ∼50–60% (6, 38). Several studies have indicated that bone mineral density (BMD) also begins to change years before the last menstrual period (17, 38, 41). Reductions in BMD have been correlated with increases in serum FSH concentrations in perimenopausal women, but not with any changes in estradiol during this period (42).
Several cytokines influence the balance between the bone-resorbing activity of osteoclasts and the bone-forming activity of osteoblasts. In vitro studies have shown that interleukin (IL)-1 stimulates the differentiation and bone-resorbing activity of osteoclasts (21). IL-1 also affects osteoblasts by inhibiting their bone matrix synthetic activity (11) and stimulating their secretion of IL-6 (26). IL-6, in turn, promotes development of osteoclasts and stimulates bone resorption (29). Tumor necrosis factor (TNF)-α promotes the fusion of monocytes into osteoclasts while inhibiting differentiation of osteoblasts from progenitor cells (32). In vivo, administration of either the naturally occurring IL-1 receptor antagonist (IL-1Ra) or soluble TNF receptors inhibited bone resorption in mice made osteopenic by ovariectomy (22). Antibodies against IL-6 blocked osteoclast development in marrow cultures taken from ovariectomized mice (20), whereas IL-6-deficient mice were not susceptible to osteoporosis by ovariectomy (35).
Both progesterone and estradiol have biphasic dose-response influences on cytokine production. In the concentration ranges of the normal menstrual cycle, exogenous progesterone enhanced, and exogenous estradiol inhibited, IL-1β and TNF-α secretion in vitro (14, 31, 34). Furthermore, spontaneous IL-1β secretion from isolated human monocytes was positively related to endogenous progesterone and negatively related to endogenous estradiol concentrations of the women from whom the cells were isolated (7). The influence of gonadotropins on cytokine secretion has not been as extensively studied, but there are reports that FSH enhanced IL-1β and IL-2 secretion by isolated peripheral blood mononuclear cells (24, 25).
Based on these observations, we hypothesized that FSH influences BMD, in part, by affecting the activity of bone-resorbing cytokines, either by inducing their secretion or by altering their receptor expression. Therefore, the purpose of the present study was to determine in adult women if 1) endogenous FSH concentrations were related to cytokine concentrations and cytokine receptor expression in vivo, 2) if cytokine secretion or receptor shedding were inducible by FSH in vitro, and 3) if any of these measures of cytokine status were associated with BMD. Physical activity, lean and fat mass, and the adipocyte-derived hormone leptin were also assessed to control for other factors that may affect BMD.
MATERIALS AND METHODS
Subjects
Thirty-six women between 20 and 50 yr of age who were experiencing natural menstrual cycles (although these cycles may have become variable) were recruited. Exclusion criteria included smoking, pregnancy, lactation, or a history of serious diseases such as diabetes, liver disease, cardiovascular disease, or cancer. Additional exclusion criteria included use of any hormone treatment or prescription drug in the past 3 mo.
Subjects reported to the laboratory between 7:30 and 9:00 A.M., having fasted for at least 8 h. Information regarding their menstrual history was collected using the baseline interview questionnaire developed for the longitudinal, multisite “Study of Women's Health Across the Nation” (SWAN) (44). Physical activity was assessed using the International Physical Activity Questionnaire (9). This was followed by blood sample collection and body composition analysis. All procedures were approved by the Human Investigation Review Board at the Medical College of Georgia.
Bone Density and Body Composition
Body composition was measured using dual-energy X-ray absorptiometry (Hologic Discovery W Densitometer; Hologic, Bedford, MA). Each scan was compartmentalized and analyzed using Hologic whole body software for total BMD, fat-free soft tissue, and percent body fat. Separate scans at the hip and lumbar spine were performed and analyzed for BMD using site-specific Hologic Scan/Analysis software protocols.
Blood Collection and Leukocyte Isolation
Blood was drawn by venipuncture of the antecubital vein and collected into a 7-ml untreated tube for serum and a 6-ml EDTA-treated tube for plasma. The serum and plasma were aliquotted and frozen at −70°C for later analysis. Three 10 ml sodium heparin-treated tubes were drawn, and the mononuclear cells were isolated by density gradient centrifugation for flow cytometry and cell culture.
Reproductive Hormone Assays
Serum concentrations of FSH, luteinizing hormone (LH), progesterone, estradiol, inhibin-A, and inhibin-B were performed by the CLASS laboratory: the core laboratory for SWAN. The CLASS laboratory is located in the Department of Epidemiology, University of Michigan, Dr. Daniel S. McConnell, Director.
Serum FSH concentrations were measured with a two-site chemiluminescence (sandwich) immunoassay using two antibodies specific for the intact FSH molecule. Results were determined from a calibration curve using standards obtained from Bayer Diagnostics, referenced to the World Health Organization 2nd IRP 78/549 standard. The minimum detectable concentration was 0.3 mIU/ml. Inter- and intra-assay coefficients of variation (CV) were 8.1 and 3.5%, respectively.
Serum LH concentrations were measured with a two-site chemiluminescent immunoassay by Bayer diagnostics. Two monoclonal antibodies, one directed at the α-subunit and the other at the β-subunit, with specificity for intact LH are employed. The minimum detectable concentration is 0.07 mIU/ml. Inter- and intra-assay CV were 6.8 and 2.8%, respectively.
Serum estradiol concentrations were measured with a competitive chemiluminescence immunoassay [ACS: 180 (E2–6), Bayer Diagnostics, Tarrytown, NY]. This assay is standardized analytically and confirmed by gas chromatography-mass spectrometry (GC-MS). The minimum detectable concentration is 1 pg/ml. Closely related compounds such as estriol show insignificant cross reactivity. Inter- and intra-assay CV are 13.8 and 8.5%, respectively. The serum progesterone assay is also a competitive chemiluminescent immunoassay. Progesterone standards have been confirmed by GC-MS (interassay CV: 7.30%, intra-assay CV: 3.0%).
Serum inhibin-A and inhibin-B concentrations were measured with enzyme-linked immunosorbent assays (ELISAs) from Diagnostic Systems Laboratories. For the inhibin-A assay, the minimum detectable concentration is 10 pg/ml, the interassay CV is 13.4%, and the intra-assay CV is 11.2%. For the inhibin-B assay, the minimum detectable concentration is 7 pg/ml, the interassay CV is 6.7%, and the intra-assay CV is 4.6%.
In Vitro Cytokine Secretion
Mononuclear cells were isolated by density gradient centrifugation using ficoll-hypaque (Sigma), washed three times with sterile saline (0.9% NaCl), and resuspended in phenol red-free RPMI-1077 medium supplemented with 2 mM of l-glutamine, 100 U/ml penicillin, 100 μg/ml streptomycin, 1% (by volume) 1 M HEPES buffer (all from Sigma, St. Louis, MO), and 1% heat-inactivated autologous plasma. Cells were then distributed in 24-well polystyrene plates (Corning Glass Works, Corning, NY) at 2.5 × 10⁶ cells/well and incubated with 0, 10, 50, and 100 mIU/ml of highly purified pharmaceutical grade human FSH (Bravelle; Ferring Pharmaceuticals, Suffern, NY) for 18 h at 37°C in a humidified 5% CO2 atmosphere. After incubation, cell supernatants were collected and centrifuged at 10,000 rpm for 1 min to remove any aspirated cells, then aliquotted and frozen at −70°C for later cytokine analysis.
Cytokine Analysis
Concentrations of IL-1β, TNF-α, IL-6, and soluble cytokine receptors (IL-1R type I & II, TNFR type I & II, IL-6Rα and gp130) were measured in plasma, serum, and supernatants using a cytometric bead array (BD Biosciences, San Jose, CA). This format employs multiple populations of microbeads, each with unique fluorescence characteristics. Each bead population is coated with capture antibodies raised against specific cytokines or soluble receptors. The beads are then mixed into the sample along with detection antibodies raised against each analyte that are labeled with compounds that fluoresce at a different wavelength than the beads. After incubation and washing, the beads are resuspended and analyzed with a BD FACSArray flow cytometer. Analytes are differentiated by bead fluorescence characteristics, and analyte concentration is measured by the fluorescence intensity of the labeled detection antibody, which is compared with standard curves generated with recombinant analytes. All assays had detection limits (based on 95% confidence intervals over blank) of <5 pg/ml, except gp130 (80 pg/ml). The intra-assay CVs were between 4 and 10%; the interassay CVs were between 4 and 15%.
Plasma leptin concentrations were determined by two-site ELISA using antibodies (MAB398, BAM398) from R & D Systems (Minneapolis, MN). The detection limit was 0.06 ng/ml, and inter- and intra-assay variability was 5 and 2%, respectively.
Flow Cytometric Analysis of Receptor Expression
FSH receptors.
Mononuclear cells were washed, resuspended to 1 × 10⁷ cells/ml, blocked with 1 mg/ml human IgG (Sigma I8640) for 30 min, and then stained with polyclonal rabbit anti-FSHR (PA1-23545; Affinity BioReagents, Golden, CO) followed by phycoerythrin (PE)-conjugated F(ab′)2 fragment goat anti-rabbit IgG (Jackson ImmunoResearch Laboratories, West Grove, PA). Rabbit IgG (Jackson ImmunoResearch Laboratories) followed by the PE-conjugated secondary reagent, was used to test for nonspecific staining. Monocytes were identified with an allophycocyanin-conjugated anti-human CD14 (BD Biosciences, San Diego, CA) that was added to the cells at the same time as the rabbit anti-FSHR. After being washed, the cells were fixed in 5% formalin/PBS, pH 7.3, and stored overnight at 4°C. The following day, flow cytometric analysis was performed with a Becton Dickinson two-laser, four-detector FACSCalibur Flow Cytometer. Cell counts were restricted to intact cells identified by a dual parameter plot of forward scatter vs. side scatter. Multicolor flow cytometry was performed with appropriate one-color controls for setting compensation for spectral overlap. Additional isotype controls were run to test for nonspecific binding.
Cytokine receptors.
IL-1 receptor type I (IL-1RI, CD121a) and type II (IL-1RII, CD121b), tumor necrosis factor receptor type I (TNFRI, CD120a) and type II (TNFRII, CD120b), IL-6 receptor-α (IL-6Rα, CD126), and the IL-6β receptor (gp130, CD130) were identified by one-color flow cytometry using PE-conjugated monoclonal antibodies (BD Biosciences). Monocytes were differentiated from lymphocytes in the isolated mononuclear cell preparations by forward- and side-scatter characteristics.
Because of unavoidable variations in blood collection volumes and isolated cell yields, not all analyses were possible in all subjects.
Data Analyses
All statistical analyses were performed using Statview statistical software (SAS, Cary, NC). Hormone and cytokine concentrations were normalized by log transformation as indicated. Results are reported as means ± SE. Standardized regression coefficients (b) are reported for independent factors in multiple regressions. A P value of <0.05 was considered statistically significant.
RESULTS
Subject Characteristics
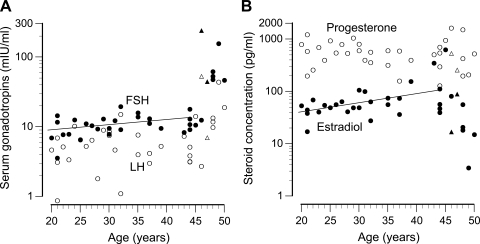
Physical characteristics and hormonal concentrations for the subjects are summarized in Table 1, and the relationship of reproductive hormone concentrations to age is shown in Fig. 1. Overall, serum FSH concentrations correlated positively with age (r = 0.65, P < 0.0001). These concentrations increased at a rate of 0.13 mIU·ml−1·yr−1 up to age 45 (r = 0.37, P = 0.047, regression line in Fig. 1A), and increased at a much steeper rate after that. Serum LH did not exhibit any significant change up to age 45, but, because of the increased concentrations in women >45 yr of age, a statistically significant increase was detected overall (r = 0.42, P = 0.01). All but two women were tested within the first 8 days of their follicular phase. These two women had prolonged/irregular cycles but were judged to be in follicular phase based on serum progesterone concentrations (shown in Figs. 1 and 2, triangles). Serum estradiol concentration exhibited an age-related increase up to age 45 (r = 0.51, P = 0.004, Fig. 1B) and decreased after that age. Serum progesterone concentrations exhibited no association with age. Mediators of ovarian feedback control of pituitary FSH secretion, inhibins A and B, were also measured. Inhibin A, the secretory product of developing antral follicles during the luteal phase, was undetectable in the majority of samples from the follicular phase women of this study. Inhibin B, the secretory product of granulosa cells in early follicular development, tended to decrease with age. Although this trend was not statistically significant by linear regression, the concentrations were significantly lower in women over 45, compared with younger women (Table 1).
Table 1.
Subject physical characteristics and hormonal concentrations
| All Subjects | ≤45 yr old | >45 yr old | P Value | |
|---|---|---|---|---|
| FSH, mIU/ml | 27.3 ± 46.4 | 11.1 ± 3.4 | 94.7 ± 77.0 | <0.0001 |
| LH, mIU/ml | 9.0 ± 10.7 | 5.7 ± 0.6 | 22.7 ± 18.4 | <0.0001 |
| Estradiol, pg/ml | 80.1 ± 112 | 91.8 ± 121 | 31.8 ± 30.8 | 0.002 |
| Progesterone, ng/ml | 0.59 ± 0.36 | 0.61 ± 0.34 | 0.53 ± 0.46 | 0.37 |
| Inhibin-B, pg/ml | 53.8 ± 36.4 | 60.8 ± 34.3 | <10 | 0.007 |
| Height, m | 1.63 ± 0.01 | 1.64 ± 0.01 | 1.62 ± 0.02 | 0.40 |
| Weight, kg | 69.7 ± 3.0 | 69.1 ± 3.0 | 72.2 ± 9.5 | 0.16 |
| Body fat, % | 33.8 ± 8.2 | 33.4 ± 7.7 | 35.0 ± 10.5 | 0.66 |
| LBMI, kg/m2 | 15.6 ± 0.37 | 15.5 ± 2.0 | 16.0 ± 3.1 | 0.58 |
| LTPA, min | 159 ± 172 | 155 ± 171 | 174 ± 187 | 0.80 |
Values are means ± SE. FSH, follicle-stimulating hormone; LH, luteinizing hormone; LBMI, lean body mass index = lean body mass (kg)/height2 (m); LTPA, leisure time physical activity. The P value pertains to the difference between the two age groups.
Fig. 1.
A: serum concentrations of follicle-stimulating hormone (FSH; ●) and luteinizing hormone (LH; ○) plotted by age. The line indicates the regression of FSH vs. age for women ≤45 yr old. B: serum concentrations of estradiol (●) and progesterone (○) plotted by age. The line indicates the regression of estradiol vs. age for women ≤45 yr old. All women were tested within the first 8 days of the follicular phase except two: these perimenopausal women with irregular cycles are indicated by triangles.
Fig. 2.
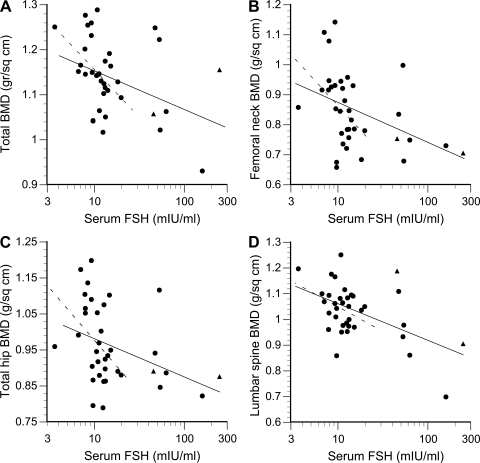
Bone mineral density (BMD) vs. serum FSH concentration. Solid line, regression for all subjects; broken line, regression for subjects ≤45 years of age. A: total BMD, all subjects: r = −0.38, P = 0.023, ≤45 yr: r = −0.44, P = 0.02. B: femoral neck BMD, all subjects: r = −0.41, P = 0.01, ≤45 yr: r = −0.42, P = 0.03. C: total hip BMD, all subjects: r = −0.36, P = 0.03, ≤45 yr: r = −0.37, P = 0.05. D: lumbar spine BMD, all subjects: r = −0.52, P = 0.001, ≤45 yr: r = −0.31, P = 0.10. Women with regular cycles tested within the first 8 days of the follicular phase are indicated by circles; perimenopausal women with irregular cycles are indicated by triangles.
FSH and Bone Density
Serum FSH concentration was inversely related to each of four measures of BMD by univariate regression (Fig. 2). This figure also shows that correlations with total BMD and femoral neck were statistically significant even if the seven subjects >45 yr of age, with extremely high FSH levels (>25 mIU/ml), were excluded from analysis. The serum concentrations of leptin correlated with total BMD (r = 0.37, P = 0.04), femoral neck BMD (r = 0.39, P = 0.02), and with percent body fat (r = 0.76, P < 0.0001).
Stepwise multiple regressions were performed to test FSH in context with other independent variables that might influence BMD, namely estradiol, progesterone, LH, age, lean body mass index, percent body fat, and leisure time physical activity. Separate regressions were performed for BMD at each skeletal site. Using this approach, serum FSH was significantly related to total and lumbar BMD (Table 2). In addition, lean body mass was positively associated with total and femoral neck BMD, and leisure time physical activity was positively associated with total and hip BMD (Table 2). Estradiol, LH, and inhibin-B were not significantly related to any of the measures of BMD.
Table 2.
Relationships of several measures of bone mineral density (dependent variables) with serum reproductive hormone concentrations, body composition, and physical activity by stepwise multiple regression
| FSH | LH | P | E | InhB | Age | LBMI | Fat, % | LTPA | Model (r2, P) | |
|---|---|---|---|---|---|---|---|---|---|---|
| Total BMD | −0.26 | 0.34 | 0.44 | 0.52 | 0.65, <0.0001 | |||||
| Total hip | −0.41 | 0.32 | 0.23, 0.01 | |||||||
| Femoral neck | −0.42 | 0.32 | 0.31, 0.002 | |||||||
| Total lumbar | −0.52 | 0.27, 0.001 |
Values are standardized regression coefficients for each statisitically significant independent variable. The last column of the table provides the r2 and P values for each of the overall regression models. Independent variables: FSH, LH, progesterone (P), estradiol (E), inhibin-B (InhB), age, LBMI, %fat, and LTPA.
FSH-Induced Cytokine Secretion
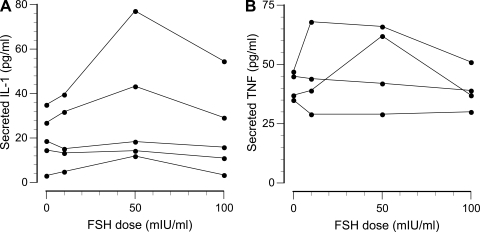
The ability of FSH to induce secretion of cytokines and soluble receptors was tested by incubating isolated mononuclear cells with 0, 10, 50, or 100 mIU/ml of FSH. As the dose-response curves in Fig. 3 show, FSH-induced increases in IL-1β and TNF-α secretion were observed inconsistently (IL-6 secretion was similar, but not shown). When a response was observed, it was usually biphasic with a maximally effective FSH dose of 10 or 50 mIU/ml, with a diminished response at 100 mIU/ml. The secretion rates of soluble receptors for IL-1, TNF, and IL-6 were not significantly affected by FSH in vitro.
Fig. 3.
Representative examples of FSH-induced secretion of interleukin (IL)-1β (A) and tumor necrosis factor (TNF)-α (B) by isolated mononuclear cells.
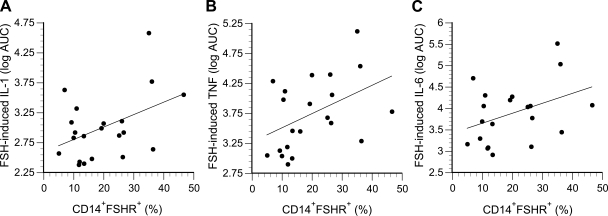
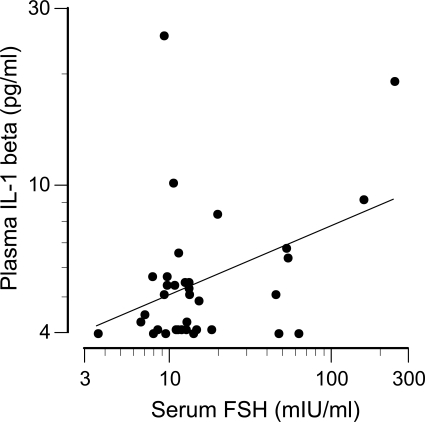
Further analysis indicated that responsiveness to FSH was related to FSH receptor expression on CD14+ monocytes. Representative flow cytometry data are shown in Fig. 4. The percentage of monocytes expressing FSH receptors ranged from 5 to 48% and was not related to age, individual reproductive hormone concentrations, or the anthropomorphic characteristics of the women. However, FSH receptor expression was related to an interaction between serum FSH and estradiol concentrations (log FSH: b = −0.84, P = 0.015; estradiol: b = −1.99, P = 0.008; log FSH × estradiol: b = 1.80, P = 0.006; overall: R2 = 0.31, P = 0.04). The positive correlations between FSH receptor expression and FSH-induced cytokine secretion (quantified as the area under the dose-response curves) are shown in Fig. 5. Consistent with these in vitro data, endogenous (serum) concentrations of FSH correlated with circulating concentrations of IL-1β (r = 0.40, P = 0.02; Fig. 6), TNF-α (r = 0.38, P = 0.02), and IL-6 (r = 0.35, P = 0.04).
Fig. 4.
Expression of FSH receptors on monocytes. A: scatterplot of CD14+ cells (FL4) stained with isotype control. B: scatterplot of CD14+ cells stained with anti-FSH receptor (FL2); C: histograms of the isotype control data and the anti-FSH receptor data (shaded area).
Fig. 5.
FSH-induced cytokine secretion plotted as a function of FSH receptor expression on monocytes. A: IL-1β (r = 0.44, P = 0.048); B: TNF-α (r = 0.45, P = 0.042); C: IL-6 (r = 0.40, P = 0.075). Secretion is expressed as the log of the area under the dose-response curves (AUC), as shown in Fig. 3.
Fig. 6.
Relation between circulating IL-1β and FSH concentrations (r = 0.40, P = 0.02).
Cytokine Ligands, Receptors, and Bone Density
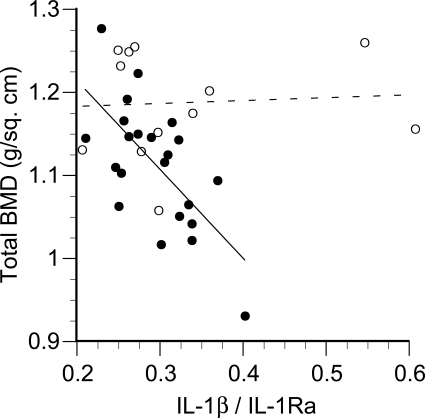
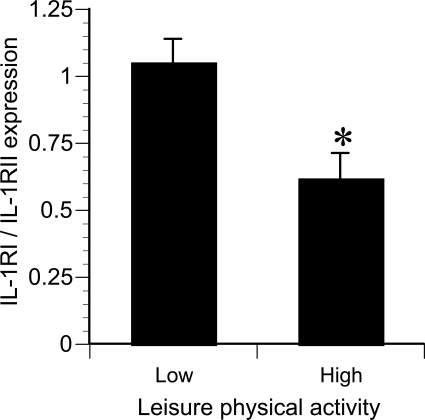
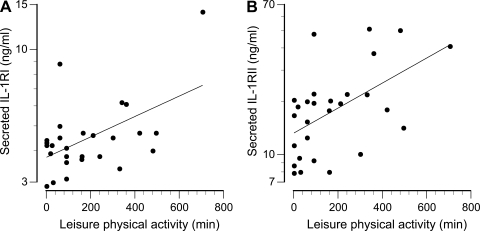
None of the individual measures of cytokine receptor expression, secretion, or circulating concentrations were significantly related to any measure of BMD. However, the ratio of plasma IL-1β/IL-1Ra was inversely related to BMD if two apparent “outliers” were excluded (Fig. 7). These two women reported leisure time physical activity well above the mean value of 159 min/wk. Monocytes isolated from these and other women in the top tertile of physical activity (Fig. 7) expressed ∼20% lower levels of the signal-transducing IL-1RI and ∼20% higher levels of the nonsignaling (decoy) IL-1RII. These differences were not statistically significant in themselves, but the difference in the ratio of IL-1RI/IL-1RII (signaling/decoy) receptors was significant (P = 0.01, Fig. 8). The univariate correlations between IL-1β/IL-1Ra ratio and BMD at all four skeletal sites (with inclusion and exclusion of the most active women) are presented in Table 3. In addition, the rate of IL-1 receptor shedding in vitro correlated significantly with the level of physical activity (Fig. 9). Analyses of TNF-α and IL-6 in combination with their receptors (both membrane-bound and secreted) failed to identify any significant relationships with BMD.
Fig. 7.
Total BMD plotted as a function of the serum IL-1β/IL-1 receptor antagonist (IL-1Ra) ratio. The solid line indicates the regression for the physically less-active women (●, r = −0.67, P = 0.0007). ○ (broken line), women in the top tertile of leisure time physical activity (≥180 min/wk, P not significant).
Fig. 8.
The ratio of signaling [IL-1 receptor type I (IL-1RI)] to decoy [IL-1 receptor type II (IL-1RII)] receptor expression on monocytes isolated from the upper tertile of physical activity (high, ≥180 min/wk) compared with the middle and lower tertiles (low). *P = 0.01.
Table 3.
Associations of bone mineral density with IL-1β−to−IL-Ra ratio
| All Subjects |
LTPA <180 min/week* |
|||
|---|---|---|---|---|
| r | P | r | P | |
| Total | −0.11 | 0.55 | −0.67 | 0.0007 |
| Hip | −0.18 | 0.31 | −0.46 | 0.03 |
| Femoral neck | −0.30 | 0.09 | −0.49 | 0.02 |
| Lumbar | −0.36 | 0.04 | −0.41 | 0.06 |
Subjects reporting leasure time physical activity of <180 min per week.
Fig. 9.
Association of leisure time physical activity with secretion of soluble IL-1RI (A) (r = 0.525, P = 0.005) and soluble IL-1RII (B) (r = 0.534, P = 0.003).
Associations With Body Fat
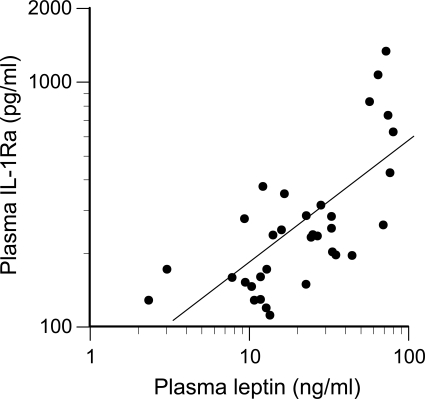
A very strong correlation between plasma IL-1Ra and percent body fat was observed (r = 0.78, P < 0.0001). A similar correlation was observed between plasma IL-1Ra and plasma leptin (r = 0.70, P < 0.0001; Fig. 10). This corresponded with leptin, a secretory product of adipose cells, correlating very highly with percent body fat (r = 0.76, P < 0.0001).
Fig. 10.
Association between plasma leptin and IL-1Ra (r = 0.70, P < 0.0001).
DISCUSSION
Hormonal Changes With Age
The steady increase in serum FSH concentrations up to age 45, followed by a steeper increase in later years (Fig. 1), is consistent with a 14-yr longitudinal study by Sowers et al. (43), who identified an inflection point in the age-related rise in follicular-phase FSH concentrations 7 yr before the final menstrual period, at a mean chronological age of 43.6 yr. Although FSH concentrations change significantly over the course of the menstrual cycle, increased concentrations of FSH in the follicular phase of older women are accompanied by an upward displacement of FSH concentrations at all other phases of the menstrual cycle as well (23, 40).
FSH and Bone Density
The inverse relation between BMD and serum FSH (Fig. 2) is in accord with previous observations in pre- and perimenopausal women (42, 44). In addition, a meta-analysis of ten prospective studies found that the rate of spinal BMD loss during perimenopause was greater than the rate of loss in the years following menopause, when estradiol concentrations were much lower (37). Although these observations imply a dominant influence of FSH (relative to estradiol) on BMD during the menopausal transition, osteoporosis can also occur in other situations (such as hypothalamic amenorrhea and administration of gonadotropin-releasing hormone antagonists) where FSH concentrations are low (reviewed in Ref. 36).
An influence of FSH on bone homeostasis has also been observed in animal studies. Sun et al. (45) reported that mice lacking the β-subunit of the dimeric FSH molecule, or lacking FSH receptors, were severely hypogonadal but maintained bone mass, indicating that a loss of estrogen did not induce bone resorption. In the same study, these authors detected FSH receptors on osteoclast precursor cells derived from the bone marrow of FSH receptor-replete mice as well as human monocyte-derived osteoclasts and found that FSH stimulated osteoclast differentiation and bone resorption by these cells in vitro. We have previously reported that immunoreactive FSH receptor extracted from human mononuclear cells migrated in gel electrophoresis in parallel with purified FSH receptor isolated from rat ovaries, with a molecular weight of ∼75 kDa (8).
Monocyte sensitivity to FSH.
The magnitude of FSH-induced cytokine secretion in vitro was proportional to the level of FSH receptor expression detected on monocytes by flow cytometry (Fig. 5). The variation in FSH receptor expression was not related to any individual hormone, but to the interaction between FSH and estradiol, which is in keeping with the rather complex hormonal regulation of FSH receptor expression described in the literature. Low doses of FSH delivered by osmotic minipump to estrogen-maintained hypophysectomized rats increased FSH receptor mRNA, whereas an additional high dose given as a bolus injection caused a rapid decrease (27). Administration of FSH alone to hypophysectomized rats increased FSH receptor expression (determined by ligand binding), whereas estradiol alone had no effect (39). In the same study, a more rapid increase was observed when both hormones were given together, however, longer exposures to estradiol ultimately resulted in reduced FSH receptor expression. Several growth factors, including members of the transforming growth factor-β family and epidermal growth factor, also influence FSH receptor expression on rat granulosa cells (13). In middle-aged women, ovarian FSH receptor expression was greatest during the late follicular phase of the menstrual cycle (30). In perimenopausal women, high serum FSH concentrations were associated with diminished ovarian FSH receptor expression (48). Conflicting data are reported for FSH receptor expression by nonovarian cells: FSH inhibited FSH receptor promoter activation in osteoclast precursor cells (49), but FSH receptor expression was increased in the bile duct epithelial cells of rats treated with FSH (28). In the present study, the expression of FSH receptors was not related to the expression of any of the cytokine receptors.
The biphasic dose response observed for FSH in vitro (Fig. 3) was similar to the results of previous reports of FSH actions on leukocytes: 10 mIU/ml FSH augmented IL-2-induced proliferation of lymphocytes, but the response was diminished at 100 mIU/ml (3). FSH also enhanced endotoxin-induced IL-1β secretion and phytohemagglutinin-induced IL-2 secretion in a biphasic manner, with maximal effects achieved in the range of 5–25 mIU/ml (25).
Cytokines and Bone Density
The inverse relationship between IL-1Ra and BMD (Fig. 7) is consistent with its role as a natural antagonist. IL-1Ra is approximately the same size as IL-1β but has limited sequence homology; it binds to both IL-1 receptor types but does not induce signal transduction (10). Pacifici et al. (33) reported that hormone replacement therapy ameliorated bone loss in postmenopausal women, in part, by reducing the ratio of IL-1β/IL-1Ra secreted by monocytes. Abrahamsen et al. (1) also reported that bone loss in perimenopausal women was inversely related to serum IL-1Ra.
The relative expression and shedding of IL-1 receptors was related to physical activity levels (Figs. 8 and 9). The expression of signal-transducing IL-1RI was diminished relative to the expression of IL-1RII on monocytes isolated from active women. IL-1RII is characterized as a “decoy” receptor because it binds IL-1β but it does not transduce a signal across the membrane of the target cell, resulting in reduced responsiveness to IL-1β (10). This differential receptor expression may be significant to bone homeostasis since a subpopulation of circulating monocytes are precursors for osteoclasts (4). Thus receptor expression on circulating monocytes might serve as an estimate of osteoclast responsiveness to IL-1β. Soluble receptors result from enzymatic cleavage of membrane-bound receptors, as well as secretion of receptors coded by alternately spliced mRNA transcripts (12). Soluble IL-1 receptors (both type I and II) intercept IL-1β in the extracellular fluid and render it unable to bind on a target cell. Receptor shedding also results in reduced receptor availability on the membranes of target cells themselves.
Body Fat, Leptin, and Bone Density
It is well-recognized that increased body mass promotes and preserves BMD. Whereas lean mass influences BMD through mechanical loading, fat mass may also be influential via metabolic or endocrine mediators, such as leptin. Significant, positive associations between circulating leptin concentrations and BMD have been reported for women (5, 16, 46), but less so for men (46). Such associations might be explained mechanistically by in vitro data indicating that leptin enhances human bone marrow cell differentiation into osteoblasts (47) and inhibits human blood mononuclear cell differentiation into osteoclasts (19). Current data (Fig. 10) support the concept that leptin may also indirectly affect bone homeostasis by increasing IL-1Ra, thereby inhibiting the osteoresorptive activity of IL-1β. The observed correlation between leptin and IL-1Ra is consistent with in vitro evidence that leptin stimulates monocytes to secrete IL-1Ra (15). IL-1Ra, in turn, inhibits the bone-resorbing activity of IL-1β (2).
Perspectives and Significance
The present study indicates that BMD is inversely related to circulating FSH concentrations in women throughout their reproductive years. This relationship may be due in part to direct effects of FSH on osteoclasts, but the present data indicate that FSH also stimulates monocytes to secrete IL-1β, which can activate osteoclasts and promote bone resorption. Moreover, in addition to benefits provided by loading the skeleton, fat mass and physical activity may also preserve bone mass by inhibiting the osteoresorptive activity of IL-1β through induction of IL-1Ra and modification of IL-1 receptor expression. The associative observations of the current study provide a rationale for conducting weight (fat) loss and exercise training studies to determine if such interventions actually cause changes in the expression or secretion of factors that regulate IL-1β.
GRANTS
This work was supported by National Institute on Aging Grant AG-027714.
DISCLOSURES
No conflicts of interest are declared by the authors.
REFERENCES
- 1.Abrahamsen B, Bonnevie-Nielsen V, Ebbesen EN, Gram J, Beck-Nielsen H. Cytokines and bone loss in a 5-year longitudinal study Hormone replacement therapy suppresses serum soluble interleukin-6 receptor and increases interleukin-1 receptor antagonist: The Danish Osteoporosis Prevention Study. J Bone Miner Res 15: 1545–1554, 2000 [DOI] [PubMed] [Google Scholar]
- 2.Arend WP. The mode of action of cytokine inhibitors. J Rheumatol 29, Suppl 65: 16–21, 2002 [PubMed] [Google Scholar]
- 3.Athreya BH, Pletcher J, Zulian F, Weiner DB, Williams WV. Subset-specific effects of sex hormones and pituitary gonadotropins on human lymphocyte proliferation in vitro. Clin Immunol Immunopathol 66: 201–211, 1993 [DOI] [PubMed] [Google Scholar]
- 4.Atkins GJ, Kostakis P, Vincent C, Farrugia AN, Houchins JP, Findley DM, Evdokiou A, Zannettino ACW. RANK expression as a cell surface marker of human osteoclast precursors in peripheral blood, bone marrow, and giant cell tumors of bone. J Bone Miner Res 21: 1339–1349, 2006 [DOI] [PubMed] [Google Scholar]
- 5.Blain H, Vuillemin A, Guillemin F, Durant R, Hanesse B, de Talance N, Doucet B, Jeandel C. Serum leptin level is a predictor of bone mineral density in postmenopausal women. J Clin Endo Metab 87: 1030–1035, 2002 [DOI] [PubMed] [Google Scholar]
- 6.Burger HG, Dudley EC, Hopper JL, Groome N, Guthrie JR, Green A, Dennerstein L. Prospectively measured levels of serum follicle-stimulating hormone, estradiol, and the dimeric inhibins during the menopausal transition in a population-bsed cohort of women. J Clin Endo Metab 84: 4025–4030, 1999 [DOI] [PubMed] [Google Scholar]
- 7.Cannon JG, Angel JB, Abad LW, Vannier E, Mileno MD, Fagioli L, Wolff SM, Komaroff AL. Interleukin-1β, interleukin-1 receptor antagonist and soluble interleukin-1 receptor type II secretion in chronic fatigue syndrome. J Clin Immunol 17: 253–261, 1997 [DOI] [PubMed] [Google Scholar]
- 8.Cannon JG, Guion J, Sloan GJ, Stallings J. Follicle-stimulating hormone receptor expression on leukocytes. FASEB J 20: A1285, 2006 [Google Scholar]
- 9.Craig CL, Marshall AL, Sjostrom M, Bauman AE, Booth ML, Ainsworth BE, Pratt M, Ekelund U, Yngve A, Sallis JF, Oja P. International physical activity questionnare: 12-country reliability and validity. Med Sci Sports Exerc 35: 1381–1395, 2003 [DOI] [PubMed] [Google Scholar]
- 10.Dinarello CA. Immunological and inflammatory functions of the interleukin-1 family. Ann Rev Immunol 27: 519–550, 2009 [DOI] [PubMed] [Google Scholar]
- 11.Evans DB, Bunning RA, Russell RG. The effects of recombinant human interleukin-1 beta on cellular proliferation and the production of prostaglandin E2, plasminogen activator, osteocalcin and alkaline phosphatase by osteoblast-like cells derived from human bone. Biochem Biophys Res Commun 166: 208–216, 1990 [DOI] [PubMed] [Google Scholar]
- 12.Fernandez-Botran R. Soluble cytokine receptors: Basic immunology and clinical applications. Crit Rev Clin Lab Sci 36: 165–244, 1999 [DOI] [PubMed] [Google Scholar]
- 13.Findlay JK, Drummond AE. Regulation of the FSH receptor in the ovary. Trends Endocrinol Metab 10: 183–188, 1999 [DOI] [PubMed] [Google Scholar]
- 14.Flynn A. Stimulation of interleukin-1 production from placental monocytes. Lymphokine Res 3: 1–5, 1984 [PubMed] [Google Scholar]
- 15.Gabay C, Dreyer MG, Pellegrinelli N, Chicheportiche R, Meier CA. Leptin directly induces the secretion of inteleukin 1 receptor antagonist in human monocytes. J Clin Endo Metab 86: 783–791, 2001 [DOI] [PubMed] [Google Scholar]
- 16.Goulding A, Taylor RW. Plasma leptin values in relation to bone mass and density and to dynamic biochemical markers of bone resorption and formation in postmenopausal women. Calcif Tissue Int 63: 456–458, 1998 [DOI] [PubMed] [Google Scholar]
- 17.Guthrie JR, Ebeling PR, Hopper JL, Barrett-Connor E, Dennerstein L, Dudley EC, Burger HG, Wark JD. A prospective study of bone loss in menopausal Australian-born women. Osteoporos Int 8: 282–290, 1998 [DOI] [PubMed] [Google Scholar]
- 18.Hall JE. Neuroendocrine physiology of the early and late menopause. Endocrinol Metab Clin N Am 33: 637–659, 2004 [DOI] [PubMed] [Google Scholar]
- 19.Holloway WR, Collier FM, Aitken CJ, Myers DE, Hodge JM, Malakellis M, Gough TJ, Collier GR, Nicholson GC. Leptin inhibits osteoclast generation. J Bone Miner Res 17: 200–209, 2002 [DOI] [PubMed] [Google Scholar]
- 20.Jilka RL, Hangoc G, Girasole G, Passeri G, Williams DC, Abrams JS, Boyce B, Broxmeyer H, Manolagas SC. Increased osteoclast development after estrogen loss: Mediation by interleukin-6. Science 257: 88–91, 1992 [DOI] [PubMed] [Google Scholar]
- 21.Jimi E, Nakamura I, Duong LT, Ikebe T, Takahashi N, Rodan GA, Suda T. Interleukin 1 induces multinucleation and bone-resorbing activity of osteoclasts in the absence of osteoblasts/stromal cells. Exp Cell Res 247: 84–93, 1999 [DOI] [PubMed] [Google Scholar]
- 22.Kitazawa R, Kimble RB, Vannice JL, Kung VT, Pacifici R. Interleukin-1 receptor antagonist and tumor necrosis factor binding protein decrease osteoclast formation and bone resorption in ovariectomized mice. J Clin Invest 94: 2397–2406, 1994 [DOI] [PMC free article] [PubMed] [Google Scholar]
- 23.Klein NA, Battaglia DE, Fujimoto VY, Davis GS, Bremner WJ, Soules MR. Reproductive aging: Accelerated ovarian follicular development associated with a monotropic follicle-stimulating hormone rise in normal older women. J Clin Endo Metab 81: 1038–1045, 1996 [DOI] [PubMed] [Google Scholar]
- 24.Komorowski J, Jankiewicz J, Stepien H. Effects of thyrotropin, follicle stimulating hormone and luteinizing hormone on sIL-2R in vitro secretion from human peripheral blood mononuclear cells. Cytobios 93: 43–48, 1998 [PubMed] [Google Scholar]
- 25.Komorowski J, Pawlikowski M, Stepien H. Pituitary glycoprotein hormones and interleukin secretion. Ann NY Acad Sci 762: 429–431, 1995 [DOI] [PubMed] [Google Scholar]
- 26.Lacey DL, Grosso LE, Moser SA, Erdmann J, Tan HL, Pacifici R, Villareal DT. IL-1-induced murine osteoblast IL-6 production is mediated by the type 1 IL-1 receptor and is increased by 1,25 dihydroxyvitamin D3. J Clin Invest 91: 1731–1742, 1993 [DOI] [PMC free article] [PubMed] [Google Scholar]
- 27.LaPolt PS, Tilly JL, Aihara T, Nishimori K, Hsueh AJW. Gonadotropin-induced up- and down-regulation of ovarian follicle-stimulating hormone (FSH) receptor gene expression in immature rats: Effects of pregnant mare's serum gonadotropin, human chorionic gonadotropin, and recombinant FSH. Endocrinology 130: 1289–1295, 1992 [DOI] [PubMed] [Google Scholar]
- 28.Mancinelli R, Onori P, Gaudio E, DeMorrow S, Franchitto A, Francis H, Glaser S, Carpino G, Venter J, Alvaro D, Kopriva S, White M, Kossie A, Savage J, Alpini G. Follicle-stimulating hormone increases cholangiocyte proliferation by an autocrine mechanism via cAMP-dependent phosphorylation of ERK1/2 and Elk-1. Am J Physiol Gastrointest Liver Physiol 297: G11–G26, 2009 [DOI] [PMC free article] [PubMed] [Google Scholar] [Retracted]
- 29.Manolagas SC, Jilka RL. Bone marrow, cytokines and bone remodeling. N Engl J Med 332: 305–311, 1995 [DOI] [PubMed] [Google Scholar]
- 30.Minegishi T, Tano M, Igarashi M, Rokukawa Y, Abe Y, Ibuki Y, Miyamoto K. Expression of follicle-stimulating hormone receptor in human ovary. Eur J Clin Invest 27: 469–474, 1997 [DOI] [PubMed] [Google Scholar]
- 31.Mori H, Nakagawa M, Itoh N, Wada K, Tamaya T. Danazol suppresses the production of interleukin-1β and tumor necrosis factor by human monocytes. Am J Repro Immunol 24: 45–50, 1990 [DOI] [PubMed] [Google Scholar]
- 32.Nanes MS. Tumor necrosis factor-α: Molecular and cellular mechanisms in skeletal pathology. Gene 321: 1–15, 2003 [DOI] [PubMed] [Google Scholar]
- 33.Pacifici R, Vannice JL, Rifas L, Kimble RB. Monocytic secretion of interleukin-1 receptor antagonist in normal and osteoporotic women: Effects of menopause and estrogen/progesterone therapy. J Clin Endo Metab 77: 1135–1141, 1993 [DOI] [PubMed] [Google Scholar]
- 34.Polan ML, Daniele A, Kuo A. Gonadal steroids modulate human monocyte interleukin-1 (IL-1) activity. Fertil Steril 49: 964–968, 1988 [PubMed] [Google Scholar]
- 35.Poli V, Balena R, Fattori E, Markatos A, Yamamoto M, Tanaka H, Ciliberto G, Rodan GA, Costantini F. Interleukin-6 deficient mice are protected from bone loss caused by estrogen depletion. EMBO J 13: 1189–1196, 1994 [DOI] [PMC free article] [PubMed] [Google Scholar]
- 36.Prior JC. FSH and bone: important physiology or not? Trends Mol Med 13: 1–3, 2006 [DOI] [PubMed] [Google Scholar]
- 37.Prior JC. Perimenopause: the complex endocrinology of the menopausal transition. Endocr Rev 19: 397–428, 1998 [DOI] [PubMed] [Google Scholar]
- 38.Recker R, Lappe J, Davies K, Heaney R. Characterization of perimenopausal bone loss: a prospective study. J Bone Miner Res 15: 1965–1973, 2000 [DOI] [PubMed] [Google Scholar]
- 39.Richards JS, Ireland JJ, Rao MC, Bernath GA, Midgley ARJ, Reichert LEJ. Ovarian follicular development in the rat: Hormonal receptor regulation by estradiol, follicle stimulating hormone and luteinizing hormone. Endocrinology 99: 1562–1570, 1976 [DOI] [PubMed] [Google Scholar]
- 40.Santoro N, Brown JR, Adel T, Skurnick JH. Characterization of reproductive hormonal dynamics in the perimenopause. J Clin Endo Metab 81: 1495–1501, 1996 [DOI] [PubMed] [Google Scholar]
- 41.Slemenda C, Hui SL, Longcope C, Johnston CC. Sex steroids and bone mass. A study about the time of menopause. J Clin Invest 80: 1261–1269, 1987 [DOI] [PMC free article] [PubMed] [Google Scholar]
- 42.Sowers MF, Jannausch M, McConnell D, Little R, Greendale GA, Finkelstein JS, Neer RM, Johnston J, Ettinger B. Hormone predictors of bone mineral density changes during the menopausal transition. J Clin Endo Metab 91: 1261–1267, 2006 [DOI] [PubMed] [Google Scholar]
- 43.Sowers MF, Zheng H, McConnell D, Nan B, Harlow S, Randolph Jr JF. Follicle stimulating hormone and its rate of change in defining menopause transition stages. J Clin Endo Metab 93: 3958–3964, 2008 [DOI] [PMC free article] [PubMed] [Google Scholar]
- 44.Sowers MR, Finkelstein JS, Ettinger B, Bondarenko I, Neer RM, Cauley JA, Sherman S, Greendale GA. The association of endogenous hormone concentrations and bone mineral density measures in pre- and perimenopausal women of four ethnic groups: SWAN. Osteoporos Int 14: 44–52, 2003 [DOI] [PubMed] [Google Scholar]
- 45.Sun L, Peng Y, Sharrow AC, Iqbal J, Zhang Z, Papachristou DJ, Zaidi S, Zhu LL, Yaroslavskiy Zhou H, Zallone A, Sairam MR, Kumar TR, Bo W, Braun J, Cardoso-Landa L, Schaffler MB, Moonga BS, Blair HC, Zaidi M. FSH directly regulates bone mass. Cell 125: 247–260, 2006 [DOI] [PubMed] [Google Scholar]
- 46.Thomas T, Burguera B, Melton IIILJ, Atkinson EJ, O'Fallon WM, Riggs BL, Khosla S. Role of serum leptin, insulin, and estrogen levels as potential mediators of the relationship between fat mass and bone mineral density in men versus women. Bone 29: 114–120, 2001 [DOI] [PubMed] [Google Scholar]
- 47.Thomas T, Gori F, Khosla S, Jensen MD, Burguera B, Riggs BL. Leptin acts on human marrow stromal cells to enhance differentiation to osteoblasts and to inhibit differentiation to adipocytes. Endocrinology 140: 1630–1638, 1999 [DOI] [PubMed] [Google Scholar]
- 48.Vihko KK, Kujansuu E, Morsky P, Huhtaniemi I, Punnonen R. Gonadotropins and gonadotropin receptors during the perimenopause. Eur J Endocrinol 134: 357–361, 1996 [DOI] [PubMed] [Google Scholar]
- 49.Zaidi S, Zhu LL, Mali R, Iqbal J, Yang G, Zaidi M, Sun L. Regulation of FSH receptor promoter activation in the osteoclast. Biochem Biophys Res Commun 361: 910–915, 2007 [DOI] [PubMed] [Google Scholar]


