Abstract
To assess the reproducibility of quantitative measurements of cartilage morphology and trabecular bone structure of the knee at 7 T, high-resolution sagittal spoiled gradient-echo images and high-resolution axial fully refocused steady-state free-precession (SSFP) images from six healthy volunteers were acquired with a 7-T scanner. The subjects were repositioned between repeated scans to test the reproducibility of the measurements. The reproducibility of each measurement was evaluated using the coefficient(s) of variation (CV). The computed CV were 1.13% and 1.55% for cartilage thickness and cartilage volume, respectively, and were 2.86%, 1.07%, 2.27% and 3.30% for apparent bone volume over total volume fraction (app.BV/TV), apparent trabecular number (app.Tb.N), apparent trabecular separation (app.Tb.Sp) and apparent trabecular thickness (app.Tb.Th), respectively. The results demonstrate that quantitative assessment of cartilage morphology and trabecular bone structure is reproducible at 7 T and motivates future musculoskeletal applications seeking the high-field strength’s superior signal-to-noise ratio.
Keywords: Magnetic resonance imaging, 7 T, Cartilage morphology, Trabecular bone structure, Reproducibility
1. Introduction
The high signal-to-noise ratio (SNR) of ultra-high-field magnetic resonance imaging (MRI) has great potential for improving soft-tissue contrast in musculoskeletal imaging. Some preliminary studies have examined SNR, contrast-to-noise ratio (CNR) and relaxation times in knee joints at ultra-high fields [1–3]. However, to our knowledge, no studies of quantitative musculoskeletal imaging have been published. A previous study has demonstrated that sharper delineation between femoral and tibial cartilages was observed at 7 T compared to 3 T [3]. Global increases of 45% in SNR and of 55% in CNR for cartilage assessment, and of 60% in SNR for trabecular bone were reported in the study after comparing the images acquired at 7 T with those acquired at 3 T. Despite the superior SNR, ultra-high-field MRI faces several challenges, such as increased chemical shift differences, radiofrequency (RF) power deposition, and main (B0) and RF (B1) field inhomogeneities.
The purpose of this study is to examine the reproducibility of quantitative measurements of knee cartilage morphology and trabecular bone structure at ultra-high fields. Quantitative musculoskeletal imaging has been employed at standard field strengths to assist in the clinical diagnosis of diseases such as osteoarthritis (OA) and osteoporosis (OP), to monitor the progression of diseases and to evaluate response to treatment with structure/disease-modifying drugs [4–7]. The measurement of cartilage morphology may provide a biomarker for evaluating the long-term progression of OA. The measurement of trabecular bone structure with MRI offers a quantitative assessment of OP progression and therapeutic monitoring in patient studies [8]. In addition, the superior SNR of ultra-high-field strengths is expected to improve image quality and to assist in evaluating cross-correlations between cartilage and bone changes during the progression of OA [9,10].
2. Methods
Imaging was performed on a 7-T GE Excite MR scanner (General Electric Healthcare, Milwaukee, WI) with a two-channel transmit/receive quadrature coil (Nova Medical, Inc., Wilmington, MA). All subjects gave informed consent, in accordance with Institutional Review Board guidelines at our medical center.
2.1. B0 field mapping
A series of two-dimensional (2D) gradient-recalled echo (GRE) scans of one subject was acquired to evaluate the homogeneity of the B0 field. The subject received two axial scans and two sagittal scans, with echo times differing by 1 ms. All GRE scans were acquired with the following: field of view (FOV)=16 cm, slice thickness=5.6 mm, acquisition matrix=256×256, time of echo TE=5 or 6 ms, time of repetition TR=30 ms.
2.2. Data acquisition
Six (four male and two female) healthy volunteers (age range, 30–49 years) were recruited for the quantification study. Additionally, one subject was scanned at both 3 T (GE Signa MR scanner) and 7 T to evaluate the effect of field strength on SNR and CNR. A quadrature receiver coil (Pfizer, Inc., New York, NY) was used for the 3-T scan.
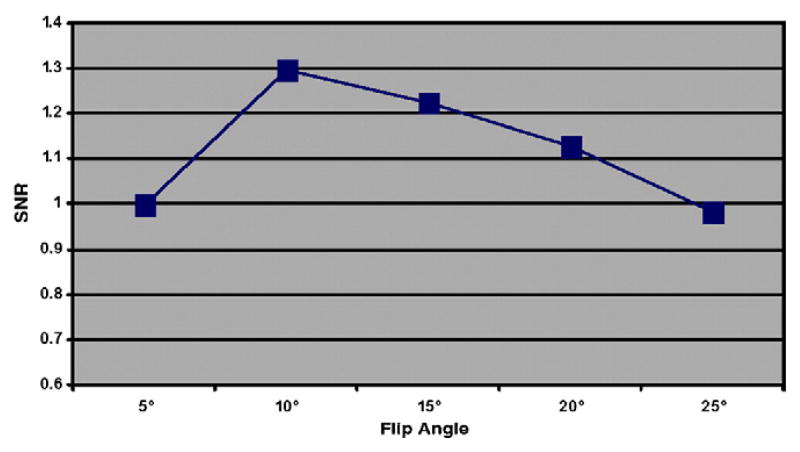
A sagittal three-dimensional (3D) fat-suppressed high-resolution spoiled gradient-echo (SPGR) image was acquired to analyze cartilage morphology, and a 3D fully refocused steady-state free-precession (SSFP; GE Healthcare Fiesta-c sequence) image was acquired to quantify the trabecular bone structure parameters. Sequence parameters are shown in Table 1. To compensate for the increased chemical shift that is presented at ultra-high fields, data sampling bandwidth was increased from 31 kHz (which is routinely used in lower-field clinical scan protocols) to 62 kHz for the SPGR sequence, and from 31 to 41 kHz for the Fiesta-c sequence. The flip angle of Fiesta-c was also reduced from 60° (as regularly used in lower-field clinical scan protocols) to 40° at 7 T. This was performed to accommodate the changes in T1 and T2 at high-field strengths for optimized SNR. TR was chosen to be 17 ms for the SPGR sequence due to the consideration of specific absorption rate constraints, adequate SNR and minimal imaging time. Optimization of the flip angle to achieve a high SNR in the cartilage with the SPGR sequence is shown in Fig. 1. The maximum SNR was achieved at a 10° flip angle. Sagittal SPGR images were acquired to cover the whole tibio-femoral joint. Axial Fiesta-c images were acquired to cover the distal femur. All subjects were repositioned, and all scans were repeated to examine the measurements’ reproducibility.
Table 1.
Comparison of the sequence parameters employed at 3 and 7 T for cartilage and trabecular bone measurements and their corresponding SNR and CNR
| Sequence name | FOV (cm) | Matrix/NEX | TR/TE (ms) | Number of sections | Slice thickness | Imaging time | Flip angle (°) | Bandwidth (kHz) | SNR | CNR |
|---|---|---|---|---|---|---|---|---|---|---|
| SPGR 3 T | 14 | 512×512/1 | 15.1/3.5 | 94 | 1 | 12 min 6 s | 12 | 31 | 1 | 1 |
| SPGR 7 T | 14 | 512×512/1 | 17/3.72 | 94 | 1 | 13 min 36 s | 10 | 62 | 1.52 | 1.63 |
| Fiesta-c 3 T | 10 | 512×384/2 | 11.1/3.7 | 50 | 1 | 10 min 40 s | 60 | 31 | 1 | |
| Fiesta-c 7 T | 10 | 512×384/2 | 11.3/2.45 | 50 | 1 | 10 min 40 s | 40 | 41 | 1.59 |
NEX, number of excitations.
The SNR and CNR at 3 T were normalized to 1.
Fig. 1.
3D SPGR sequence optimization. Experimental results indicated that a flip angle of 10°, compared with other flip angles, provided maximum SNR. All SNRs shown here were normalized to the SNR achieved at a flip angle of 5°.
2.3. Data processing
Data postprocessing was performed on a Sun workstation (Sun Microsystems, Palo Alto, CA).
The B0 field was mapped by calculating the phase difference between the two GRE scans and dividing the 1-ms phase evolution time. The resulting images were unwrapped using PRELUDE [11].
An in-house program [12] programmed in MATLAB (Version 7; The MathWorks, Inc., Natick, MA) was employed for cartilage segmentation, as well as for the computation of cartilage thickness and volume. Five different compartments were defined for cartilage segmentation: lateral femoral condyle/medial femoral condyle (LFC/MFC), lateral tibia/medial tibia (LT/MT) and patella (P). The mean cartilage thickness and the total cartilage volume over all segmented cartilages were also calculated.
Analysis of trabecular bone structure parameters was performed using an in-house-developed image analysis software [13] programmed in IDL (RSI, Boulder, CO) and C programming languages. Three different compartments were defined for bone analysis: femur (FM), LFC and MFC. Structural bone parameters combining all three bone compartments were also reported. The 2D trabecular structural parameters apparent bone volume over total volume fraction (app.BV/TV), apparent trabecular number (app.Tb.N), apparent trabecular separation (app.Tb.Sp) and apparent trabecular thickness (app.Tb.Th) were computed using a previously described method [14].
The coefficient(s) of variation (CV) was employed to evaluate measurement reproducibility, as described by Glüer et al. [15]: If x̄j and S.D.j represent the mean and standard deviation of repeated measurements on a given subject j, respectively, the standard deviation S.D. of m subjects is computed as the root-mean-square average of S.D.j. The CV is given by
| (1) |
3. Results
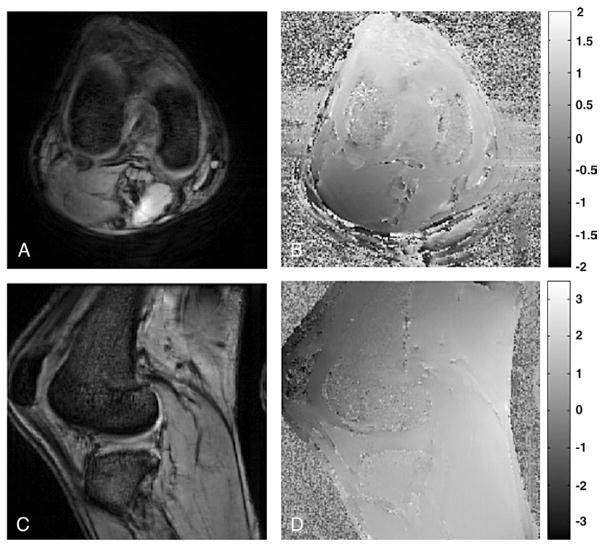
The results of B0 field homogeneity measurements made on a human knee are shown in Fig. 2. The field has a gentle 0.89-Hz/cm gradient from the back to the front of the knee. Intravoxel dephasing due to this gradient will decrease the signal by <1% and is therefore not expected to affect cartilage or trabecular bone quantification. The gradient may, however, affect the SSFP resonance offset angle and introduce a gentle intervoxel gradient in the SSFP signal. Over the entire imaging volume, the field range and standard deviations were 8.35 and 1.19 ppm, respectively. Over the cartilage and trabecular bone, however, the field was much more homogeneous; the field range and standard deviations were, respectively, only 0.55 and 0.1 ppm in the region of the cartilage, and 1.49 and 0.17 ppm in the trabecular bone. Quantitative assessment of the cartilage is not expected to be affected by the B0 field inhomogeneity, although the high local field gradients in the trabecular bone (maximum, 10.97 Hz/cm) may cause signal dropout adjacent to the bone.
Fig. 2.
B0 field homogeneity measurement on human knee joint. (A and C) Axial and sagittal magnitude images. (B and D) The corresponding B0 field maps.
The improved cartilage delineation at 7 T compared to that at 3 T is shown in Fig. 3. Calculation indicated that the mean increase for cartilage in SNR and CNR (between cartilage and joint fluid) was 52% and 63%, respectively. The SNR increase for trabecular bone was 59% (Table 1). Fig. 4A presents a typical sagittal SPGR image acquired from a healthy volunteer at 7 T. The segmented cartilage in this image slice is displayed in three different regions of interest: LFC, LT and P. The final composite 3D cartilage thickness map of a right knee joint is shown in Fig. 4B. The color bar indicates cartilage thickness. Fig. 5A shows a graphical representation of segmented bone compartments (FM, LFC and MFC) from a coronal MR image. Typical axial Fiesta-c bone images are shown in Fig. 5B and C, with LFC, MFC and FM as indicated.
Fig. 3.
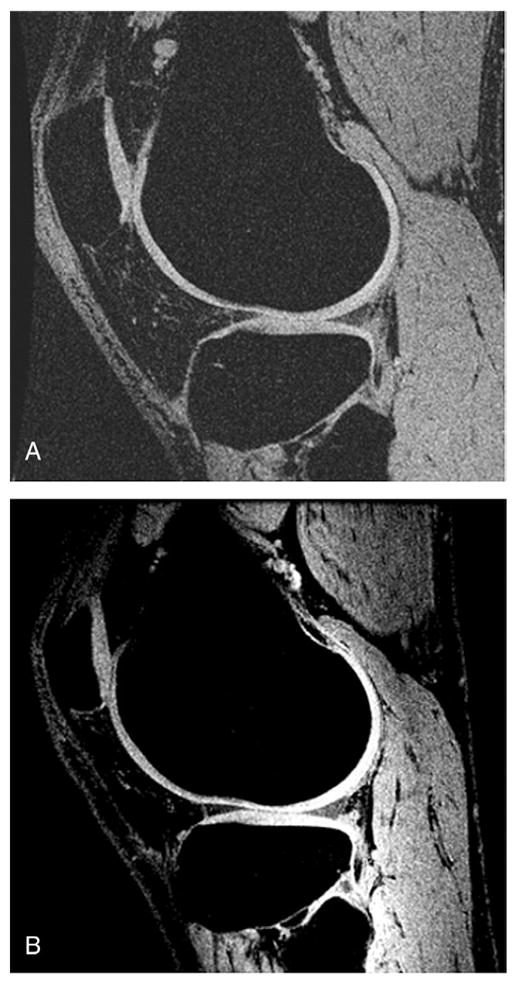
Representative SPGR images acquired with similar imaging protocols at 3 T (A) and 7 T (B). A sharper delineation of knee cartilage can be observed at the 7-T image compared to the 3-T image. Mean increases of 52% and 63% in the SNR and CNR of cartilage, respectively, were found in 3-T images and 7-T images.
Fig. 4.
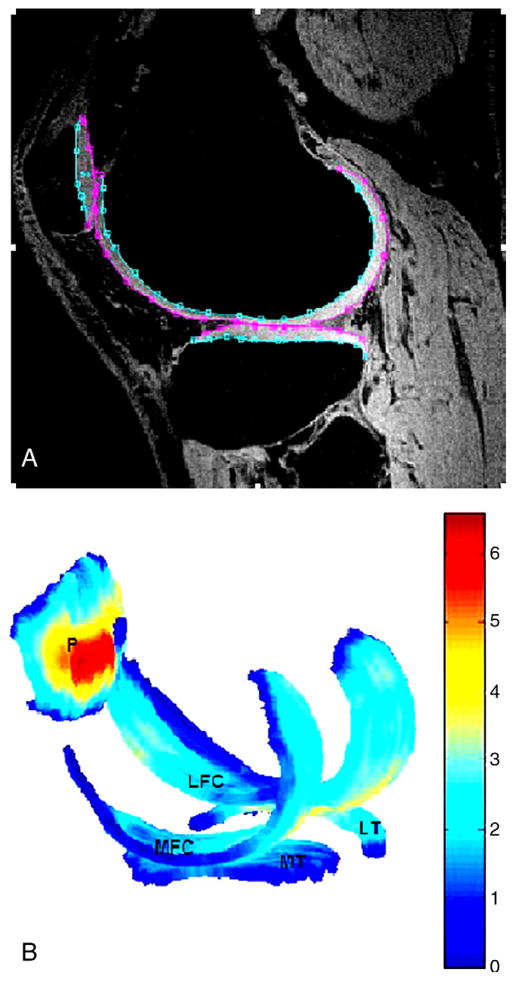
(A) A typical SPGR image acquired from a healthy volunteer at 7 T, with segmented LFC, LT and P shown. (B) The corresponding computed cartilage map (composed of LFC/MFC, LT/MT and P). The color bar indicates thickness (mm), with dark blue corresponding to the thinnest cartilage and with dark red corresponding to the thickest cartilage.
Fig. 5.
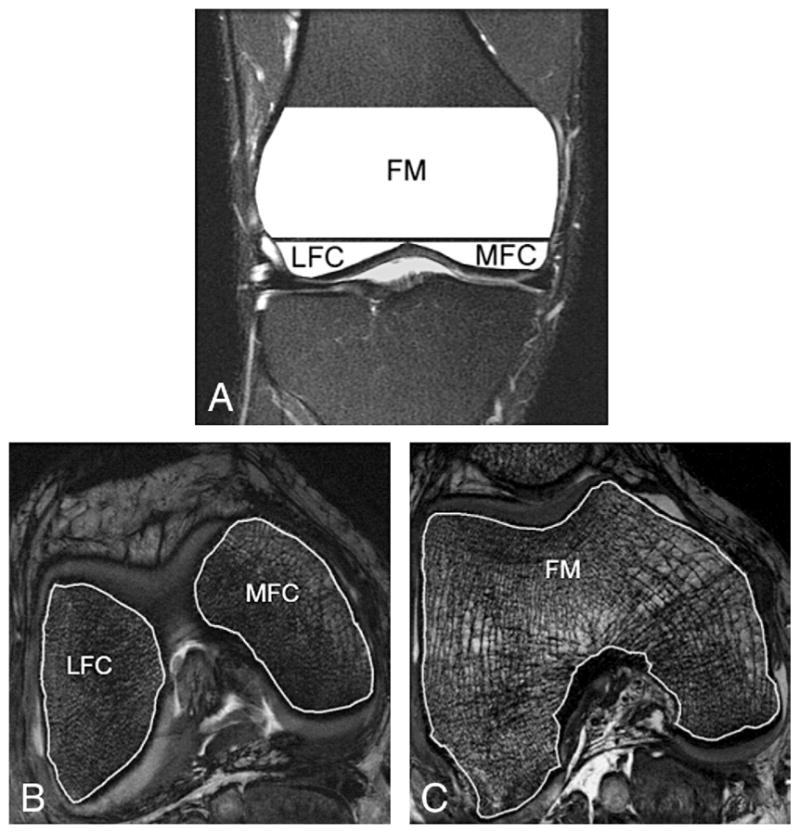
(A) A graphical representation of the segmented bone compartments (FM, LFC and MFC are shown) from a coronal MR image. A typical axial Fiesta-c image acquired at 7 T from a healthy volunteer with segmented LFC, MFC (B) and FM (C) is shown.
Table 2 displays the measured mean cartilage thickness and volume for each component of the knee at 7 T. The CV for the mean thickness and volume of the total knee cartilage are 1.13% and 1.55%, respectively, demonstrating excellent reproducibility. The CV for individual knee cartilage regions varied between 1.45% and 3.48% for mean thickness, and between 1.72% and 4.48% for volume.
Table 2.
Measured mean cartilage thickness and volume (expressed as mean±S.D. and assessed in each knee cartilage compartment)
| LFC | MFC | LT | MT | P | ALL | |
|---|---|---|---|---|---|---|
| Cartilage thickness (mm) | 1.84±0.27 | 2.21±0.23 | 1.84±0.24 | 1.61±0.18 | 2.68±0.45 | 2.04±0.26 |
| Cartilage volume (mm3) | 5634±2282 | 2347±596 | 3360±854 | 1497±475 | 3976±1310 | 16814±5220 |
The cartilage thickness for “ALL” was computed as the mean cartilage thickness in all cartilage compartments, and the cartilage volume for “ALL” was computed as the sum of the cartilage volumes in all cartilage compartments.
The measured trabecular bone structure parameters are shown in Table 3. The trabecular structure parameters showed excellent reproducibility as well. This reproducibility was 2.86% for app.BV/TV, 1.07% for app.Tb.N, 2.27% for app.Tb.Sp and 3.30% for app.Tb.Th in all analyzed bone compartments. Specifically, the CV ranged from 4.12% to 5.00% for app.BV/TV, from 2.55% to 4.15% for app.Tb.N, from 4.41% to 5.61% for app.Tb.Sp and from 4.24% to 5.57% for app.Tb.Th.
Table 3.
Measured trabecular bone parameters (expressed as mean±S.D. and assessed in each bone compartment)
| FM | LFC | MFC | ALL | |
|---|---|---|---|---|
| app.BV/TV (%) | 0.44±0.03 | 0.44±0.03 | 0.45±0.03 | 0.45±0.02 |
| app.Tb.N (mm−1) | 1.24±0.04 | 1.45±0.05 | 1.31±0.05 | 1.33±0.02 |
| app.Tb.Sp (mm) | 0.45±0.03 | 0.39±0.02 | 0.42±0.04 | 0.42±0.02 |
| app.Tb.Th (mm) | 0.36±0.02 | 0.31±0.02 | 0.34±0.03 | 0.34±0.02 |
The structural bone parameters for “ALL” were computed by combining all bone compartments.
4. Discussion
With the higher SNR of ultra-high-field scanners, MRI has the potential to yield higher spatial resolution images. This may lead to a significantly more accurate diagnosis of pathologies within the musculoskeletal system. A comparison of 3-T and 7-T scans in our study demonstrated significant SNR and CNR increases, in agreement with previous studies [1–3]. This study examined the reproducibility of quantitative measurements of cartilage morphology and trabecular bone structure, and indicated comparable reproducibility with those reported at lower field strengths [13,16] for both measurements. A longitudinal patient study is still required to examine the advantages of quantitative musculoskeletal imaging at ultra-high fields.
At present, the applications of ultra-high-field MRI on the musculoskeletal system are still limited due to multiple challenges associated with imaging at ultra-high fields, such as increased chemical shift differences, increased tissue T1 and RF power deposition limitations. The increased B0 and B1 field inhomogeneities are particularly concerning for musculoskeletal quantification. The susceptibility effects of air–tissue interfaces and materials such as trabecular bone are expected to scale with the field and to distort the B0 field. Our in vivo B0 field mapping examined field homogeneity in the knee, although one of the limitations of this paper is that we did not include a B1 map for the coil under consideration. While future analysis of the effect of B0 and B1 inhomogeneities across different field strengths and coil configurations is clearly warranted, the reproducibility of the quantitative measurements in this study indicates that neither B0 nor B1 field inhomogeneity significantly affected image quality.
The mean cartilage thickness and the mean cartilage volume of the knee compartments across the subjects measured at 7 T were 2.04±0.26 mm and 3363±732 mm3, respectively. These values are in the same range as those reported previously at 3 T with similar imaging protocols [17] (1.88±0.45 mm and 3417±1509 mm3 for the mean cartilage thickness and the mean cartilage volume, respectively). For trabecular bone structure measurement, Beuf et al. [9] reported an app.BV/TV (%) of 0.33, an app.Tb.N (mm−1) of 1.38, an app.Tb.Sp (mm) of 0.48 and an app.Tb. Th (mm) of 0.24 in the femur at 1.5 T. The higher BV/TV and the larger Tb.Th found in our study may have resulted from the broadening of the trabecular bone signal void due to scaling of the susceptibility effects of the trabecular bone with field strength. At 1.5 T, the 10.97-Hz/cm field gradient would be only 2.35 Hz/cm and would cause a 1% (instead of 20%) signal dropout from intravoxel dephasing.
In theory, several factors, including inaccurate delineation of cartilage due to poor tissue contrast, partial-volume effect due to insufficient in-plane resolution and inaccurate alignment of imaging subjects, affect reproducibility [18]. In our study, both flip angle and TR were optimized to improve tissue contrast. All images were acquired at high resolution (a matrix of 512×512 was used for cartilage measurements, and a matrix of 512×384 was used for trabecular bone structure measurements) to reduce partial-volume effect. The precision errors of repeated measurements of cartilage morphology with similar imaging parameter settings (acquisition matrix=512×512, slice thickness=1 mm) have been evaluated previously at 3 T by Eckstein et al. [16]. In their report, the CV ranged between 1.7% and 2.5% for cartilage volume measurements, and between 1.8% and 2.3% for mean cartilage thickness measurements. Our results were found within the same range as theirs. The reproducibility assessment of trabecular bone structure has been previously measured as 2.20% for app.BV/TV, 2.20% for app.Tb.N, 3.20% for app.Tb.Sp and 2.90% for app.Tb.Th [13] at 1.5 T for wrist scans, similar to what we found at 7 T for knee scans.
Previous research has reported a trend of decreasing mean values for trabecular bone structure parameters such as app. BV/TV, app.Tb.N and app.Tb.Th, and of increasing app.Tb. Sp in the femur, lateral femoral condyle and medial femoral condyle in OA patients during a 2-year longitudinal study [10]. This implies that there might be some relationship between cartilage and trabecular bone in OA patients, thus requiring further investigation. The protocol employed in this study could be used for this purpose in the future, since no differences in reproducibility errors between OA patients and control subjects were observed [16,19].
Some other MRI techniques, including T2 quantification [20], T1 rho quantification [21], delayed gadolinium-enhanced MRI of cartilage [22], diffusion-weighted images [23] and sodium imaging [24], are available for the study of cartilage disease in OA. Instead of detecting OA at late stages, some of these techniques can reflect changes in the biochemical composition of cartilage at early OA stages. However, most of these techniques require additional efforts such as software or hardware implementation. Some of the sequences need a 180° inversion pulse, which is hard to achieve with B1 field homogeneities at ultra-high fields. Some of the sequences demand a heavy-duty cycle and could suffer from RF power deposition limitations at 7 T. Such techniques are under development for 7-T applications. Accordingly, the reproducibility of these nonmorphological measurements still needs to be investigated.
In summary, our study showed that excellent reproducibility of cartilage morphology and trabecular bone structure measurements can be achieved at ultra-high fields such as 7 T. With further development, it might be possible to employ quantitative measurements of the musculoskeletal system for the clinical diagnosis of diseases in OA/OP, as well as for clinical assessment of disease progression and therapeutic response in longitudinal drug trials.
Acknowledgments
We thank Dana Carpenter for providing coronal bone compartment MR images. This study was supported by UC Discovery grant ITL bio-04-10148.
References
- 1.Pakin SK, Cavalcanti C, La Rocca R, Schweitzer ME, Regatte RR. Ultra-high-field MRI of knee joint at 7.0 T: preliminary experience. Acad Radiol. 2006;13:1135–42. doi: 10.1016/j.acra.2006.06.007. [DOI] [PubMed] [Google Scholar]
- 2.Regatte RR, Schweitzer ME. Ultra-high-field MRI of the musculoskeletal system at 7.0 T. J Magn Reson Imaging. 2007;25:262–9. doi: 10.1002/jmri.20814. [DOI] [PubMed] [Google Scholar]
- 3.Banerjee S. In vivo high resolution imaging of the knee at 7-T potential for MRI of osteoarthritis. Proceedings of the International Society for Magnetic Resonance in Medicine, 15th Scientific Meeting; Berlin. 2007. [Abstract 2620] [Google Scholar]
- 4.Disler DG, McCauley TR, Wirth CR, Fuchs MD. Detection of knee hyaline cartilage defects using fat-suppressed three-dimensional spoiled gradient-echo MR imaging: comparison with standard MR imaging and correlation with arthroscopy. AJR Am J Roentgenol. 1995;165:377–82. doi: 10.2214/ajr.165.2.7618561. [DOI] [PubMed] [Google Scholar]
- 5.Wluka AE, Stuckey S, Snaddon J, Cicuttini FM. The determinants of change in tibial cartilage volume in osteoarthritic knees. Arthritis Rheum. 2002;46:2065–72. doi: 10.1002/art.10460. [DOI] [PubMed] [Google Scholar]
- 6.Benito M, Vasilic B, Wehrli FW, Bunker B, Wald M, Gomberg B, et al. Effect of testosterone replacement on bone architecture in hypogonadal men. J Bone Miner Res. 2005;20:1785–91. doi: 10.1359/JBMR.050606. [DOI] [PubMed] [Google Scholar]
- 7.Chesnut CH, III, Majumdar S, Newitt DC, Shields A, Van Pelt J, Laschansky E, et al. Effects of salmon calcitonin on trabecular microarchitecture as determined by magnetic resonance imaging: results from the QUEST study. J Bone Miner Res. 2005;20:1548–61. doi: 10.1359/JBMR.050411. [DOI] [PMC free article] [PubMed] [Google Scholar]
- 8.Wehrli FW, Song HK, Saha PK, Wright AC. Quantitative MRI for the assessment of bone structure and function. NMR Biomed. 2006;19:731–64. doi: 10.1002/nbm.1066. [DOI] [PubMed] [Google Scholar]
- 9.Beuf O, Ghosh S, Newitt DC, Link TM, Steinbach L, Ries M, et al. Magnetic resonance imaging of normal and osteoarthritic trabecular bone structure in the human knee. Arthritis Rheum. 2002;46:385–93. doi: 10.1002/art.10108. [DOI] [PubMed] [Google Scholar]
- 10.Blumenkrantz G, Lindsey CT, Dunn TC, Jin H, Ries MD, Link TM, et al. A two-year longitudinal study of the interrelationship between trabecular bone and articular cartilage in the osteoarthritic knee. Osteoarthritis Cartilage. 2004;12:997–1005. doi: 10.1016/j.joca.2004.09.001. [DOI] [PubMed] [Google Scholar]
- 11.Jenkinson M. Fast, automated, N-dimensional phase unwrapping algorithm. Magn Reson Med. 2003;49:193–7. doi: 10.1002/mrm.10354. [DOI] [PubMed] [Google Scholar]
- 12.Carballido-Gamio J, Bauer JS, Lee KY, Krause S, Majumdar S. Combined image processing techniques for characterization of MRI cartilage of the knee. Proceedings of the 27th Annual International Conference of the IEEE Engineering in Medicine and Biology Society; Shanghai, China. 2005. pp. 3043–6. [DOI] [PubMed] [Google Scholar]
- 13.Newitt DC, Van Rietbergen B, Majumdar S. Processing and analysis if in vivo high resolution MR images of trabecular bone for longitudinal studies: reproducibility of structural measures and micro-finite element analysis derived mechanical properties. Osteoporos Int. 2002;13:278–87. doi: 10.1007/s001980200027. [DOI] [PubMed] [Google Scholar]
- 14.Majumdar S, Genant HK. Assessment of trabecular structure using high resolution magnetic resonance imaging. Stud Health Technol Inform. 1997;40:81–96. [PubMed] [Google Scholar]
- 15.Glüer CC, Blake G, Lu Y, Blunt BA, Jergas M, Genant HK. Accurate assessment of precision errors: how to measure the reproducibility of bone densitometry techniques. Osteoporos Int. 1995;5:262–70. doi: 10.1007/BF01774016. [DOI] [PubMed] [Google Scholar]
- 16.Eckstein F, Charles HC, Buck Rj, Kraus VB, Bemmers AE, Hudelmaier M, et al. Accuracy and precision of quantitative assessment of cartilage morphology by magnetic resonance imaging at 3.0 T. Arthritis Rheum. 2005;52:3132–6. doi: 10.1002/art.21348. [DOI] [PubMed] [Google Scholar]
- 17.Zuo J, Li X, Banerjee S, Han E, Majumdar S. Parallel imaging of knee cartilage at 3 Tesla. J Magn Reson Imaging. 2007;26:1001–9. doi: 10.1002/jmri.21122. [DOI] [PubMed] [Google Scholar]
- 18.Eckstein F, Westhoff J, Sittek H, Maag KP, Haubner M, Faber S, et al. In vivo reproducibility of three-dimensional cartilage volume and thickness measurements with MR imaging. AJR Am J Roentgenol. 1998;170:593–7. doi: 10.2214/ajr.170.3.9490936. [DOI] [PubMed] [Google Scholar]
- 19.Brem MH, Pauser J, Yoshioka H, Brenning A, Stratmann J, Hennig FF, et al. Longitudinal in vivo reproducibility of cartilage volume and surface in osteoarthritis of the knee. Skeletal Radiol. 2007;36:315–20. doi: 10.1007/s00256-006-0208-z. [DOI] [PubMed] [Google Scholar]
- 20.Xia Y, Farquhar T, Burton-Wuster N, Ray E, Jelinski L. Diffusion and relaxation mapping of cartilage–bone plugs and excised disks using microscopic magnetic resonance imaging. Magn Reson Med. 1994;31:273–82. doi: 10.1002/mrm.1910310306. [DOI] [PubMed] [Google Scholar]
- 21.Duvvuri U, Reddy R, Patel SD, Kaufman JH, Kneeland JB, Leigh JS. T1 rho-relaxation in articular cartilage: effects of enzymatic degradation. Magn Reson Med. 1997;38:863–7. doi: 10.1002/mrm.1910380602. [DOI] [PubMed] [Google Scholar]
- 22.Burstein D, Velyvis J, Scott KT, et al. Protocol issues for delayed GD (DTPA)2−-enhanced MRI (dGEMRIC) for clinical evaluation of articular cartilage. Magn Reson Med. 2001;45:36–41. doi: 10.1002/1522-2594(200101)45:1<36::aid-mrm1006>3.0.co;2-w. [DOI] [PubMed] [Google Scholar]
- 23.Miller KL, Hargreaves BA, Gold GE, Pauly JM. Steady-state diffusion-weighted imaging of in vivo knee cartilage. Magn Reson Med. 2004;51:394–8. doi: 10.1002/mrm.10696. [DOI] [PubMed] [Google Scholar]
- 24.Reddy R, Insko EK, Noyszewski EA, Dandora R, Kneeland JB, Leigh JS. Sodium MRI of human articular cartilage in vivo. Magn Reson Med. 1998;39:697–701. doi: 10.1002/mrm.1910390505. [DOI] [PubMed] [Google Scholar]


