Abstract
Semiconducting nanowires are promising ultrasensitive, label-free sensors for small molecules, DNA, proteins, and cellular function. Nanowire field effect transistors (FETs) function by sensing the charge of a bound molecule; however, solutions of physiologic ionic strength compromise detection of specific binding events due to ionic (Debye) screening. We demonstrate a general solution to this limitation with the development of a hybrid nanoelectronic-enzyme linked immunosorbent assay (ne-ELISA), which combines the power of enzymatic conversion of bound substrate with electronic detection. This novel configuration produces a local enzyme-mediated pH change proportional to bound ligand concentration. We show that nanowire FETs configured as pH sensors can be used for quantitative detection of interleukin-2 (IL-2) in physiologically buffered solution at concentrations as low as 1.6 pg/mL. By successfully bypassing the Debye screening inherent in physiologic fluids, the ne-ELISA promises wide applicability for ligand detection in a range of relevant solutions.
Keywords: nanowire, FET, nanoelectronic, ELISA
1. Introduction
Single-crystal, semiconducting nanowire field effect transistor (FET) devices[1–6] are attractive biosensors due to their exquisite sensitivity to bound charge and potential portable format.[7–10] Nanowire devices configured as solution-phase sensors or ion-sensitive FETs (ISFETs) have been demonstrated as ultrasensitive sensors for small molecules,[11–15] DNA,[16–20] protein,[11, 12, 19, 21–27] and cellular function.[12, 28] However, solutions with physiologic salt concentrations have ionic (Debye) screening lengths of ~0.7 nm, effectively neutralizing the molecular charge of the bound ligand beyond this distance. Thus, detection of such surface-bound ligands requires measurements to be performed in a low salt (1.5 mM) buffer to increase Debye screening lengths.[19]
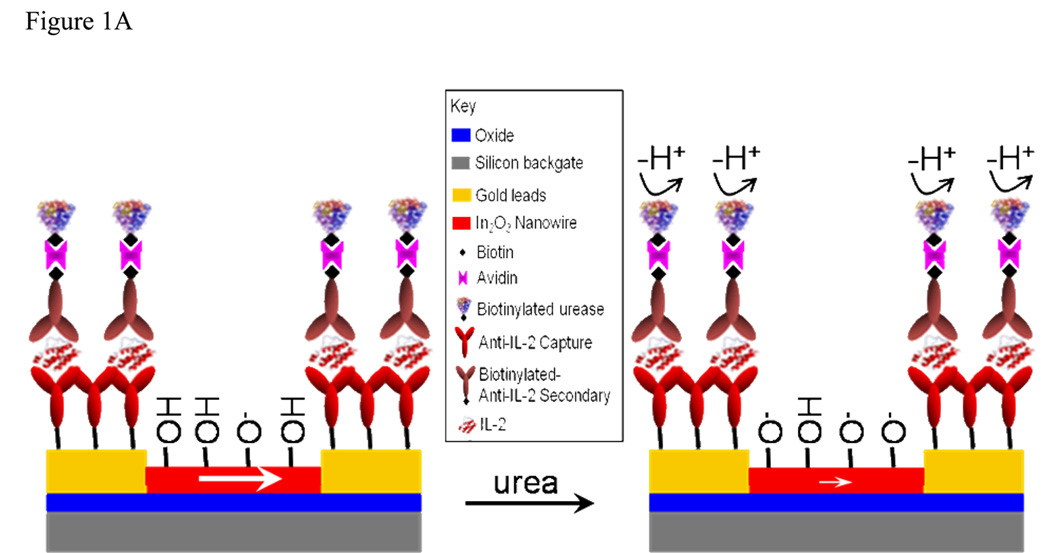
To overcome this limitation we devised a method that affects a solution pH change upon specific ligand binding. Our approach is similar to an enzyme linked immunosrobent assay (ELISA),[29] but correlates protein presence with an enzyme-induced pH increase rather than the traditional colorimetric change (Figure 1A). Because of this similarity, we term our assay a nanoelectronic-ELISA, or ne-ELISA. In our previous work we used unfunctionalized nanowires as sensors to detect changes in the local pH microenvironment resulting from stimulation-induced alterations in cellular metabolism[12, 28] and Wang et al. recently used nanowire-based pH monitors to determine glucose concentrations, demonstrating the utility of nanowire sensors for indirect molecular detection.[15] Increasing pH deprotonates surface hydroxyl groups on the nansensors, resulting in a net decrease in positive gate charge and, in turn, a decrease in channel current for n-type devices.[30] By monitoring the urease-induced pH increase, we calculate the quantity of bound protein in a configuration that eliminates concerns over Debye screening in high-salt buffers[18, 19] and nanowire-specific functionalization schemes[12, 18] in a format that can be adapted for use in a variety of settings from the bench to the clinic.
Figure 1.
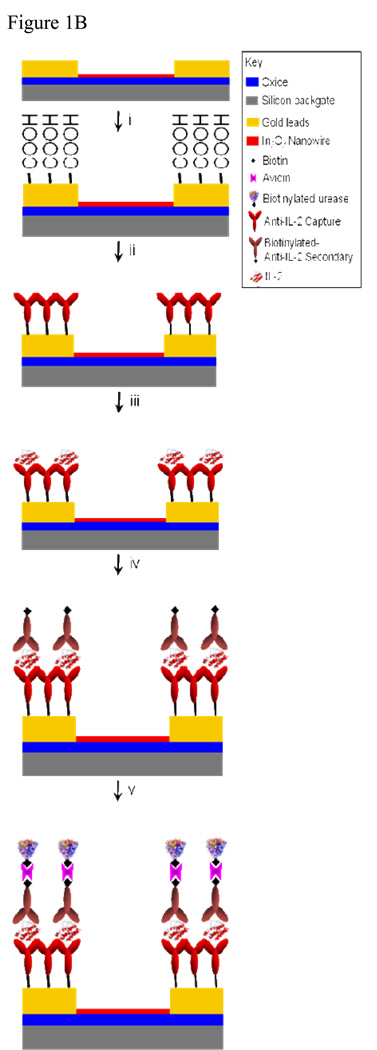
(A) Schematic of the ne-ELISA approach. Before the addition of urea the indium oxide surface is relatively protonated, inducing a relatively large channel current (large white arrow). The addition of urea results in the removal of protons from the solution and, thus, increased deprotonation of the nanowire surface. This, in turn, induces a decrease in channel current (small white arrow). (B) Surface functionalization schematic. The steps are described in the text and detailed in the methods.
2. Results and Discussion
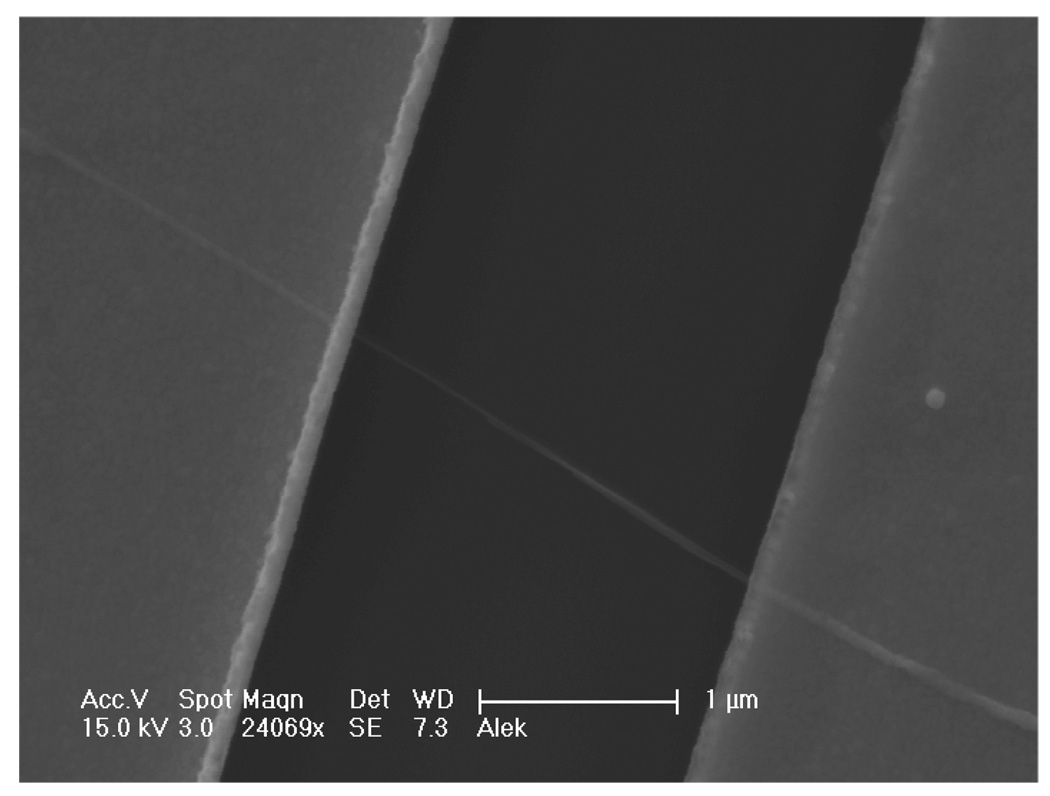
Indium oxide nanowires were chosen because of their previously demonstrated utility as sensors.[23–25] As reported previously, these nanowires were grown by the laser-ablated hot-wall chemical vapor deposition method using a gold catalyst.[31] Devices were fabricated on 2-inch wafers with a global backgate and contacts to the nanowires were defined with a nickel/gold (Ni/Au) stack, as detailed in earlier reports.[2] After preliminary screening, wafers were diced and functionalized as shown in Figure 1B.[32, 33] This scheme solely functionalizes the gold leads[32, 33],thus surface hydroxyl groups on the indium oxide nanowires are maintained and available for protonation and deprotonation,[34, 35] necessary for measuring solution pH. Figure 2 shows a scanning electron micrograph of a representative device, a ~50-nm diameter nanowire between Ni/Au leads.
Figure 2.
Scanning electron micrograph of a representative In2O3 nanowire FET sensor contacted by two parallel Ni/Au leads.
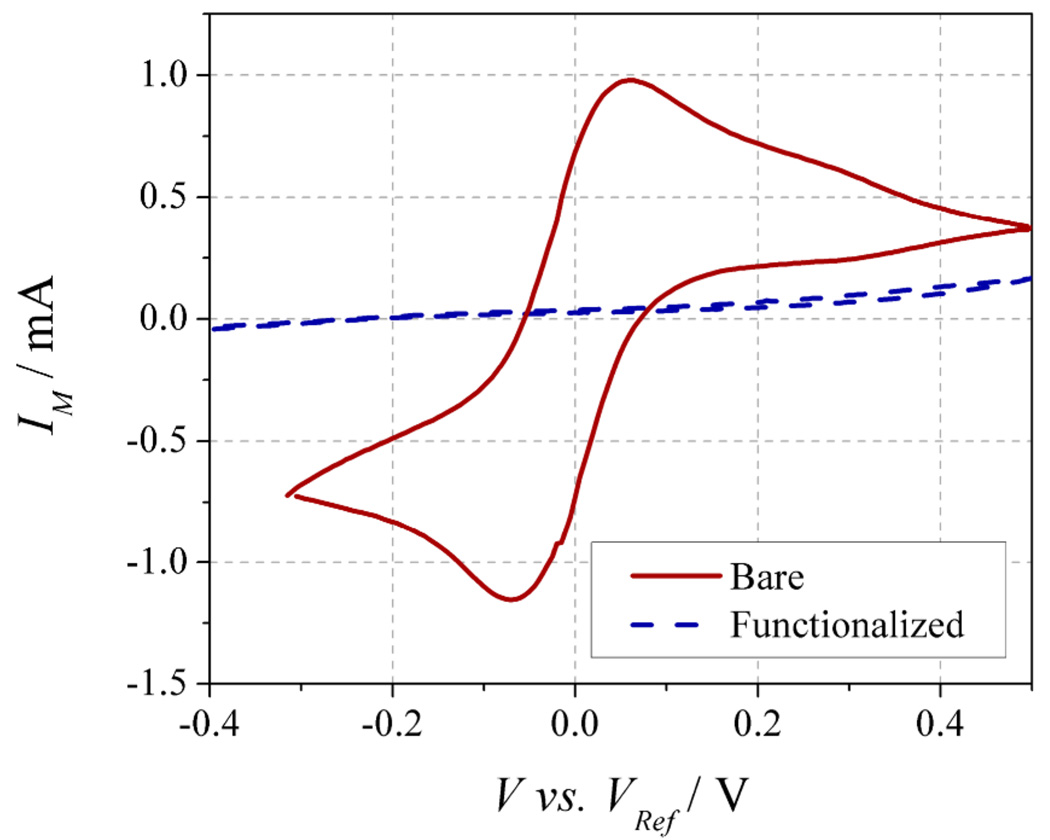
Samples were first treated with ω-mercaptocarboxylic acid (Fig. 1B-i) to confer carboxylic acid functionality to the gold leads through thiol-mediated self-assembled monolayer (SAM) formation, as shown previously.[32, 33] In this work gold leads contacting the nanowires were used for convenience; however, any exposed gold surface in proximity to the sensor could be utilized. The gold surface is passivated by SAM formation, which can be demonstrated using cyclic voltametery.[36] In Figure 3, the redox peaks due to the exposed gold surface are significantly reduced after functionalization, indicating the formation of a functional surface.[36]
Figure 3.
Cyclic voltammogram for an unfunctionalized (bare) and HS-(CH2)n-COOH functionalized device demonstrating passivation of the Au leads. The solution is 50mM Fe2+/Fe3+ in 0.1 M KCl. Five sweeps were performed at 100 mV/s and the fifth is shown for each device.
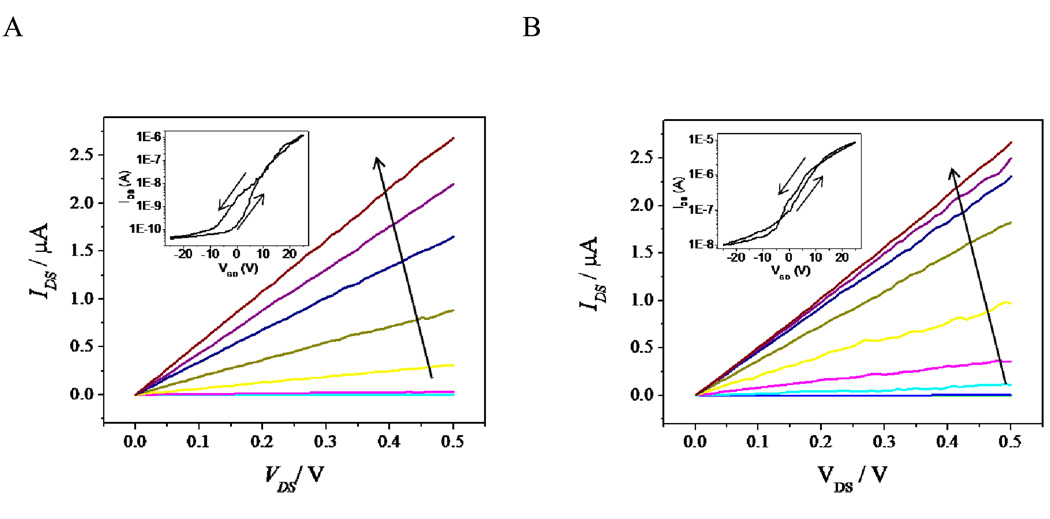
Self-assembled monolayer formation on the gold leads minimally affects the electrical properties of the indium oxide nanowires. This is shown in the pre- and post-functionalization dependence of drain-source current on drain-source voltage [IDS(VDS)] for varying gate-drain voltage (VGD) in Figure 4; the insets show the IDS(VGD) dependence for the VDS = 0.5V operating point used in all sensing experiments. The post-functionalization characteristics show that SAM formation does decrease the threshold voltage (Vt, thus increasing IDS for a set VGD in post-functionalized devices),[30] but has a minimal effect on the transconductance at the operating point used for sensing (VGD = 0V). Additionally, the subthreshold leakage current is also slightly increased, but to a level 100-fold lower than that used for sensing.
Figure 4.
(A) Unfunctionalized and (B) functionalized ω-mercaptocarboxylic acid IDS(VDS) characteristics for VGD increased from −25V to 25V in 5V increments for a single representative device. The arrow shows increasing VGD. The insets show the IDS(VGD) characteristics for VDS = 0.5V for the same device and the arrows indicate the sweep direction. The operating point for sensing measurements was VDS = 0.5V and VGD = 0V.
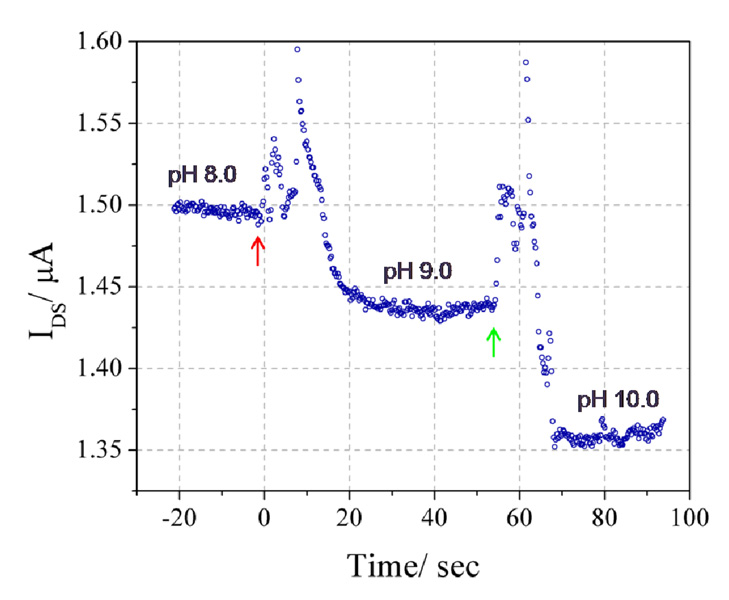
We first characterized the pH sensitivity of the In2O3 nanowires. Conventional indium tin oxide ISFETs have been previously demonstrated to have a linear pH sensitivity between pH 2 and 12,[34, 35] thus we expected undoped In2O3 to exhibit a similar response. The response of a characteristic device to changes in pH, achieved by completely exchanging the sensing reservoir with buffers of different pH (pH = 8.0 initially, and pH = 9.0 and 10.0, at times = 0 and 57.25s, respectively) is shown in Figure 5. The operating point for this device is VDS = 0.5 V and VGD = 0 V. The IDS of the n-type In2O3 nanowires decreases with increasing pH due to the decreasing degree of protonation of the surface hydroxyl groups. Fluid injection induces transients that settle to a steady state within 20s. Devices respond linearly to unit steps in pH in the pH 8–10 range.
Figure 5.
Device response to unit changes in pH. For time < 0, a pH 8.0 buffer was present in the reservoir. At time = 0 (red arrow) this buffer was exchanged with a buffer at pH 9.0 and at time = 57.25 s (green arrow) a second exchange, with a pH 10.0 buffer, was performed. All buffers were 0.01X PBS with 150 mM NaCl and were titrated using NaOH and HCl.
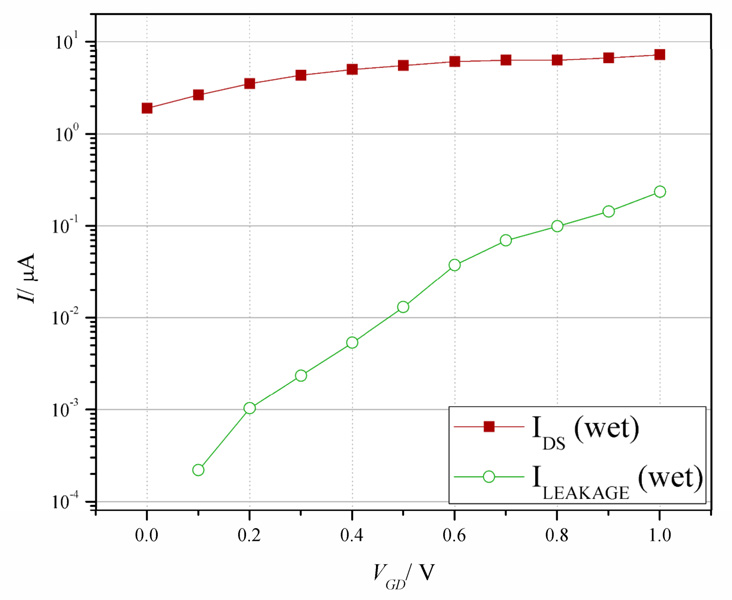
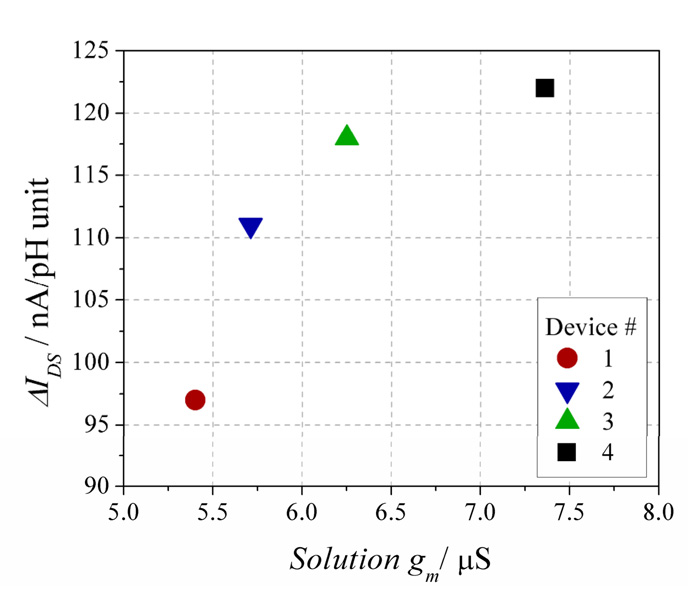
To accurately calibrate device pH response, we measured transconductance (gm) while devices were immersed in solution. This is termed the solution transconductance. To create a reservoir for fluid handling, a poly(dimethylsiloxane) (PDMS) gasket[37] capable of holding ~4 µL was placed over the die (Supp. Fig. 1). Gating of the device was achieved through the solution by submerging gate and reference electrodes into the buffer (the drain and reference electrodes were connected). Figure 6 shows the effect of solution gating a representative device. The device-to-solution leakage current (ILEAKAGE, Figure 6) remains two orders of magnitude below the device current (IDS) for VGD < 0.8 V. Thus, to calculate solution gm, a linear best fit is made to the solution-phase IDS vs. VGD plot for 0 ≤ VGD ≤ 0.8 V. Device sensitivity shows a clear correlation between increasing pH and solution gm, demonstrated in Figure 7 for four different devices. A linear fit to these data yields a trendline that is within 6.7% error of the value of each IDS/ΔpH datapoint. Device sensitivity can be calculated by dividing ΔI/pH unit by the solution gm. The average sensitivity of the four devices shown in Fig. 7 is 18.2 ± 1.2 mV/pH unit, a value below the maximum sensitivity of an ion sensitve FET, which is the ideal Nernst potential of 58 mV/pH unit.[13, 38]
Figure 6.
IDS vs. VGD dependencies for a solution-gated (red) device. Solution gating was performed in the pH 8.0 buffer described in the text. The green dataplot shows the leakage current of the device (ILEAKAGE) during the solution-gating measurement.
Figure 7.
Scatter plot of the ΔIDS/pH unit response vs. the solution transconductance (gm) values for four In2O3 nanowire devices, as indicated in the legend. The R2 value of the linear fit described in the text is 0.75.
To demonstrate the capability of the ne-ELISA for detection of labile macromolecules, we focused on the cytokine interleukin-2 (IL-2), whose presence reports on the activity of the T cell immune response.[39] In the initial step, a capture IL-2 monoclonal antibody was conjugated to the carboxylic groups on the gold leads through its N-terminus(Fig. 1B-ii).[40] This was followed by a wash step that removed unbound capture antibodies (all binding steps described below are followed by washes) and the subsequent placement of a PDMS gasket over the nanowire devices to create the sensing reservoir. Next, a bovine serum albumin solution was used to prevent nonspecific protein adsorption to the chip and reservoir sidewalls, which is a typical blocking step used in conventional colorimeteric ELISA protocols to minimize non-specific binding.[29, 41] This was followed by the addition of IL-2 at varying concentrations (across different devices) to the reservoir (Fig. 1B-iii). A secondary, biotinylated antibody to IL-2 was then introduced (Fig. 1B-iv), followed by the addition of neutravidin, a tetravalent biotin-binding protein,[41] and biotinylated urease (Fig. 1B-v).
The principle of the ne-ELISA is illustrated schematically in Fig. 1B. Urease (here, bound via neutravidin-biotin to the secondary antibody) hydrolyzes free urea in the nanosensor resevoir according to the following reaction:[42, 43]
| (Eq. 1) |
Thus, introduction of urea to the reservoir raises the solution pH, thereby decreasing IDS.[42, 44] Urea is added at a sufficient concentration for the urease to catalyze Eq. 1 (~105 : 1 molar ratio of urea to urease) at its maximum velocity,[40, 45] thus the rate of change in IDS will correlate directly with the quantity of bound urease and, in turn, bound IL-2.
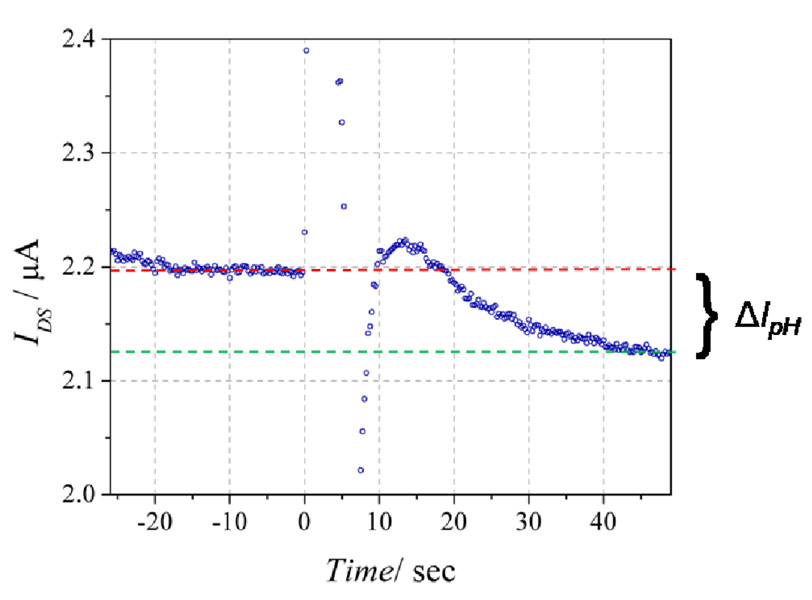
Operation of the ne-ELISA is demonstrated in Figure 8. The reservoir was half filled (2 µL) with the sensing buffer (0.01X phosphate buffered saline, PBS, plus 150 mM sodium chloride) at an initial pH = 8.0.[12, 19, 45] Devices were stabilized for 5–10 min under active measurement conditions (VDS = 0.5V, VGD = 0V). This equilibration time was required for the channel current (IDS) to reach a steady state and is similar to that required for the elimination of initial background current in conventional ISFET glucose sensors.[46, 47] During sensing measurements, 2 µL of a 100 µM urea solution in the same pH 8.0 buffer was manually added with a micropipette and the solution was mixed by micropipette mixing for ~5–10 s. Introduction of this solution occurred at time = 0 in all figures. The response of a device to the presence of 12.5 pg/mL solution of IL-2 is shown in Fig. 8. The decrease in IDS and its continued negative derivative indicated that the addition of the urea solution resulted in a continuous drop in pH throughout the course of the measurement. The decrease in slope over time (similar to a conventional ELISA) is most likely due to a product of both the slowing of enzyme activity with increasing pH[48], and the pH-dependant deviation (decrease) from ideal Nernstian behavior of an oxide surface[49].
Figure 8.
Response [IDS(time)] of the sensor configured for IL-2 detection with 25 pg/mL IL-2 present during the protein-binding step (Fig. 1b-iii). At time = 0 the 100 µM urea solution was added to the pH 8.0 buffer. For this device, ΔIpH = 68.0 nA. The dashed red and green lines show the initial and final IDS levels, respectively.
The key detection parameter is the asymptotic current difference (ΔIpH), calculated by subtracting IDS (time ≥ 40 s) from IDS (time < 0 s), thus the transient current spikes observed during urea addition and subsequent mixing do not interfere with the assay. For the device shown in Fig. 8, ΔIpH = 68.0 nA. To demonstrate that this decrease in IDS was due to urease activity and not to addition of the urea solution, a control device without bound urease was used. Upon introduction of the urea solution, a decrease of 1.8 nA in IDS was observed (ΔIpH = 1.8 nA; Supp. Fig. 2), setting this value as the assay’s lower sensitivity limit.
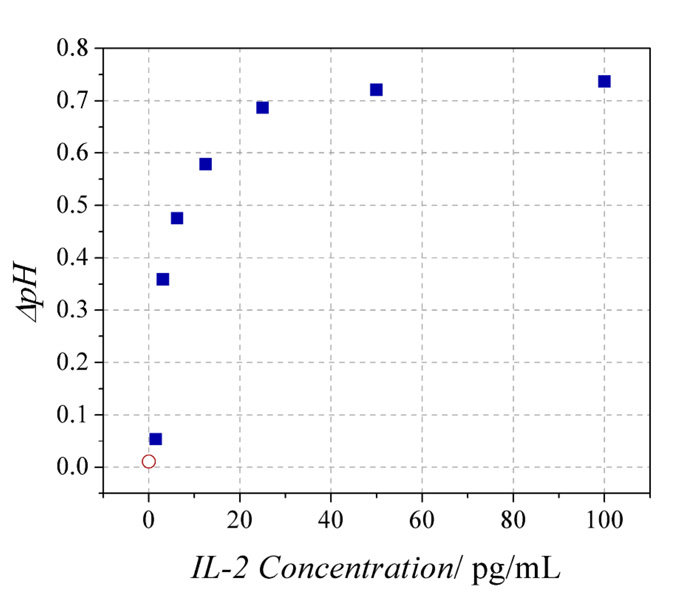
Detection sensitivity of the ne-ELISA was determined by treating devices with decreasing concentrations of IL-2. We measured device responses to six serial dilutions of IL-2, starting with a concentration of 100 pg/mL. The device response to the median concentration, 12.5 pg/mL, is shown in Fig. 8. The responses of the seven devices were converted into ΔpH changes by fitting the solution transconductance values of the devices (determined as described above after sensing measurements were completed) to the trendline determined from the control devices in Fig. 7. Due to the nature of the assay (Fig. 1), each device could be used only once, thus each datapoint is derived from a single device. Reproducibility of device response is not a concern since each device is individually calibrated prior to sensor use. The ΔpH versus IL-2 concentration is plotted in Figure 9 and demonstrates the sensitivity of the assay as low as <1.6 pg/mL and in the range of IL-2 concentrations relevant for T cell stimulation.[50, 51] We note that the ΔpH versus IL-2 concentration calibration curve is non-linear, primarily because pH is a logarithmic scale (−log[H+]) versus linear analyte concentration (and to a lesser degree, the decrease in activity and response with increasing pH).
Figure 9.
Plot of the ΔpH measured by eight devices vs. the IL-2 concentration incubated with each sensor. The red circle derives from a control device to which no IL-2 was added during the protein-binding step (Fig. 1b-iii).
Although the minimum sensitivity shown here, <1.6 pg/mL, is only a factor of 2–4 better than conventional IL-2 ELISAs (USCN-LIFE, RayBio, and eBioscience kits), the power of this approach lies in the number of enzymes required to observe a signal. The results from the 1.6 pg/mL IL-2 sample were obtained from ~8.4 × 10⁴ urease molecules (see Supporting Information), compared with the ~5.7×10⁹ horseradish peroxidase molecules required to observe a colorimetric response in a conventional ELISA (Fig.S3). This four-order-of-magnitude improvement is due to the significantly greater sensitivity with which pH can be measured with nanowires compared to that with which absorbance can be measured optically.
3. Conclusions
Using nanowires we demonstrated a novel method for quantitative protein sensing in solutions with physiologic salt concentrations. This new application utilizes enzymatic activity to overcome the critical Debye screening limiation associated with nanowire-FET sensing.[12, 18, 19, 52] Given the generality of this approach for protein sensing, sensitivity can be practically tuned by adjustment of the surface area available for protein binding or by choice of enzymes catalyzing solution ionic changes. Thus, the utility of this method is broad and durable, since it depends on the interplay between physical scaling of the devices and biochemical properties of the enzymes, in contrast with direct nanowire sensing, where sensitivity is solely dependent on nanowire dimensions. Variations of this technology with different device architectures or enzyme choices could potentially produce even more sensitive indirect nanowire sensors with fast response times operating in buffers with physiologic salt concentrations, which can benefit a wide variety of applications in biology and medicine.
4. Experimental Section
PDMS Gasket Fabrication
The silicone elastomer base and curing agent from the Polydimethylsiloxane (PDMS) kit (Dow Corning) were mixed in a weigh boat in a 10 : 1 (w/w) ratio. The boat was then placed in a dessicator to remove air bubbles (~10 min). The solution was poured onto a microscope slide to a level of ~5 mm above the glass slide and was subsequently baked for two hours at 65°C to harden the PDMS.[37] A metal tube with a 1.5 mm outer diameter (Small Parts, Inc.) and a sharpened end was used to punch holes in the PDMS and a razor blade was used to free the gaskets from the PDMS sheets. These gaskets were pressed onto dies to create the sensor wells (Supplementary Fig. 1S).
Device Fabrication
The In2O3 nanowires used for this study were synthesized on a Si/SiO2 substrate (Silicon Quest International) by the previously-described laser-ablation-assisted chemical vapor deposition method.[31] In order to transfer the nanowires from this growth substrate to the 2-inch Si/SiO2 wafers (degenerately doped; 200 nm oxide; Silicon Quest International) used for device processing, the nanowires were suspended in semiconductor processing grade isopropanol (Brand Nu Labs) by ultrasonic agitation (10–20 sec). Optical lithography was then used to create leads that contacted the randomly dispersed nanowires, as detailed in earlier reports.[2, 53] Briefly, a photoresist bilayer was applied (LOR10A/S1808; MicroChem, Inc.), patterned, and subjected to an oxygen plasma. Wafers were then loaded into an electron-beam (E-beam) evaporator (Denton Vacuum Systems) and deposited with a 50 nm Ni (99.9%, Kurt J. Lesker Co.) / 200 nm Au (99.5%, Kurt J. Lesker Co.) stack. Liftoff was then performed with N-methyl pyrrolidone (VWR Scientific). Note that wafers were patterned with topside contacts to the degenerate Si prior to nanowire dispersion.
Wafers were screened for functional nanowire-field effect transistors (nanowire-FETs) by measuring the dependence of source-drain current (IDS) on source-drain voltage (VDS) for varying gate-source voltage (VGS). A Cascade Microtech automated probe station interfaced with a HP4156B semiconductor parameter analyser controlled by in-house written Lab View and Mathematica codes was used for screening. Leakage currents were <10 pA, well below device IDS levels.
Device Preparation for Cyclic Voltammetry Measurements
The gold coated substrates used in cyclic voltammetry (CV) experiments were prepared by an E-beam evaporation of a 5 nm Cr (99.9%, Kurt J. Lesker Co.) / 70 nm Au (99.99% Cerac, Inc.) stack onto Si wafers (Silicon Quest International) previously cleaned with piranha [1:3 H2O2 : H2SO4 (J.T. Baker Co.) caution: piranha is highly reactive and should be handled with extreme care], acetone (Sigma), methanol (Sigma), and deionized water (DI) and then blown dry with nitrogen. The substrates were then immersed in a solution of ω-mercaptocarboxylic acid (1mM) prepared in deoxygenated, absolute ethanol and left for 12 hrs in the dark in an inert atmosphere.[32] Samples were subsequently washed with ethanol, toluene (Sigma), and isopropanol (Sigma) and blown dry with a directed stream of nitrogen. The CV measurements were performed using a Gamry Femtostat using a Pt counter electrode (Ernest F. Fullham, Inc.) and an Ag/AgCl reference electrode fabricated by the electrodeposition of AgCl on an Ag wire (Ernest F. Fullham, Inc.) from a saturated aqueous solution of NaCl (Sigma).
Biotin-Urease Conjugation
(+)-biotinamidohexanoic acid hydrazide (biotin-LC-hydrazide; 3 mg; Pierce Scientific) was dissolved in DMSO (500 µL, Sigma) and added to a solution of jack bean urease (1 mg/mL; Sigma, Cat. No. 94285) and 1-ethyl-3-[3-dimethylaminopropyl]carbodiimide hydrochloride (EDC; 5 mg/mL; Pierce Scientific) in phosphate buffered saline (PBS, 3mL; Sigma).[41] The reaction proceeded for 1 hr at room temperature with shaking. After the conjugation was complete, the product was isolated by centrifugation using a 50 mL Amicon Ultra (Millipore, Cat. No. UFC905024) centrifugal filter tube with a 50,000 MW cutoff (four 30-minute spins at 3000 rpm at 4°C). The resulting biotin-urease was diluted to 0.1 mg/mL and stored at 4°C.
Device Functionalization
Dies containing working devices were diced from the wafer and were functionalized with ω-mercaptocarboxylic acid as described above. Functionalized devices were first treated with a solution of the capture anti-IL-2 antibody (0.1 mg/mL, BD Biosciences; Cat. No. 555051) in PBS with EDC (0.05 mg) and N-hydroxysulfosuccinimide (sulfo-NHS; 0.025 mg Pierce Scientific) for 1 hr.[41] Washing was performed three times using PBS, followed by the addition of a bovine serum albumin (BSA; 10%, Sigma) solution, after which washing was again performed. Next, IL-2 (Novartis) was added at varying concentrations as described in the text for 1 hr. Periodic pipetting up-and-down was performed to maximize protein binding. After washing three times with PBS, a solution of avidin-conjugated anti-IL-2 detection antibody (0.1 mg/mL) was added for 1 hr. This conjugate was generated by adding equal molar amounts of streptavidin (Pierce Scientific) and biotinylated-anti-IL-2 (BD Biosciences, Cat. No. 555040) and allowing the binding to occur for 15 mins at room temperature in PBS. The conjugates were stored at 4°C and used without further purification. After washing three times with PBS, a solution of biotin-urease (0.1 mg/mL) in PBS was added for 1 hr. Washing was again performed three times with PBS and devices were then washed and stored in the sensing buffer (0.01X PBS + 150 mM NaCl, pH 8.0) directly prior to use. The sensing buffer was titrated to pH 8.0 with solutions of HCl (1N, J.T. Baker) and NaOH (1N, J.T. Baker).
Sensing Measurements
First, a baseline current level was established with 2 µL sensing buffer (see above) n the reservoir. A HP4156B was used for all sensing measurements. The PBS was diluted 100-fold to decrease its buffering capability; otherwise, the urease-catalyzed decrease in the [H+] would be buffered (no pH change would result). Device stabilization under active measurement conditions (VDS = 0.5V; VGD = 0V) required 10–20 mins. After device stabilization, sensing experiments could be performed. The drain-source current was monitored versus time (active measurement conditions were VDS = 0.5V; VGD = 0V): after ~60 s to establish a steady baseline current, 2 µL of a 100 µM solution of urea (Sigma) in sensing buffer was added (at time = 0). The temporal response of sensor channel current (IDS) to the addition of the 100 mM urea sensing solution to the pH 8.0 buffer in the absence of bound urease is shown in Supp. Fig. 2. The average ΔIpH for control devices was 2.5 nA (ΔIpH for the device shown in Supp. Fig. 2 is 3.1 nA). After sensing measurements, devices were solution-gated to determine solution transconductance, required for sensitivity calculations.
Supplementary Material
Acknowledgements
This paper is dedicated in loving memory to Alan Stern. The authors would like to thank J Criscione and D Routenberg for helpful discussions, and K Milnamow for critical reading of the manuscript. This work was partially supported by ARO, NIH RO1 (EB008260), and by CIfAR.
Footnotes
Supporting Information is available on the WWW under the http://www.small-journall.com or from the authors.
Contributor Information
Eric Stern, Department of Biomedical, School of Engineering, Yale University, 15 Prospect St, New Haven, CT 06511, USA.
Aleksandar Vacic, Department of Electrical, School of Engineering, Yale University, 15 Prospect St, New Haven, CT 06511, USA.
Chao Li, Department of Electrical Engineering, University of Southern California, 3737 Watts Way, Los Angeles, CA 90089, USA.
Fumiaki N. Ishikawa, Department of Electrical Engineering, University of Southern California, 3737 Watts Way, Los Angeles, CA 90089, USA
Chongwu Zhou, Department of Electrical Engineering, University of Southern California 3737 Watts Way, Los Angeles, CA 90089, USA
Mark A. Reed, Email: mark.reed@yale.edu, Department of Electrical, School of Engineering, Yale University, 15 Prospect St, New Haven, CT 06511, USA; Department of Applied Physics, School of Engineering, Yale University 15 Prospect St, New Haven, CT 06511, USA.
Tarek M. Fahmy, Email: tarek.fahmy@yale.edu, Department of Biomedical, School of Engineering, Yale University, 15 Prospect St, New Haven, CT 06511, USA; Department of Chemical Engineering, School of Engineering, Yale University, 15 Prospect St, New Haven, CT 06511, USA.
References
- 1.Lu W, Lieber CM. Nature Mate. 2007;6:841–850. doi: 10.1038/nmat2028. [DOI] [PubMed] [Google Scholar]
- 2.Stern E, Cheng G, Klemic JF, Broomfield E, Turner-Evans D, Turner-Evans D, Li C, Zhou C, Reed MA. J Vac Sci Technol B. 2005;24:231–236. [Google Scholar]
- 3.Huang Y, Duan X, Wei Q, Lieber CM. Science. 2001;291:630–633. doi: 10.1126/science.291.5504.630. [DOI] [PubMed] [Google Scholar]
- 4.Ahn J-H, Kim H-S, Lee KJ, Jeon S, Kang SJ, Sun Y, Nuzzo RG, Rogers JA. Science. 2006;314:1754–1757. doi: 10.1126/science.1132394. [DOI] [PubMed] [Google Scholar]
- 5.Englander O, Christensen D, Kim J, Lin L, Morris SJS. Nano Lett. 2005;5:705–708. doi: 10.1021/nl050109a. [DOI] [PubMed] [Google Scholar]
- 6.Goldberger J, Hochbaum AI, Fan R, Yang P. Nano Lett. 2006;6:973–977. [Google Scholar]
- 7.Patolsky F, Lieber CM. "Nanowire nanosensors,". Mater Today. 2005 Apr;:20–28. [Google Scholar]
- 8.Patolsky F, Zheng G, Lieber CM. Anal Chem. 2006;78:4260–4269. doi: 10.1021/ac069419j. [DOI] [PubMed] [Google Scholar]
- 9.Carlen ET, van den Berg A. Lab Chip. 2007;7:19–23. doi: 10.1039/b616805c. [DOI] [PubMed] [Google Scholar]
- 10.Grieshaber D, MacKenzie R, Voros J, Reimhult E. Sensors. 2008;8:1400–1458. doi: 10.3390/s80314000. [DOI] [PMC free article] [PubMed] [Google Scholar]
- 11.Cui Y, Wei Q, Park H, Lieber CM. Science. 2001;293:1289–1292. doi: 10.1126/science.1062711. [DOI] [PubMed] [Google Scholar]
- 12.Stern E, Klemic JF, Routenberg DA, Wyrembak PN, Turner-Evans DB, Hamilton AD, LaVan DA, Fahmy TM, Reed MA. Nature. 2007;445:519–522. doi: 10.1038/nature05498. [DOI] [PubMed] [Google Scholar]
- 13.Chen Y, Wang X, Erramilli S, Mohanty P, Kalinowski A. Appl Phys Lett. 2006;89:223512. [Google Scholar]
- 14.Bi X, Wong WL, Ji W, Agarwal A, Balasubramanian N, Yang K-L. Biosens Bioelectron. 2008;23:1442–1448. doi: 10.1016/j.bios.2007.12.012. [DOI] [PubMed] [Google Scholar]
- 15.Wang X, Chen Y, Gibney KA, Erramilli S, Mohanty P. Appl Phys Lett. 2008;92:013903. [Google Scholar]
- 16.Hahm J-i, Lieber CM. Nano Lett. 2004;4:51–54. [Google Scholar]
- 17.Li Z, Chen Y, Li X, Kamins TI, Nauka K, Williams RS. Nano Lett. 2004;4:245–247. [Google Scholar]
- 18.Bunimovich YL, Shin YS, Yeo W-S, Amori M, Kwong G, Heath JR. J Am Chem Soc. 2006;128:16323–16331. doi: 10.1021/ja065923u. [DOI] [PMC free article] [PubMed] [Google Scholar]
- 19.Stern E, Wagner R, Sigworth FJ, Breaker R, Fahmy TM, Reed MA. Nano Lett. 2007;7:3405–3409. doi: 10.1021/nl071792z. [DOI] [PMC free article] [PubMed] [Google Scholar]
- 20.Zhang G-J, Zhang G, Chua JH, Chee R-E, Wong EH, Agarwal A, Buddharaju KD, Singh N, Gao Z, Balasubramanian N. Nano Lett. 2008;8:1066–1070. doi: 10.1021/nl072991l. [DOI] [PubMed] [Google Scholar]
- 21.Wang WU, Chen C, Lin K-h, Fang Y, Lieber CM. Proc Nat Acad Sci. 2005;102:3208–3212. doi: 10.1073/pnas.0406368102. [DOI] [PMC free article] [PubMed] [Google Scholar]
- 22.Zheng G, Patolsky F, Cui Y, Wang WU, Lieber CM. Nature Biotech. 2005;23:1294–1301. doi: 10.1038/nbt1138. [DOI] [PubMed] [Google Scholar]
- 23.Li C, Curreli M, Lin H, Lei B, Ishikawa FN, Datar R, Cote RJ, Thompson ME, Zhou C. J Am Chem Soc. 2005;127:12484–12485. doi: 10.1021/ja053761g. [DOI] [PubMed] [Google Scholar]
- 24.Rouhanizadeh M, Tang T, Li C, Hwang J, Zhou C, Hsiai TK. Sens Act B. 2006;114:788–798. [Google Scholar]
- 25.Tang T, Liu X, Li C, Lei B, Zhang D, Rouhanizadeh M, Hsiai TK, Zhou C. Appl Phys Lett. 2005;86:103903. [Google Scholar]
- 26.Kim A, Ah CS, Yu HY, Yang J-H, Baek I-B, Ahn C-G, Park CW, Jun MS. Appl Phys Lett. 2007;91:103901. [Google Scholar]
- 27.Elfstrom N, Karlstrom AE, Linnros J. Nano Lett. 2008;8:945–949. doi: 10.1021/nl080094r. [DOI] [PubMed] [Google Scholar]
- 28.Stern E, Steenblock ER, Reed MA, Fahmy TM. Nano Lett. 2008;8:3310–3314. doi: 10.1021/nl801693k. [DOI] [PMC free article] [PubMed] [Google Scholar]
- 29.Crowther JR. Elisa: Theory and Practice. New York: Humana Press; 1995. [DOI] [PubMed] [Google Scholar]
- 30.Sze SM. Physics of Semiconductor Devices. 2nd ed. New York: John Wiley & Sons; 1981. [Google Scholar]
- 31.Li C, Zhang D, Han S, Liu X, Tang T, Zhou C. Adv Mater. 2003;15:143–146. [Google Scholar]
- 32.Bain CD, Whitesides GM. Langmuir. 1989;5:1370–1378. [Google Scholar]
- 33.Wasserman SR, Tao Y-T, Whitesides GM. Langmuir. 1989;5:1074–1087. [Google Scholar]
- 34.Yin L-T, Chou J-C, Chung W-Y, Sun T-P, Hsiung S-K. Sens Act B. 2000;71:106–111. [Google Scholar]
- 35.Yin L-T, Chou J-C, Chung W-Y, Sun T-P, Hsiung S-K. Mater Chem Phys. 2001;70:12–16. [Google Scholar]
- 36.Chidsey CED, Loiacono DN. Langmuir. 1989;6:682–691. [Google Scholar]
- 37.Duffy DC, McDonald JC, Schueller OJA, Whitesides GM. Anal Chem. 1998;70:4974–4984. doi: 10.1021/ac980656z. [DOI] [PubMed] [Google Scholar]
- 38.Israelachvili J. Intermolecular & Surface Forces. 2 ed. London: Academic Press; 1991. [Google Scholar]
- 39.Jin P, Wang E, Provenzano M, Stroncek D, Marincola FM. Crit Rev Immunol. 2007;27:437–448. doi: 10.1615/critrevimmunol.v27.i5.30. [DOI] [PubMed] [Google Scholar]
- 40.Voet DJ, Voet JG. Biochemistry. 3 ed. New York: John Wiley & Sons; 2005. [Google Scholar]
- 41.Hermanson GT. Bioconjugate Techniques. New York: Elsevier Science & Technology Books; 1996. [Google Scholar]
- 42.Soldatkin AP, Montoriol J, Sant W, Martelet C, Jaffrezic-Renault N. Biosens Bioelectron. 2003;19:131–135. doi: 10.1016/s0956-5663(03)00175-1. [DOI] [PubMed] [Google Scholar]
- 43.Gehring AG, Patterson DL, Tu S-I. Anal Biochem. 1998;258:293–298. doi: 10.1006/abio.1998.2597. [DOI] [PubMed] [Google Scholar]
- 44.Karube I, Moriizumi T. Meth Enzymol. 1988;137:255–260. doi: 10.1016/0076-6879(88)37024-2. [DOI] [PubMed] [Google Scholar]
- 45.Cesareo SD, Langton SR. FEMS Microbiol Lett. 1992;99:15–22. doi: 10.1016/0378-1097(92)90281-r. [DOI] [PubMed] [Google Scholar]
- 46.Uang Y-M, Chou T-C. Electroanal. 2001;14:1564–1570. [Google Scholar]
- 47.Belanger D, Nadreau J, Fortier G. J Electroanal Chem. 1989;274:143–155. [Google Scholar]
- 48.Krajewska B, Ciurli S. Plant Physiol. Biochem. 2005;43:651–658. doi: 10.1016/j.plaphy.2005.05.009. [DOI] [PubMed] [Google Scholar]
- 49.van Hal REG, Eijkel JCT, Bergveld P. Adv. Colloid Interface Sci. 1996;69:31–62. [Google Scholar]
- 50.Pardoll DM. Nat Rev Immunol. 2002;2:227–238. doi: 10.1038/nri774. [DOI] [PubMed] [Google Scholar]
- 51.Schluns KS, Lefrancois L. Nat Rev Immunol. 2003;3:269–279. doi: 10.1038/nri1052. [DOI] [PubMed] [Google Scholar]
- 52.Cheng MM-C, Cuda G, Bunimovich YL, Gaspari M, Heath JR, Hill HD, Mirkin CA, Nijdam AJ, Terracciano R, Thundat T, Ferrari M. Curr Opin Chem Biol. 2006;10:11–19. doi: 10.1016/j.cbpa.2006.01.006. [DOI] [PubMed] [Google Scholar]
- 53.Stern E, Cheng G, Cimpoiasu E, Klie R, Guthrie S, Klemic JF, Kretzschmar I, Steinlauf E, Turner-Evans D, Broomfield E, Hyland J, Koudelka R, Boone T, Young MP, Sanders A, Munden R, Lee T, Routenberg DA, Reed MA. Nanotech. 2005;16:2941–2953. [Google Scholar]
Associated Data
This section collects any data citations, data availability statements, or supplementary materials included in this article.


