

Abstract
Background
In the treatment of tuberculosis, ethambutol is used in case there is isoniazid resistance. We examined for the emergence of drug resistance to ethambutol monotherapy in pharmacokinetic-pharmacodynamic studies in the hollow fiber system.
Methods
Dose–effect studies and dose-scheduling studies were carried out with ethambutol and log-phase growth Mycobacterium tuberculosis to identify exposures and schedules linked to optimal kill and resistance suppression. In one study, after 7 days of ethambutol 300 mg/day isoniazid was administered to each system to determine its early bactericidal activity (EBA).
Results
Efflux-pump blockage reduced the mutation frequency to ethambutol 64-fold. In dose-effect studies, ethambutol had a maximal EBA of 0.22 log10 CFU/ml/day, as encountered in patients. By day 7, resistance had arisen to both ethambutol and isoniazid. Prior exposure to ethambutol abolished isoniazid EBA. Daily therapy, as opposed to more intermittent therapy, was associated with the least proportion of efflux-pump driven resistance, consistent with time driven effect. Microbial kill was best explained by the ratio of area under the concentration-time curve to minimal inhibitory effect (r2=0.90).
Conclusion
Induction of an efflux-pump that reduces effect to multiple drugs provides an alternative pathway to sequential acquisition of mutations in the development of multiple drug resistance.
Ethambutol was the last drug added to the current four drug regimen used to treat tuberculosis (TB). Ethambutol is added to isoniazid, rifampin and pyrazinamide during the first few weeks of therapy to prevent rifampin resistance in case there is unrecognized isoniazid resistance. In addition, ethambutol is the primary drug for the treatment of Mycobacterium avium infection. Other mycobacteria that are susceptible to ethambutol include M. kansasii, M. szulgai, M. gordonae, M. marinum, and M. scrofulaceum. While the pharmacokinetic-pharmacodynamic (PK/PD) properties of other anti-TB drugs have been recently determined, those of ethambutol are as yet unknown (1–9).
It is intriguing that when isoniazid-resistant M. tuberculosis isolates with mutations at Ser315 of the catalase-peroxidase gene (katG Ser315) were examined, they often had concurrent resistance to ethambutol (10). The katG Ser315 mutation is the most prevalent mutation in isoniazid-resistant clinical isolates, and it is believed that due to good biofitness this mutation increases the chance of acquiring high-level ethambutol resistance (10). In the laboratory, M. tuberculosis exposures to static isoniazid concentrations led to concurrent resistance to both isoniazid and ethambutol, via induction of a multi-drug resistance-like pump (11). However, it is unknown if exposure to ethambutol, and to concentration-time profiles similar to those encountered in TB patients, also lead to simultaneous resistance to ethambutol and isoniazid.
In the standard anti-TB regimen, early bactericidal activity (EBA) is derived mostly from isoniazid effect. The EBA of an anti-TB drug is the average rate of sputum bacillary decline during the first 2 days of therapy, with that due to isoniazid being the highest at 0.6 log10 CFU/ml sputum per day (12). Since pyrazinamide has no EBA and the standard 10 mg/kg rifampin has limited bactericidal activity, it means that when there is pre-existent isoniazid resistance ethambutol is expected to provide most of the EBA (13). Ethambutol EBA is dose dependent, with a maximum of 0.25 log10 CFU/ml sputum per day at doses 25 mg/kg/day, followed by a sputum bacillary decline of 0.1 log10 CFU/ml per day from day 3 to 14 (13). While the importance and the basis for EBA is controversial (4;14;15), this clinical index of microbial kill can nevertheless still be used to benchmark pre-clinical PK/PD models which can be subsequently used to examine pharmacological events associated with anti-TB drugs.
We examined the relationship between ethambutol exposure, bactericidal activity, and efflux-pump related resistance to both ethambutol and isoniazid. The studies were performed by mimicking the serum concentration-time profiles of ethambutol encountered in TB patients. With daily ethambutol dosing there is a triphasic oscillation in concentration, consisting of a 2h time to peak concentration (tmax) followed by a biphasic decline, at a periodicity of 24h, which is less than the M. tuberculosis doubling time(16–18). Since the ethambutol plasma to epithelial lining fluid ratio is 1 (19), the serum concentrations were assumed to adequately mirror those at the site of pulmonary TB. PK/PD parameters associated with M. tuberculosis microbial kill, EBA, and resistance emergence were then determined.
Methods
Bacterial isolate
Mycobacterium tuberculosis H37Rv (ATCC27294) was used in all studies. This strain was chosen because it has a lower ethambutol MIC than most clinical isolates, and is highly susceptible to ethambutol. Stock cultures of the M. tuberculosis were stored at -80°C in Middlebrook 7H9 broth with 10% OADC (Remel Inc.) and 10% glycerol. For each study, the bacterial stock was thawed and incubated at 37°C for four days in Middlebrook 7H9 broth under shaking conditions and 5% CO2 to achieve log-phase growth. All cultures and studies were performed under BSL-3 conditions, as sanctioned by UT Southwestern Environmental Health and Safety Committee.
Drugs and supplies
All drugs were purchased from Sigma-Aldrich. Ethambutol and isoniazid were dissolved in sterile water to the desired drug concentrations. Reserpine was first dissolved in dimethylsulfoxide, and then diluted to the desired concentration in Middlebrook 7H9 broth. Hollow fiber cartridges and caps were purchased from FiberCell Systems and tubing from Masterflex.
Minimum inhibitory concentrations(MIC) and mutant frequency
The ethambutol MIC was determined using the agar dilution method, as well as the E-test (Biodisk). Mutation frequency studies to “critical concentrations” of ethambutol of 5 mg/L (20)were performed on Middlebrook 7H10 agar, as well as on agar supplemented with the efflux-pump inhibitor reserpine at a final concentration of 10 mg/L, shown elsewhere not to kill log-phase growth M. tuberculosis (3;4). Ethambutol resistant colonies were counted on 20 agar plates plated with 0.2 ml of non-diluted inoculum.
In vitro pharmacodynamic model of TB
Our pharmacodynamic model of TB, which utilizes hollow fiber technology, has been described in detail in the past (1–5;9). In our current experiments, bacilli grew in log-phase growth in the peripheral compartment, and were exposed to antibiotic concentration-time profiles that mimicked those in TB patients. Ethambutol was administered into the central compartment of these systems via a computer controlled syringe pumps to achieve a tmax of 2h. Media flow rates were set to mimic an α half-life (t1/2) of 3h from 0 to 12h, and a t1/2β of 12h between hour 12 and 24 as encountered in patients (16–18). Similarly, isoniazid was administered to mimic a tmax of 1h and a t1/2 of 3h, as encountered in slow acetylators, as described in the past (4).
Ethambutol dose-effect studies
M. tuberculosis cultures were grown into log-phase as described above. On the 4th day of log-phase, 10mL of the 106 CFU/ml cultures were inoculated into the peripheral compartment of the in vitro pharmacodynamic models, and the systems incubated at 37°C under 5% CO2. Starting 24h after inoculation, ethambutol was administered daily for 7 days to mimic the serum 0–24 hour area under the concentration time curve (AUC0–24) and peak concentrations (Cmax) achieved by human doses of 0-, 6.25-, 12.5-, 25-, 50-, 75-, and 100-mg/kg per day. On days 8 and 9, isoniazid was administered in all systems every 24h, to mimic AUC0–24 and Cmax achieved by a daily dose of 300 mg administered to slow acetylator TB patients. Starting from the first ethambutol infusion, the central compartment of each system was sampled 10 times over 48h in order to validate that intended ethambutol concentration-time profiles were achieved. The M. tuberculosis cultures were sampled on days 0, 2, 5, 7, and 10. Each sample was washed twice in saline to prevent drug carry over, as described in the past (1–3;5;9). The cultures were then serially diluted and the size of the M. tuberculosis population determined by plating on Middlebrook 7H 10agar supplemented with 10% OADC. In order to determine the sizes of the ethambutol resistant and isoniazid resistant populations, the same cultures were also plated on Middlebrook 7H10 agar supplemented with either 5.0mg/L of ethambutol or the critical concentration of isoniazid of 0.2 mg/L (20). Colonies were counted after 3 weeks of incubation at 37°C under5% CO2.
Ethambutol dose-scheduling studies
Based on the results of the dose-effect study, two sets of dose-scheduling studies were performed. In the first study, we wanted to explore further the potential for efflux-pump induction with paired regimens of either daily or once a week ethambutol monotherapy dosing for up to 21days. An inoculum of 4.5 log10 CFU/ml M. tuberculosis, less than the inverse of the mutation frequency, was used for this study in order to minimize chances of pre-existing resistance due to chromosomal mutations. Three paired regimens were examined; regimen A associated with 20% of maximal kill (ED20), regimen B associated with 50% of maximal kill (ED50), and regimen C associated with 80% of maximal kill (ED80). The relationships between dosing-schedule and microbial kill and emergence of efflux-pump related drug resistance were examined by inspection. Efflux-pump related resistance to ethambutol was defined as resistance that could be abolished by 10 mg/L of reserpine on Middlebrook agar, and was expressed as a percentage of the total resistant sub-population at end of study (day 21).
Based on results of this study, and the dose-effect study above, a more intensive dose- scheduling study was performed to better characterize PK/PD parameter (AUC/MIC, Cmax/MIC or %TMIC) associated with effect. In this study, the cumulative weekly doses of ED1, D5, ED20, ED50, and ED80 were administered once a week, or as seven daily doses administered daily. One system was a non-treated control. Each hollow fiber system was sampled at 0, 1, 4, 8, 12, 18, 23.5, 25, 28, 32, 36, 48, and 72 hours for ethambutol concentrations achieved. Cultures in each hollow fiber system were sampled on days 0, 3, 7, 10, and 14, and processed as described above to determine the total bacterial population. The cultures were also plated on Middlebrook 7H10 that had been supplemented with either one of the following: ethambutol 5 mg/L, and ethambutol 5 mg/L with 10 mg/L of reserpine.
Measurement of ethambutol concentration
Middlebrook 7H9 broth samples with drug were diluted 1:10 with de-ionized water and a 20 μL sample volume was injected directly without further processing. LC/MS/MS method was used to analyze samples on a Shimadzu HPLC system with a ODS-3 Inertsil Varian column 50X2.5 mm (5μ) at 40° C. The isocratic mobile phase (0.2 mL/hr) consisted of 50% of 0.1% formic acid in deionized water and 50% of 0.1% formic acid in methanol (v/v). Detection was accomplished using an API 3000 mass spectrometer that was programmed in the multiple reaction-monitoring mode (MRM), monitoring the transition of the mass charge 205.10 m/z precursor ion to the 116.10 m/z product ion for ethambutol. The method was linear from 1 to 1000 ng/mL (r = 0.999); accuracy was within ± 5%.
PK/PD modeling
Ethambutol pharmacokinetic parameters were determined using ADAPT II software of D’Argenio and Schumitzky (21)The relationship between ethambutol exposure and the total M. tuberculosis population was modeled by use of the inhibitory sigmoid Emax model, as described in the past(1–9). All PK/PD modeling was performed using GraphPad Prism 5.0 (GraphPad Software Inc.).
RESULTS
The ethambutol MIC was 0.03 mg/L. The mutation frequency to ethambutol was 1.57× 10⁻⁵. However, in the presence of reserpine the mutation frequency was 1.99 × 10⁻⁷, a 64 fold reduction.
Population pharmacokinetic analysis of ethambutol concentrations in the hollow fiber systems revealed a V of 227±47 L, ka of 31.340±8.472, a ke of 0.214±0.076/h during the α phase and 0.035±0.008/h during the β-phase. The time to maximum concentration was 2h in all the systems. Thus, the triphasic concentration-time profile of ethambutol was adequately mimicked. In terms of dose-effect, shown in figure 1, the M. tuberculosis burden on day 2 was related to ethambutol exposure (equivalent human dose in mg/kg) by the equation:
Figure 1.
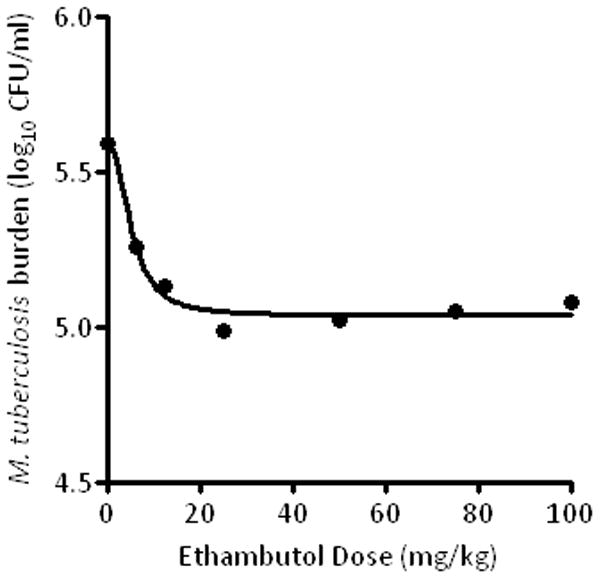
Effect of human equivalent ethambutol doses on Mycobacterium tuberculosis.
The r2 for this regression was0.97, and the p-value was<0.001. Examination of the relationship between exposure and EBA (as opposed to bacillary burden) revealed that the maximal EBA (Emax) was 0.22 (95% CI: 0.14–0.29) log10 CFU/ml/day. Beyond the period corresponding to the EBA (days 2 to 7), the maximal rate of decrease in bacillary burden was 0.04 to 0.10 log10 CFU/ml/day. On day 7, the relationship between ethambutol exposure and resistance to ethambutol and isoniazid, was as shown in figure 2. Indeed, when the systems were treated on days 8 and 9with an isoniazid exposure equivalent to 300 mg a day, the EBA was as shown in figure 3, which demonstrates phenotypic tolerance in all systems with prior exposure to ethambutol monotherapy. On the other hand, the isoniazid EBA in the control cultures, hitherto untreated with ethambutol, was 0.67 log10 CFU/ml per day.
Figure 2.
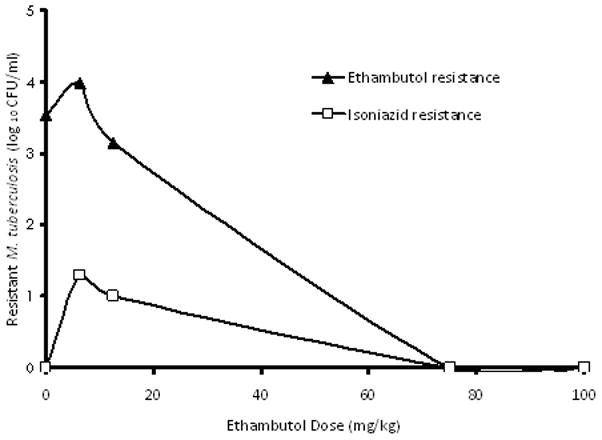
Emergence of isoniazid and ethambutol resistance after therapy to ethambutol monotherapy.
Figure 3.
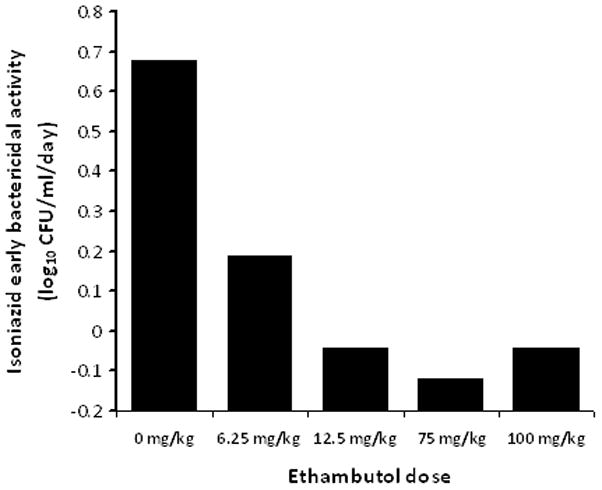
Early bactericidal activity of isoniazid after exposure to several ethambutol doses.
When 3 ethambutol regimens were administered as either a daily or as a once a week regimen, in hollow fiber systems with a low inoculum, results were as shown in figure 4. The results were conflicting, with once a week regimen showing greater kill at the end of the first dosing interval for regimens A and C which would is consistent with Cmax/MIC driven effect, but equivalent amounts of kill for regimen B regardless of dose schedule which is consistent with AUC/MIC driven effect. By day 14 all regimens had failed and looked alike due to resistance emergence. On day 21, the relationship between the resistant subpopulation due to efflux pumps, versus dosing schedule on day 21, was as shown in table 1. Since once a week regimens were associated with higher proportion of efflux-pump related resistance, the emergence of this resistant subpopulation was %TMIC linked. The next experiment examined a more extensive dose-scheduling dosing regimen, and based on the inhibitory sigmoid Emax model, ther2 was 0.25for %TMIC, 0.56for Cmax/MIC, and 0.90for AUC/MIC for microbial kill. The EC50 was an AUC 0–168/MIC of 552.9 or an AUC0–24/MIC of 79.0.
Figure 4. Dose scheduling study with three pairs of doses administered either once a week or 7 equally divided doses each day.
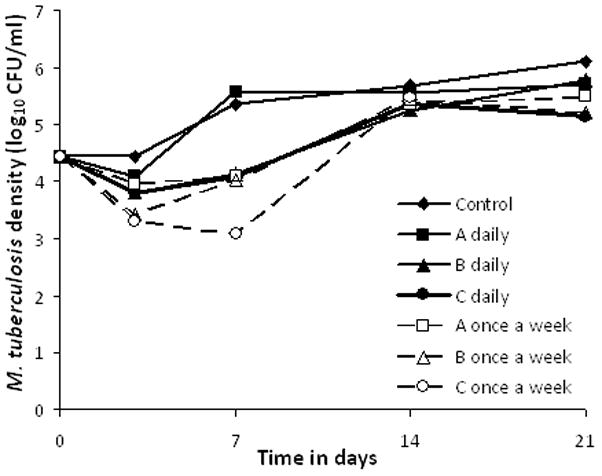
Notes: Dose scheduling demonstrated concentration dependent relationship for total bacillary burden on day, but resistance had emerged in all regimens by day 14. Two non-paired regimens were omitted from the graph for purposes of clarity.
Table 1.
Percentage of reserpine inhibited ethambutol resistant subpopulation by dosing schedule
| Regimen | Daily therapy (%) | Once a week (%) |
|---|---|---|
| Control (AUC0–168/MIC=0 ) | 0.5 | - |
| Regimen 1 (AUC0–168/MIC= 2.99) | 28.7 | 60.5 |
| Regimen 2 (AUC0–168/MIC=8.63 ) | 8.0 | 88.7 |
| Regimen 3 (AUC0–168/MIC=17.26 ) | 74.8 | |
| Regimen 4 (AUC0–168/MIC= 33.19) | 7.1 |
DISCUSSION
The experimental system we utilized has been used for the bactericidal effect of anti-TB drugs in the past (1–5). In the current study, this system was able to recapitulate the maximal ethambutol EBA of 0.25 log10 CFU/ml sputum per day and an extended bactericidal rate of 0.1 log10 CFU/ml per day, encountered in TB patients (12;13). While mutation frequency rates to 5 mg/L ethambutol were establishedas5 × 10−5 four decades ago (22), the pattern and time to emergence of ethambutol resistance in TB patients have not been adequately defined. This is because ethambutol was the last of the four first line drugs introduced and came at a time when the advantage of combination therapy was already apparent. Our experimental system was able to provide such data, enabling us to better study the evolution of resistance to this drug.
It is believed that when there is concurrent drug resistance in isolates, the acquisition of the resistance is a sequential process, with the bacilli picking mutations resistant to one drug followed later by another drug (23). This is based on the understanding of stable mutation frequencies, leading to the conclusion that the chance of simultaneous mutations leading to resistance to two drugs in pulmonary cavities is incredibly small. Mutation frequency studies typically use static concentrations of drug in growth media to establish mutation frequencies. However, it is general principle of adaptive evolution that oscillations in the intensity of environmental stressors results in higher mutation rates and a greater need to adapt when compared to constant stressor pressure (24;25). Therefore, resistance emergence may be even more likely with dynamic concentrations of drug, as opposed to when the bacillus is exposed to static concentrations of drugs. In our experimental pharmacokinetic system, resistance emerged quickly even when a low inoculum with minimal chance of having pre-existent resistant isolates was utilized. Moreover, in dose-scheduling studies, once a week therapy regimens which are associated with even more abrupt changes in drug concentrations compared to regular daily dosing, were associated with greater proportions of efflux-pump related resistance. Similarly, with pharmacokinetic changes in vitro and in patients, M. tuberculosis resistance to rifampin, moxifloxacin, ciprofloxacin, isoniazid, and pyrazinamide also emerged within a few days, well before the pre-existent chromosomal mediated resistant subpopulation could grow enough to account for the total size of the resistant population (1–5;9;26;27). Furthermore, efflux-pumps are being increasingly encountered as a cause of clinically relevant M. tuberculosis drug resistance (28–31).
Ethambutol monotherapy not only led to resistance to self, but also tolerance to isoniazid. The size of this resistant subpopulation was drastically reduced by reserpine, a drug also known to reverse resistance to isoniazid(4;11). These results are consistent with a pump that effluxes both isoniazid and ethambutol. Bacterial ATP-binding cassette (ABC) and Major Facilitator Superfamily (MFS) transporters have the capacity to extrude a wide variety of structurally unrelated chemicals from bacteria. Thus, one antibiotic may induce a pump that also extrudes other antibiotics. Alternatively, one antibiotic may induce a particular single pathway, which then leads to induction of many different efflux pumps. As an example, when M. tuberculosis is exposed to tetracycline, there is induction of whiB7, a primary regulatory gene, whose expression leads to induction of at least3 further genes: Rv1258c which encodes a tap-like efflux-pump that confers low level resistance to the tetracycline itself and aminoglycosides, Rv1473 which encodes an ABC transporter which effluxes macrolides, and erm which confers resistance to lincosamide and streptogramin (32). Interestingly, Rv1258c encodes for an MFS efflux pump that is inhibited by reserpine (33). Moreover, Rv1258c is over expressed in the presence of either isoniazid or rifampin in clinical isolates with chromosomal mutations in the katG and rpoB genes (30;31). Other transporters that extrude both ethambutol and isoniazid from M. tuberculosis include an ABC transporter encoded by pstB, which also extrudes rifampin, and the drug transporter encoded by iniA (11;34). Whatever the case, induction of multiple drug resistance by a single drug to structurally unrelated drugs is clearly a common survival strategy of the tubercle bacillus.
Given the foregoing, as well as our experimental results, we would like to propose a general model for the emergence of resistance to multiple drugs by M. tuberculosis. The model, illustrated in figure 5, has a first step consisting of induction of efflux pumps. This allows the bacteria more time for multiple replications in the face of ongoing chemical pressure; more replications increase the chances of emergence of chromosomal mutations associated with drug-resistance. Indeed, while induction of efflux pumps may impose energy costs, in general this ancient mechanism provides amore rapid response to toxins for an organism with a doubling time 24h, allowing for the development of a chromosomal mutation that least compromises biofitness. The poly specific nature of the pumps mean that instead of sequential acquisition of resistance mutations to two unrelated compounds (10), the critical first event may often be induction of an efflux-pump which transports the two or more drugs, enabling rapid emergence of high level resistance to both. This would explain, for example, the important observation by Parsons et al that high level ethambutol resistance without concurrent isoniazid resistance is rarely encountered in the clinic (10). However, the proposed model will need to be validated using other TB disease models, and ultimately in patients. The model that we propose likely does not operate in exclusivity. As an example, mutations in genes involved in DNA repair mechanisms may lead to hyper-mutable strains to many antibiotics (mutator phenotypes). Clinical isolates of the Beijing genotype have been demonstrated to have mutations in the repair genes mut and ogt, which leads higher rates of simultaneous rifampin and isoniazid resistance (35;36). Less stable mutator phenotypes due to anti-TB drugs, oxidative stressors, and other environmental stressors, may even be more common than stable mutator phenotypes (37;38). Thus efflux-pump induction, stable mutators, and inducible mutators, likey work in various permutations and combinations, so that the concept of sequential acquisition of mutations that lead to two different drugs, based on stable baseline mutation frequencies, may be an over simplification.
Figure 5.

Proposed evolution of simultaneous drug resistance to anti-tuberculosis drugs
The clinical implications of our findings are as yet unclear. However it is intriguing that in 3 independent studies from India and the USA that examined >4500 M. tuberculosis isolates from TB patients, ethambutol resistance was almost always accompanied by isoniazid resistance (10, 39,40). However, a considerable proportion of isoniazid resistant isolates did not have ethambutol resistance (40). This pattern suggests a linkage between exposure to ethambutol and emergence of isoniazid resistance. A study examining the effect of efflux pump inhibitors on the MICs of a large number of ethambutol-resistant clinical M. tuberculosis isolates, with and without known ethambutol and isoniazid associated chromosomal mutations, is the ideal next step. If the MICs in these isolates decrease in the presence of an efflux pump inhibitor consistent with our proposed model (figure 5), then the clinical strategy of using ethambutol as an insurance in case of isoniazid resistance versus the potential of ethambutol to limit the effectiveness of isoniazid would need to be evaluated. It is also unclear if the efflux pump induction also limits the effectiveness of ethambutol and isoniazid analogues such as SQ 109 and ethionamide, respectively. Thus further studies are needed. On the other hand, if the role of efflux pump induction is confirmed, efflux pump inhibitors could be developed as a therapeutic strategy to forestall the emergence of multiple drug resistance.
Finally, both microbial kill and resistance emergence were examined using classic PK/PD approaches. Less frequent dosing of the same cumulative dose was associated with higher proportions of reserpine inhibitable resistance, while daily therapy fared better, strongly suggesting that TMIC was more important for suppressing efflux pump related drug resistance. However, in terms of microbial kill, concentration related measures, especially AUC/MIC, where more important in determining microbial kill. Such differences between PK/PD parameter associated with microbial and resistance seems to be common when M. tuberculosis has been studied (5;9). This should not be a surprise given that the mechanism of kill (inhibition of specific target) may vary from those associated with drug-resistance emergence (e.g., efflux-pump induction). Nevertheless, the concentration related kill strongly suggests that higher doses than currently utilized may be more effective for ethambutol. However the exact doses remain to be identified and the toxicity of such does determined.
Acknowledgments
None
Financial supports: The funding for the study was an NIH Director New Innovator Award (1 DP2 OD001886) to Tawanda Gumbo from the NIGM/NIH.
Footnotes
Conflict of interest: S. Srivastava-no conflict of interest, S. Musuka-no conflict of interest, C. Sherman-no conflict of interest, C. Meek-no conflict of interest, R. Leff-no conflict of interest, T. Gumbo-no conflict of interest.
Parts of the information was presented as an oral presentation at the48th Interscience Conference of Antimicrobial Agents and Chemotherapy and 46th Infectious Diseases Society of America(Abstract # A-1822), Washington, DC. October, 2008.
Reference List
- 1.Gumbo T, Louie A, Deziel MR, Parsons LM, Salfinger M, Drusano GL. Selection of a moxifloxacin dose that suppresses drug resistance in Mycobacterium tuberculosis, by use of an in vitro pharmacodynamic infection model and mathematical modeling. J Infect Dis. 2004;190:1642–51. doi: 10.1086/424849. [DOI] [PubMed] [Google Scholar]
- 2.Gumbo T, Louie A, Deziel MR, Drusano GL. Pharmacodynamic evidence that ciprofloxacin failure against tuberculosis is not due to poor microbial kill but to rapid emergence of resistance. Antimicrob Agents Chemother. 2005;49:3178–81. doi: 10.1128/AAC.49.8.3178-3181.2005. [DOI] [PMC free article] [PubMed] [Google Scholar]
- 3.Gumbo T, Louie A, Liu W, et al. Isoniazid bactericidal activity and resistance emergence: integrating pharmacodynamics and pharmacogenomics to predict efficacy in different ethnic populations. Antimicrob Agents Chemother. 2007;51:2329–36. doi: 10.1128/AAC.00185-07. [DOI] [PMC free article] [PubMed] [Google Scholar]
- 4.Gumbo T, Louie A, Liu W, et al. Isoniazid’s bactericidal activity ceases because of the emergence of resistance, not depletion of Mycobacterium tuberculosis in the log phase of growth. J Infect Dis. 2007;195:194–201. doi: 10.1086/510247. [DOI] [PubMed] [Google Scholar]
- 5.Gumbo T, Louie A, Deziel MR, et al. Concentration-dependent Mycobacterium tuberculosis killing and prevention of resistance by rifampin. Antimicrob Agents Chemother. 2007;51:3781–8. doi: 10.1128/AAC.01533-06. [DOI] [PMC free article] [PubMed] [Google Scholar]
- 6.Jayaram R, Gaonkar S, Kaur P, et al. Pharmacokinetics-pharmacodynamics of rifampin in an aerosol infection model of tuberculosis. Antimicrob Agents Chemother. 2003;47:2118–24. doi: 10.1128/AAC.47.7.2118-2124.2003. [DOI] [PMC free article] [PubMed] [Google Scholar]
- 7.Jayaram R, Shandil RK, Gaonkar S, et al. Isoniazid pharmacokinetics-pharmacodynamics in an aerosol infection model of tuberculosis. Antimicrob Agents Chemother. 2004;48:2951–7. doi: 10.1128/AAC.48.8.2951-2957.2004. [DOI] [PMC free article] [PubMed] [Google Scholar]
- 8.Shandil RK, Jayaram R, Kaur P, et al. Moxifloxacin, ofloxacin, sparfloxacin, and ciprofloxacin against Mycobacterium tuberculosis: evaluation of in vitro and pharmacodynamic indices that best predict in vivo efficacy. Antimicrob Agents Chemother. 2007;51:576–82. doi: 10.1128/AAC.00414-06. [DOI] [PMC free article] [PubMed] [Google Scholar]
- 9.Gumbo T, Siyambalapitiyage Dona CS, Meek C, Leff R. Pharmacokinetics-Pharmacodynamics of pyrazinamide in a novel in vitro model of tuberculosis for sterilizing effect: A paradigm for faster assessment of new antituberculosis drugs. Antimicrob Agents Chemother. 2009;53:3197–204. doi: 10.1128/AAC.01681-08. [DOI] [PMC free article] [PubMed] [Google Scholar]
- 10.Parsons LM, Salfinger M, Clobridge A, et al. Phenotypic and molecular characterization of Mycobacterium tuberculosis isolates resistant to both isoniazid and ethambutol. Antimicrob Agents Chemother. 2005;49:2218–25. doi: 10.1128/AAC.49.6.2218-2225.2005. [DOI] [PMC free article] [PubMed] [Google Scholar]
- 11.Colangeli R, Helb D, Sridharan S, et al. The Mycobacterium tuberculosis iniA gene is essential for activity of an efflux pump that confers drug tolerance to both isoniazid and ethambutol. Mol Microbiol. 2005;55:1829–40. doi: 10.1111/j.1365-2958.2005.04510.x. [DOI] [PubMed] [Google Scholar]
- 12.Donald PR, Sirgel FA, Venter A, et al. Early bactericidal activity of antituberculosis agents. Expert Rev Anti Infect Ther. 2003;1:141–55. doi: 10.1586/14787210.1.1.141. [DOI] [PubMed] [Google Scholar]
- 13.Jindani A, Aber VR, Edwards EA, Mitchison DA. The early bactericidal activity of drugs in patients with pulmonary tuberculosis. Am Rev Respir Dis. 1980;121:939–49. doi: 10.1164/arrd.1980.121.6.939. [DOI] [PubMed] [Google Scholar]
- 14.O’Brien RJ. Studies of the early bactericidal activity of new drugs for tuberculosis: a help or a hindrance to antituberculosis drug development? Am J Respir Crit Care Med. 2002;166:3–4. doi: 10.1164/rccm.2205007. [DOI] [PubMed] [Google Scholar]
- 15.Musuka S, Siyambalapitiyage Dona C, Gumbo T. Bad Drugs, Not Bad Bugs: Efflux-Pump inhibition abolishes the selectivity of standard drugs against tuberculosis (TB). Program and abstracts of the 49th Interscience Conference on Antimicrobial Agents and Chemotherapy; San Francisco. Washington, DC: American Society for Microbiology; 2009. [Google Scholar]
- 16.Lee CS, Gambertoglio JG, Brater DC, Benet LZ. Kinetics of oral ethambutol in the normal subject. Clin Pharmacol Ther. 1977;22:615–21. doi: 10.1002/cpt1977225part1615. [DOI] [PubMed] [Google Scholar]
- 17.Lee CS, Brater DC, Gambertoglio JG, Benet LZ. Disposition kinetics of ethambutol in man. J Pharmacokinet Biopharm. 1980;8:335–46. doi: 10.1007/BF01059382. [DOI] [PubMed] [Google Scholar]
- 18.Peloquin CA, Bulpitt AE, Jaresko GS, Jelliffe RW, Childs JM, Nix DE. Pharmacokinetics of ethambutol under fasting conditions, with food, and with antacids. Antimicrob Agents Chemother. 1999;43:568–72. doi: 10.1128/aac.43.3.568. [DOI] [PMC free article] [PubMed] [Google Scholar]
- 19.Conte JE, Jr, Golden JA, Kipps J, Lin ET, Zurlinden E. Effects of AIDS and gender on steady-state plasma and intrapulmonary ethambutol concentrations. Antimicrob Agents Chemother. 2001;45:2891–6. doi: 10.1128/AAC.45.10.2891-2896.2001. [DOI] [PMC free article] [PubMed] [Google Scholar]
- 20.Clinical and Laboratory Standards Institute. Approved Standard. Wayne, PA: Clinical and Laboratory Standards Institute; 2003. Susceptibility testing of Mycobacteria, Nocardiae, and other aerobic Actinomycetes. [PubMed] [Google Scholar]
- 21.D’Argenio DZ, Schumitzky A. Biomedical Simulations Resource. University of Southern California; Los Angeles, California, USA: 1997. ADAPT II. A program for simulation, identification, and optimal experimental design. User manual. [Google Scholar]
- 22.David HL. Probability distribution of drug-resistant mutants in unselected populations of Mycobacterium tuberculosis. Appl Microbiol. 1970;20:810–4. doi: 10.1128/am.20.5.810-814.1970. [DOI] [PMC free article] [PubMed] [Google Scholar]
- 23.Mitchison DA. How drug resistance emerges as a result of poor compliance during short course chemotherapy for tuberculosis. Int J Tuberc Lung Dis. 1998;2:10–5. [PubMed] [Google Scholar]
- 24.Taddei F, Radman M, Maynard-Smith J, Toupance B, Gouyon PH, Godelle B. Role of mutator alleles in adaptive evolution. Nature. 1997;387:700–2. doi: 10.1038/42696. [DOI] [PubMed] [Google Scholar]
- 25.Taddei F, Vulic M, Radman M, Matic I. Genetic variability and adaptation to stress. EXS. 1997;83:271–90. doi: 10.1007/978-3-0348-8882-0_15. [DOI] [PubMed] [Google Scholar]
- 26.Yeager RL, Munroe WG, Dessau FI. Pyrazinamide (aldinamide) in the treatment of pulmonary tuberculosis. Am Rev Tuberc. 1952;65:523–46. [PubMed] [Google Scholar]
- 27.Ginsburg AS, Woolwine SC, Hooper N, et al. The rapid development of fluoroquinolone resistance in M. tuberculosis. N Engl J Med. 2003;349:1977–8. doi: 10.1056/NEJM200311133492023. [DOI] [PubMed] [Google Scholar]
- 28.Spies FS, da Silva PE, Ribeiro MO, Rossetti ML, Zaha A. Identification of mutations related to streptomycin resistance in clinical isolates of Mycobacterium tuberculosis and possible involvement of efflux mechanism. Antimicrob Agents Chemother. 2008;52:2947–9. doi: 10.1128/AAC.01570-07. [DOI] [PMC free article] [PubMed] [Google Scholar]
- 29.Richter E, Rusch-Gerdes S, Hillemann D. First linezolid-resistant clinical isolates of Mycobacterium tuberculosis. Antimicrob Agents Chemother. 2007;51:1534–6. doi: 10.1128/AAC.01113-06. [DOI] [PMC free article] [PubMed] [Google Scholar]
- 30.Siddiqi N, Das R, Pathak N, et al. Mycobacterium tuberculosis isolate with a distinct genomic identity overexpresses a tap-like efflux pump. Infection. 2004;32:109–11. doi: 10.1007/s15010-004-3097-x. [DOI] [PubMed] [Google Scholar]
- 31.Jiang X, Zhang W, Zhang Y, et al. Assessment of efflux pump gene expression in a clinical isolate Mycobacterium tuberculosis by real-time reverse transcription PCR. Microb Drug Resist. 2008;14:7–11. doi: 10.1089/mdr.2008.0772. [DOI] [PubMed] [Google Scholar]
- 32.Morris RP, Nguyen L, Gatfield J, et al. Ancestral antibiotic resistance in Mycobacterium tuberculosis. Proc Natl Acad Sci U S A. 2005;102:12200–5. doi: 10.1073/pnas.0505446102. [DOI] [PMC free article] [PubMed] [Google Scholar]
- 33.Ramon-Garcia S, Martin C, Ainsa JA, De RE. Characterization of tetracycline resistance mediated by the efflux pump Tap from Mycobacterium fortuitum. J Antimicrob Chemother. 2006;57:252–9. doi: 10.1093/jac/dki436. [DOI] [PubMed] [Google Scholar]
- 34.Louw GE, Warren RM, van Pittius NC, McEvoy CR, van Helden PD, Victor TC. A balancing act: efflux/influx in mycobacterial drug resistance. Antimicrob Agents Chemother. 2009;53:3181–9. doi: 10.1128/AAC.01577-08. [DOI] [PMC free article] [PubMed] [Google Scholar]
- 35.Rad ME, Bifani P, Martin C, et al. Mutations in putative mutator genes of Mycobacterium tuberculosis strains of the W-Beijing family. Emerg Infect Dis. 2003;9:838–45. doi: 10.3201/eid0907.020803. [DOI] [PMC free article] [PubMed] [Google Scholar]
- 36.Nouvel LX, Kassa-Kelembho E, Dos VT, et al. Multidrug-resistant Mycobacterium tuberculosis, Bangui, Central African Republic. Emerg Infect Dis. 2006;12:1454–6. doi: 10.3201/eid1209.060361. [DOI] [PMC free article] [PubMed] [Google Scholar]
- 37.Boshoff HI, Reed MB, Barry CE, III, Mizrahi V. DnaE2 polymerase contributes to in vivo survival and the emergence of drug resistance in Mycobacterium tuberculosis. Cell. 2003;113:183–93. doi: 10.1016/s0092-8674(03)00270-8. [DOI] [PubMed] [Google Scholar]
- 38.Warner DF, Mizrahi V. Tuberculosis chemotherapy: the influence of bacillary stress and damage response pathways on drug efficacy. Clin Microbiol Rev. 2006;19:558–70. doi: 10.1128/CMR.00060-05. [DOI] [PMC free article] [PubMed] [Google Scholar]
- 39.Madison B, Robinson-Dunn B, George I, et al. Multicenter evaluation of ethambutol susceptibility testing of Mycobacterium tuberculosis by agar proportion and radiometric methods. J Clin Microbiol. 2002;40:3976–3979. doi: 10.1128/JCM.40.11.3976-3979.2002. [DOI] [PMC free article] [PubMed] [Google Scholar]
- 40.Gupta P, Jadaun GPS, Das R, et al. Simultaneous ethambutol and isoniazid resistance in clinical isolates of Mycobacterium tuberculosis. Indian J Med Res. 2006;123:125–130. [PubMed] [Google Scholar]