Abstract
Purpose:
Partnership formation and dissolution rates are primary determinants of sexually transmitted infection (STI) transmission dynamics.
Methods:
The authors used data on persons' lifetime sexual experiences from a 2003-2004 random digit dialing survey of Seattle residents aged 18-39 years (N=1,194) to estimate age- and gender-specific partnership formation and dissolution rates. Partnership start and end dates were used to estimate participants' ages at the start of each partnership and partnership durations, and partnerships not enumerated in the survey were imputed.
Results:
Partnership formation peaked at age 19 at 0.9 (95% CI: 0.76, 1.04) partnerships per year and decreased to 0.1-0.2 after age 30 for women and peaked at age 20 at 1.4 (95% CI: 1.08, 1.64) and declined to 0.5 after age 30 for men. Nearly a quarter (23.7%) of partnerships ended within 1 week and over one-half (51.2%) ended within 12 weeks. Most (63.5%) individuals aged 30-39 had not formed a new sexual partnership in the past 3 years.
Conclusion:
A large proportion of the heterosexual population is no longer at substantial STI risk by their early 30s, but similar analyses among high-risk populations may give insight into reasons for the profound disparities in STI rates across populations.
Keywords: heterosexual, partnerships, mathematical modeling, random digit dialing survey, sexually transmitted diseases, epidemiology
INTRODUCTION
The rates at which people form and dissolve sexual partnerships are primary determinants of sexually transmitted infection (STI) transmission dynamics and are critical parameters in mathematical models for STI (1,2). Thus, defining these rates, how they vary over time, and how they differ within and between populations is critical to the understanding of the epidemiology of different STI (3). Formation and dissolution rates vary with age, and most people eventually stop forming new sexual partnerships as they become older (4). While high partnership formation rates generally promote more widespread STI transmission, the impact of different rates at different ages will vary depending on the STI considered. Because the prevalence of chronic STI, such as HIV and herpes simplex virus type 2, increases with age, the behavior of relatively older persons is likely important in defining their epidemiology. In contrast, curable bacterial STI, such as gonorrhea and chlamydial infection, typically affect populations with relatively high partnership formation rates, and are generally concentrated in young people, particularly among heterosexuals.
To date, investigators have typically estimated partnership formation rates from cross-sectional studies of extant or recent partnerships (5,6). These estimates are often based on an aggregate number of partners reported in a given time period and assume all partnerships, including longstanding partnerships, are new. With this limitation in mind, Morris et al. developed a model to estimate partnership formation rates based on lifetime number of partners (7). Another method for calculating partnership formation and dissolution rates involves egocentric partnership data (i.e., start and end dates of recent partnerships), which provide reasonably reliable information on partnership timing and duration (8). However, estimating partnership duration based solely on egocentric partnership data is subject to length-biased sampling (9) and results in inflated partnership duration rates due to oversampling of longer partnerships (10).
We used data on persons' lifetime sexual experiences taken from a population-based survey in Seattle, Washington, to estimate age- and gender-specific rates of heterosexual partnership formation and dissolution. Our method for estimating these rates combines egocentric partnership data and imputation methods to minimize the bias imposed by including only recent partnerships.
METHODS
Study population
The study used data collected from a 2003-2004 random digit dialing (RDD) survey of English-speaking Seattle residents 18-39 years of age. The sampling frame and contact rates are described elsewhere (11,12). Of the 2,580 eligible individuals contacted, 1,194 (46.3%) provided verbal consent and completed the interview. The response rate was 24.1%, which was calculated by the following formula (13):
The assumed eligible probability (0.424) among individuals for whom it was impossible to determine eligibility was calculated by dividing the number of participants who were (2,671) or may have been (5,383) eligible by the total fielded sample (18,995). All study procedures were approved by the institutional review boards at the University of Washington and the University of Michigan.
Survey instrument and measures
The survey instrument collected sexual history data including age at sexual debut, lifetime number of sexual partners, and date of first and last sex for up to 5 most recent partners. We used these dates to estimate the age at the start and end of each partnership. A question asked about the two most recent partnerships determined whether a partnership was ongoing at the time of interview; we assumed all other partnerships had dissolved. (<1% of participants indicated that their second most recent partnership was ongoing.)
For partnership start and end dates with missing elements, we made the following assumptions. Among partnerships with only missing days, we randomly assigned a day (1-28) if the partnership began and ended in different months. If the partnership began and ended in the same month or the participant indicated in a separate question that the partnership lasted for <4 weeks, we assumed a 7-day duration, which was the average duration for terminated partnerships with complete date data lasting <1 month. Among partnerships with missing months, we randomly assigned a month if the partnership began and ended in different years. If the partnership began and ended in the same year, we assumed a 67-day duration, which was the average duration for terminated partnerships with complete date data lasting <1 year. For the 3rd-5th most recent partners only, the survey asked the participant to self-report the partnership duration. We estimated an end or start date if these partnerships were missing years and the participant provided the complimentary date and partnership duration. We excluded partnerships if the end date preceded the start date (<1% of partnerships).
Exclusions and statistical methods
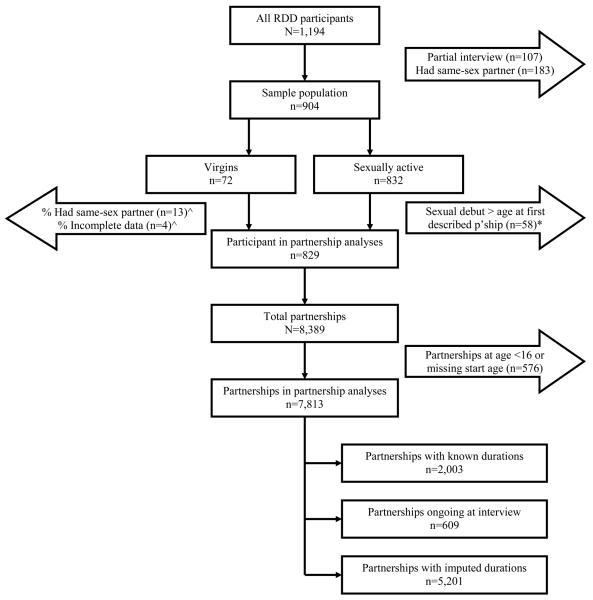
The study analysis included data from 829 (69.4%) of 1,194 participants. Most of the 365 excluded participants either had incomplete interviews (29.3%) or reported same-sex partnerships (50.1%) (Figure 1). We excluded participants who reported same-sex partnerships since there were too few to provide stable age- and gender-specific rates.
Figure 1.
Inclusion and Exclusion Criteria for Partnership Analyses, Heterosexual Seattle Adults Age 18-39 in a 2003-2004 Random Digit Dialing (RDD) Survey. ^Among the 72 participants who had no history of sexual activity, we assumed that 13 (17.6%) and 4 (7.0%) would have a same-sex partner or provide insufficient data, respectively, and excluded these 17 participants at random. *In the observed-plus-imputation analyses, we excluded 58 participants whose age at sexual debut was either the same as or older than the earliest described partnership. In other words, there was no time between sexual debut and the start of the earliest described partnership in which to impute the missing partners. Abbreviations: RDD, random digit dialing
We analyzed the partnership data using two approaches. First, we included only partnerships explicitly described in the survey (observed-only). This analysis included only new partnerships begun in the prior 10 years and calculated observed person-time as the time during which the participant provided data about new partnerships. We implemented this 10-year cutoff since the start and end dates of partnerships begun more than 10 years before the survey would likely be less accurate than more recent partnerships. (Analyses using 5- and 1-year cutoffs yielded similar results and are not presented.)
In our second analytic approach, we included partnerships explicitly described plus partnerships that were included in the participant's lifetime number of partners but not individually enumerated in the survey (observed-plus-imputed). This analysis used age at sexual debut, lifetime number of partners, and imputation to reconstruct the participant's sexual history. Participants who indicated <=5 lifetime partners provided their entire sexual history. If a participant explicitly described only one partner less than their lifetime total, we assumed that the “missing” partner began at the participant's age at sexual debut. To estimate the start age of each partnership among participants who reported >6 lifetime partners, we equally distributed the start dates of all remaining partnerships between the participant's age at sexual debut and the start of the earliest described partnership. We then imputed the partnership duration by randomly sampling with replacement from the durations of completely described partnerships matched by gender, age (+/−1 year), and maximum possible duration. Maximum possible duration for an imputed partnership was defined as the time between the start of the partnership and the date of last sex with the earliest described partnership.
We calculated partnership formation rates by dividing the total number of partnerships begun at each age by the total person-time observed at that age. We assumed that person-time for each participant began accruing at age 16. (We chose a uniform start date since using the age at sexual debut to define the start of person-time would artificially inflate the partnership formation rate during an individual's first year of sexual activity.) Person-time ended at the midpoint of each person's age at interview. Using Kaplan Meier techniques, we used data on partnership durations to calculate the probability of partnership dissolution at various time points. To produce 95% confidence intervals around our estimates of partnership formation and dissolution, we used bootstrap sampling (1000 iterations) and constructed intervals using the 25th and 975th ordered results.
The observed-plus-imputed analysis assumed that the imputed partnerships were equally distributed in time between a participant's age at sexual debut and the earliest described partnership in the survey. However, our data, in agreement with past studies (14), suggest that partnership formation rates decline with age. To address this, we conducted sensitivity analyses that imposed a distribution that backloads the imputed partnerships over time (i.e., closer to sexual debut). Specifically, we placed the n imputed partnerships for an individual at ages = age at sexual debut + gap*[(i-1)/n]^a for i=1…n, where gap is the interval between sexual debut and the first observed partnership. For the primary analysis, a=1; for sensitivity analysis A, a=2; for B, a=3; and for C, a=5.
We conducted all statistical analyses using Stata 9.0 (Stata Corporation, College Station, Texas) and R 2.4 (R Development Core Team, Vienna, Austria) software.
RESULTS
Study Population
Over one-half (54.2%) of the sample was female, and the average age was 29 years (Table 1). Participants were mostly representative of Seattle adults, although they were somewhat older and more likely to be white and to be highly educated.
Table 1.
Sample Characteristics of Seattle Adults Age 18-39 in a 2003-2004 Random Digit Dialing (RDD) Survey Compared to Year 2000 U.S. Census Data
| Seattle RDD (2003-2004) | U.S. Census | |||
|---|---|---|---|---|
| Completed Interviews [n=1,087] # (%) |
Partnership Analysis [n=829] # (%) |
Seattle 2000 % |
||
| Demographic Characteristics | ||||
| Gender | Male | 475 (43.7) | 380 (45.8) | 51.9 |
| Female | 612 (56.3) | 449 (54.2) | 48.1 | |
| Age | 18-24 | 222 (20.4) | 173 (20.9) | 28.0 |
| 25-29 | 309 (28.4) | 248 (29.9) | 25.9 | |
| 30-34 | 306 (28.2) | 235 (28.4) | 25.3 | |
| 35-39 | 250 (23.0) | 173 (20.9) | 20.7 | |
| Race/ ethnicity |
White | 822 (75.6) | 634 (77.0) | 67.8^ |
| Asian/Pacific Islander | 93 (8.6) | 75 (9.1) | 13.7^ | |
| Black | 51 (4.7) | 34 (4.1) | 6.5^ | |
| Hispanic | 54 (5.0) | 40 (4.9) | 6.7^ | |
| Other | 59 (5.4) | 40 (4.9) | 5.3^ | |
| Education | <High school diploma | 26 (2.4) | 19 (2.3) | 8.7* |
| High school diploma | 62 (5.7) | 52 (6.3) | 13.7* | |
| Some college/2-year degree | 305 (28.1) | 215 (25.9) | 32.7* | |
| Bachelors degree | 462 (42.5) | 367 (44.3) | 32.0* | |
| Graduate/professional degree | 231 (21.3) | 176 (21.2) | 12.9* | |
| Marital status |
Single | 658 (60.5) | 499 (60.2) | 57.7* |
| Married | 337 (31.0) | 268 (32.3) | 30.2* | |
| Separated | 32 (2.9) | 22 (2.7) | 4.7* | |
| Divorced | 58 (5.3) | 40 (4.8) | 7.2* | |
| Sexual Behavior Characteristics † | # (%) | |||
| In a current sexual relationship | 601 (77.6) | |||
| Age at sexual debut [mean (SD)] | 17.6 (2.9) | |||
| # sexual partners (lifetime) [mean (SD)] | 10.9 (14.0) | |||
| # sexual partners (last year) [mean (SD)] | 1.4 (3.7) | |||
Abbreviations: RDD, random digit dialing, SD, standard deviation
Race by Hispanic ethnicity by age data not available. Used race by Hispanic data (for all ages) to estimate % Hispanic
Census figures based on 18-44 year olds
Among sexually active heterosexuals included in partnership analyses (n=774)
A total of 40.2% of sexually active participants included in the observed-plus-imputed analysis described all of their lifetime sexual partners, 4.8% described all but one partner, and the remaining 55% had >6 lifetime partners or did not describe >1 partner. Partnership start and end dates were complete or missing only the day for 79.1% of partnerships. Only 16.1% were missing start or end months and 4.8% of partnerships were missing a start or end year.
Participants reported a total of 8,389 lifetime partnerships: 576 began before age 16 and were excluded from further analyses; 609 were ongoing at the time of interview; and 2,003 had complete date and duration data. The 609 ongoing partnerships remained in the analysis and were censored at the date of last sex. We used durations from these 2,003 partnerships to impute durations for the 5,201 imputed partnerships.
Formation of New Partnerships
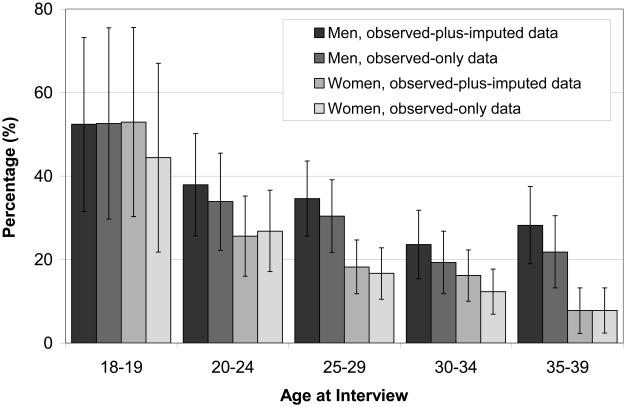
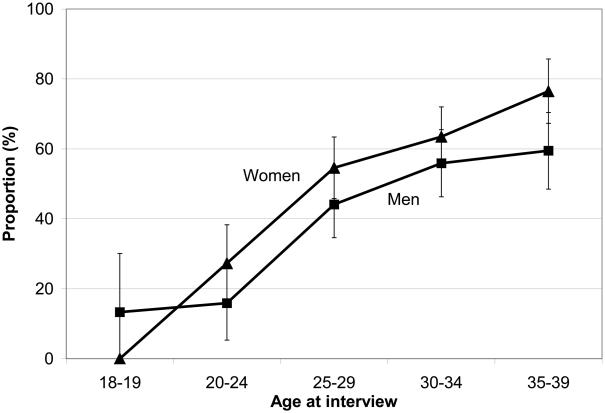
Over half of the 18-19 year old participants reported forming a new sexual partnership in the past year (Figure 2). This proportion decreased to 20-30% among those in their 20s and 15-20% among those in their 30s. These data can also be used to describe the proportion of the population that had ceased forming new partnerships. Among participants age 20-24, 27.3% of women and 15.9% of men did not report a new partner in the past 3 years (Figure 3). Among participants age 35-39, 76.5% of women and 59.5% of men had not formed a new partnership in the past 3 years, while 63.5% and 46.8%, respectively, reported no new partnerships in the past 5 years (data not shown). There were few differences between the observed-and-imputed data and the observed-only data.
Figure 2.
Proportion of Participants Who Formed a New Partnerships in the Past Year Among Heterosexual Seattle Adults Age 18-39 in a 2003-2004 Random Digit Dialing (RDD) Survey; N=1,194 enrolled, 829 participants included in observed-plus-imputed analyses, 877 participants included in observed-only analyses. Key: Men, observed-plus-imputed data: solid; Men, observed-only data: vertical lines; Women, observed-plus-imputed data: diagonal lines; Women, observed-only data: horizontal lines. Observed-only data include partnerships explicitly described in the survey, while observed-plus-imputed data also include partnerships whose start dates and durations were estimated using data from other questions, imputation, and durations sampled from partnerships with known durations. Error bars reflect 95% confidence intervals.
Figure 3.
Proportion of Participants Who Did Not Report Forming a New Partnership in the Past 3 Years Among Heterosexual Seattle Adults Age 18-39 in a 2003-2004 Random Digit Dialing (RDD) Survey; N=1,194 enrolled, 829 participants included in observed-plus-imputed analyses. Key: Men, squares; Women, triangles. Error bars reflect 95% confidence intervals.
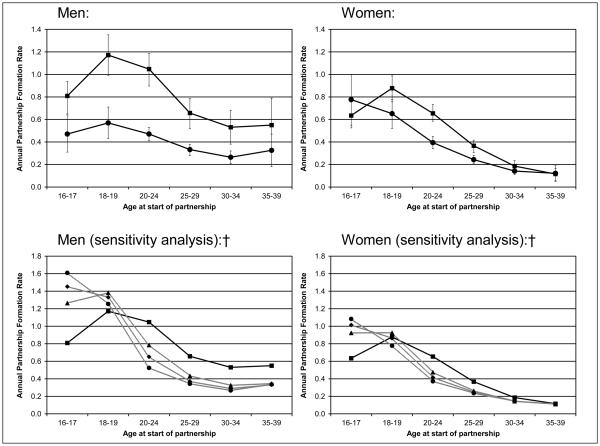
The overall partnership formation rate among women was 0.54 (95% confidence interval (CI): 0.49, 0.59) new partners per year using the observed-and-imputed data and 0.29 (95% CI: 0.27, 0.32) using the observed-only data. Among men, these rates were 0.85 (95% CI: 0.74, 0.97) and 0.37 (95% CI: 0.34, 0.41), respectively. At all ages, men reported higher rates of new partnership formation than women, though the overall pattern was very similar between the two sexes (Figure 4). Using the observed-and-imputed data, women had a peak rate of 0.90 (95% CI: 0.76, 1.04) partnerships per year at age 19, which decreased throughout the 20s and stabilized at 0.1-0.2 in the 30s. Rates for men peaked at age 20 with 1.36 (95% CI: 1.08, 1.64) partnerships per year and declined to approximately 0.5 throughout the 30s. The observed-only data showed a relatively similar trend, although rates were lower at all ages since these data tend to oversample longer, steady partnerships. In sensitivity analyses, redistributing the imputed partnerships so that a greater proportion occurred at younger ages when partnership formation rates are typically highest resulted in higher partnership formation rates among men and women at ages 16-17, similar rates at ages 18-19, and somewhat lower rates at age >20.
Figure 4.
Age-Specific Partnership Formation Rates Among Heterosexual Seattle Adults Age 18-39 in a 2003-2004 Random Digit Dialing (RDD) Survey; N=1,194 enrolled, 829 participants included in observed-plus-imputed analyses, 877 participants included in observed-only analyses. Key for top panels: Observed-plus-imputed data, squares; Observed-only data, circles. Key for bottom panels: Observed-plus imputed data, squares and solid line; Sensitivity analysis A, triangles and dotted line; Sensitivity analysis B, diamonds and dotted lines; Sensitivity analysis C, circles and dotted line. Observed-only data include partnerships explicitly described in the survey and are restricted to only new partnerships reported in the past 10 years. Observed-plus-imputed data combine all observed data plus partnerships whose start dates and durations were estimated using data from other questions, imputation, and durations sampled from partnerships with known durations. †For each sensitivity analysis, we imposed different distributions of the imputed partnerships and recalculated the partnership formation rates. The observed-plus-imputed data assumes that the imputed partnerships were equally distributed in time between a participant's age at sexual debut and the earliest described partnership in the survey. Sensitivity analyses A-C impose a distribution that backloads the imputed partnerships over time (i.e., closer to sexual debut). Specifically, we placed the n imputed partnerships for an individual at ages = debut + gap*[(i−1)/n]^a for i = 1 … n, where debut is the age at sexual debut and gap is the interval between sexual debut and the first observed partnership. For sensitivity analysis A, a=2; for sensitivity analysis B, a=3; and for sensitivity analysis C, a=5. Error bars reflect 95% confidence intervals.
Because sexual partnerships can be concurrent, or overlapping in time, we estimated the rate of partnership formation during an extant partnership among participants who provided complete partnership start and end dates (i.e., missing nothing or missing only days) for up to 5 recent partnerships (n=597). (Although this sample of individuals was somewhat younger than those who were excluded, there was no difference between the groups in the number of lifetime partners or partners reported in the past year.) At nearly all ages, participants reported starting a new partnership during approximately 15% of ongoing partnerships. The rate of partnership formation among women in an extant partnership was 6 per 100 partnership-years, while the formation rate among women not in a partnership was 31 per 100 nonpartnership-years (ratio=0.19). The respective rates among men were 10 per 100 partnership-years and 35 per 100 nonpartnership-years (ratio=0.29).
Partnership Dissolution
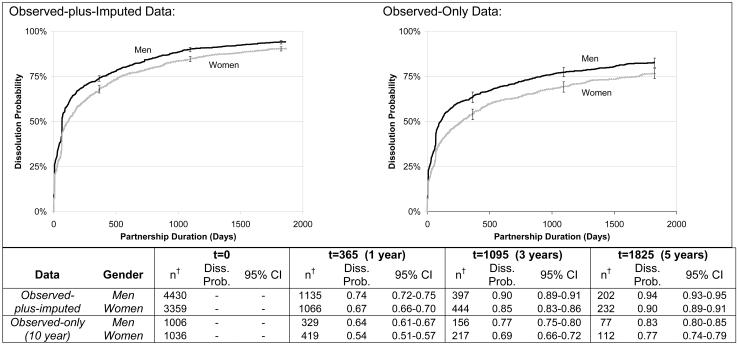
In the observed-plus-imputed analysis, 23.7% of partnerships ended within 1 week and 51.2% ended within 12 weeks. Male-reported partnerships had a higher dissolution rate than female-reported partnerships (Figure 5). The median partnership duration among men was 10 weeks, while the median for women was 17 weeks. At 1 year, 73.9% (95% CI: 72.3, 75.4%) of male-reported partnerships and 67.4% (95% CI: 65.8%, 69.9%) of female-reported partnerships ended, and 90.1% (95% CI: 88.8, 91.2%) and 84.6% (95% CI: 83.2, 86.1%) of male- and female-reported partnerships had dissolved by 3 years. (The large jumps near 1 week and 10 weeks are artifacts of systematically imputing 7- and 67-day durations as average durations.) The observed-only data reflect similar temporal trends but somewhat lower dissolution probabilities.
Figure 5.
Partnership Dissolution Probabilities Among Heterosexual Seattle Adults Age 18-39 in a 2003-2004 Random Digit Dialing (RDD) Survey; N=1,194 enrolled, 829 participants included in observed-plus-imputed analyses, 877 participants included in observed-only analyses. Key: Men, solid line; Women, shaded line. Observed-only data include partnerships explicitly described in the survey and are restricted to only new partnerships reported in the past 10 years. Observed-plus-imputed data combine all observed data plus partnerships whose start dates and durations were estimated using data from other questions, imputation, and durations sampled from partnerships with known durations. †Number of partnerships at the start of each time point. Error bars reflect 95% confidence intervals. Abbreviations: CI, confidence interval, Diss Prob., dissolution probability.
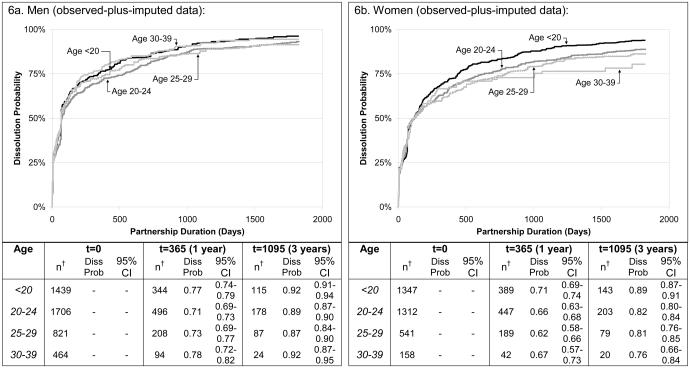
The probability of partnership dissolution was not consistently associated with the age at which the partnership was formed. Using the observed-plus-imputed data, 77% of partnerships formed by men age <20 dissolved by 1 year, while 71%, 73%, and 78% of partnerships formed at age 20-24, 25-29, and ≥30, respectively, dissolved within a year (Figure 6a). Among women, the pattern was similar with respective age-specific estimates of 71%, 66%, 62%, and 67% (Figure 6b). Among female-reported partnerships, there was a linear trend between age and dissolution after 3 years, with partnerships formed by the youngest women the most likely to dissolve after 3 years (89%) and those formed by the oldest women the least likely to dissolve (76%). Among men, the dissolution probability after 3 years was 92% for both the youngest and oldest age groups.
Figure 6.
Partnership Dissolution Probabilities by Age and Gender Among Heterosexual Seattle Adults Age 18-39 in a 2003-2004 Random Digit Dialing (RDD) Survey; N=1,194 enrolled, 829 participants included in observed-plus-imputed analyses, 877 participants included in observed-only analyses. Key: Age <20 years, solid black line; Age 20-24 years, dark shaded line; Age 25-29 years, light shaded line; Age 30-39 years, solid grey line. †Number of participants at the start of each time point. Abbreviations: CI, confidence interval, Diss Prob., dissolution probability.
Finally, we calculated the probability of partnership dissolution in the context of concurrent partnerships. Among participants with complete start and end dates (observed data only), we identified all instances of overlapping partnerships and determined whether the extant or new partnership ended first. Among concurrent partnerships, 32% of the extant partnerships ended first (transitional), while 68% of the new partnerships began and ended entirely within the extant partnership (embedded). When concurrent partnerships were transitional, the existing partnership ended a median of 10 weeks after the new partnership began. Conversely, when the new concurrent partnership was embedded within an extant partnership, the new partnership ended a median of 3 weeks after it began; 23% of these new partnerships lasted 1 day and 44% for <=1 week.
DISCUSSION
We present estimates of age-specific heterosexual partnership formation and dissolution rates using data from a RDD survey of Seattle adults ages 18-39. Using a combination of observed and imputed data, partnership formation rates peaked early – 0.9 per year at age 19 for women and 1.4 per year at age 20 for men – and declined steadily through the 20s and early 30s. Formation of new partnerships among persons with extant partnerships was approximately 20% of the rate among persons without extant partnerships. Over half of all partnerships lasted <=12 weeks and nearly three-quarters dissolved within one year. By the time participants reached their early 30s, >50% had not formed a new sexual partnership in the preceding 3 years, suggesting that a large proportion of the heterosexual population had likely exited the pool of persons at substantial risk for STI by their late 20s (assuming their partners were monogamous).
Our partnership formation estimates fall within the range of existing estimates. Using population-based surveys of Norwegian adults and methods relatively similar to ours, Stigum et al. estimated that 18-25 and 26-35 year olds had 0.77 and 0.31 new partnerships a year, respectively (14). Using the same age groups as Stigum et al., our observed-plus-imputed findings are somewhat higher – 0.86 and 0.41 – and our observed-only findings are similar. Kretzschmar et al. used data from a national survey of Dutch adults and estimated a partnership formation rate of approximately 0.63 new partners per year, which is very similar to our overall rate of 0.54 (5). In contrast, Williams et al. used data from a survey of U.S. STD clinic attendees (15) and the National Health and Social Life Survey (4) and estimated that among persons age 20-24, male and female partnership formation rates were 2.32 and 2.01, respectively (6). The substantially higher rates found in the latter study may be a result of differences in the population studied. However, we think it is more likely that these differences stem from the assumption that all partnerships within a defined period were newly formed, despite the fact that some certainly formed prior to the reference period.
There are fewer published estimates of partnership dissolution rates. Kretzschmar et al. estimated that steady partnerships (lasting >=1 year), had a 0.0004 per day probability of ending; casual partnerships (lasting <1 year) had a 0.1 per day dissolution probability (16). Using similar methods, we found substantially lower dissolution probabilities of 0.0001 per day for steady partnerships and 0.035 per day for casual partnerships.
We presented most findings using both the observed and imputed data to highlight the different estimates provided by the two methodologies. As expected, the observed-only data result in longer partnership durations compared to the observed-plus-imputed analyses. Restricting our analyses to only the observed partnerships results in left-truncated data, where short partnerships which may have begun at the same time as longer partnerships are not captured in the survey. In other words, early partnerships are preferentially excluded from the observed-only data. The observed-only analyses are similar to published estimates, but the observed-plus-imputed methodology may be superior since it gives weight to highly sexually active individuals commensurate to their contribution to the total pool of partnerships in the population.
The observed-plus-imputed analyses have limitations. Longer duration partnerships are most likely to be included in surveys that collect partner-specific data. Thus, the age-specific pools of partnership durations from which we sampled may have been biased resulting in inflated partnership durations, particularly for partnerships initiated at young ages. However, for our imputations we sampled conditionally on the maximum possible duration, which should help minimize this bias. Likewise, our estimates of partnership formation rates in extant partnerships may be underestimates given that these analyses only included the observed data, which tend to oversample longer, steady partnerships. Also, we assumed that “missing” partnerships were equally distributed between sexual debut and the age at the earliest described partnership. Since our findings suggest that partnership formation rates peak early in a person's lifetime, our estimates for younger ages may underestimate the true rates. Indeed, compared to the primary findings, sensitivity analyses that redistributed (backloaded) the “missing” partnerships accentuate the peak formation rate at ages <20 and subsequent decline. Finally, to construct confidence intervals for our observed-plus-imputed estimates, we bootstrapped a dataset following a single imputation, which may have underestimated the variability of the estimates.
This study had other limitations. First, at the time of the survey, 5% of households were cell phone-only households, while 2% lacked any phone, and thus could not have been included in this study (17). Second, like most previous estimates, we used data from a cross-sectional survey. However, we used a participant's lifetime number of partners to derive our estimates, rather than just current or recent partners. Furthermore, our methods assume that the characteristics (e.g., durations) of current and recent partnerships reflect past sexual norms, although this limitation may be mitigated by the relatively narrow age range of participants. The ideal method for calculating partnership change rates would be to enroll a cohort of participants and prospectively enumerate the formation and dissolution of all partnerships during a relatively long follow-up, preferably a lifetime. Obviously, such a study would be difficult to conduct and might provide data of limited value if sexual behavior changed over calendar time. Third, we did not have data for partnerships formed after age 39. Given the current confluence of longer life expectancy, high divorce rates, and pharmacological treatment for erectile dysfunction, partnership formation rates may increase at older ages. Finally, these data did not provide a large enough sample size to calculate similar rates among homosexual or bisexual men and women.
Defining how partnership formation rates vary over time and differ within and between populations is critical to understanding and modeling of STI transmission dynamics (3). Our findings provide quantitative estimates of partnership formation and dissolution rates, including rates of concurrent partnership formation and dissolution. They highlight the dramatic extent to which high partner change is concentrated among the young, how a large proportion of partnerships include transient periods of concurrency, and how a majority of the heterosexual population, at least in Seattle, are probably at risk for STI during a relatively short period of their lives. The implications of these findings will be best understood as our results are incorporated into mathematical models of STI transmission. However, more immediately, they suggest that vaccines for STI may not need to induce very long lasting immunity, since most people remain at risk for a brief period of their lives (18). Our work also highlights the need to collect better, more comprehensive data on the long-term partnership formation patterns of diverse populations – including MSM and racial and ethnic minorities in the U.S. – in order to better explain the profound disparities observed in the occurrence of STI.
ACKNOWLEDGMENTS
This work was funded by Public Health – Seattle & King County, the Center for Molecular and Clinical Epidemiology of Infectious Diseases at the University of Michigan School of Public Health, and the University of Washington Center for AIDS and STD. SJN is supported by the University of Washington STD/AIDS Research Training Program (T32 AI007140) from the National Institutes of Health, USPHS. MRG is supported by the National Institute of Allergy and Infectious Diseases (NIH/NIAID R01 AI068107-01). PJW thanks the UK Medical Research Council for funding. Portions of these data were presented at the 17th Biennial Meeting of the International Society for Sexually Transmitted Diseases Research (ISSTDR) held July 29-August 1, 2007, in Seattle, WA (O-040). The authors thank Martina Morris for her helpful comments and Ken Tapia for his statistical support.
LIST OF ABBREVIATIONS AND ACRONYMS
- HIV
human immunodeficiency virus
- STI
sexually transmitted infection
- CI
confidence interval
- RDD
random digit dialing
Footnotes
Publisher's Disclaimer: This is a PDF file of an unedited manuscript that has been accepted for publication. As a service to our customers we are providing this early version of the manuscript. The manuscript will undergo copyediting, typesetting, and review of the resulting proof before it is published in its final citable form. Please note that during the production process errors may be discovered which could affect the content, and all legal disclaimers that apply to the journal pertain.
REFERENCES
- 1.Anderson RM, May RM. Epidemiological parameters of HIV transmission. Nature. 1988;333:514–9. doi: 10.1038/333514a0. [DOI] [PubMed] [Google Scholar]
- 2.Anderson RM, Garnett GP. Mathematical models of the transmission and control of sexually transmitted diseases. Sex Transm Dis. 2000;27:636–43. doi: 10.1097/00007435-200011000-00012. [DOI] [PubMed] [Google Scholar]
- 3.Morris M, Goodreau S, Moody J. Sexual Networks, Concurrency, and STD/HIV. In: Holmes KK, Sparling PF, Stamm WE, et al., editors. Sexually transmitted diseases. 4th ed. McGraw-Hill; New York: 2008. [Google Scholar]
- 4.Laumann EO, Gagnon JH, Michael RT, Michaels S. The Social Organization of Sexuality: Sexual Practices in the United States. University of Chicago Press; Chicago: 1994. [Google Scholar]
- 5.Kretzschmar M, van Duynhoven YT, Severijnen AJ. Modeling prevention strategies for gonorrhea and Chlamydia using stochastic network simulations. Am J Epidemiol. 1996;144:306–17. doi: 10.1093/oxfordjournals.aje.a008926. [DOI] [PubMed] [Google Scholar]
- 6.Williams JR, Jordan JC, Davis EA, Garnett GP. Suppressive valacyclovir therapy: impact on the population spread of HSV-2 infection. Sex Transm Dis. 2007;34:123–31. doi: 10.1097/01.olq.0000258486.81492.a2. [DOI] [PubMed] [Google Scholar]
- 7.Morris M, Podhisita C, Wawer MJ, Handcock MS. Bridge populations in the spread of HIV/AIDS in Thailand. Aids. 1996;10:1265–71. doi: 10.1097/00002030-199609000-00013. [DOI] [PubMed] [Google Scholar]
- 8.Brewer DD, Rothenberg RB, Muth SQ, Roberts JM, Jr., Potterat JJ. Agreement in reported sexual partnership dates and implications for measuring concurrency. Sex Transm Dis. 2006;33:277–83. doi: 10.1097/01.olq.0000204746.58160.c1. [DOI] [PubMed] [Google Scholar]
- 9.Koepsell TD, Weiss NS. Epidemiologic Methods: Studying the Occurrence of Illness. Oxford University Press; New York: 2003. [Google Scholar]
- 10.Burington B, Hughes JP, Whittington WL, et al. Estimating duration in partnership studies: issues, methods, and examples (submitted) doi: 10.1136/sti.2009.037960. [DOI] [PMC free article] [PubMed] [Google Scholar]
- 11.Aral SO, Patel DA, Holmes KK, Foxman B. Temporal trends in sexual behaviors and sexually transmitted disease history among 18- to 39-year-old Seattle, Washington, residents: results of random digit-dial surveys. Sex Transm Dis. 2005;32:710–7. doi: 10.1097/01.olq.0000175370.08709.72. [DOI] [PubMed] [Google Scholar]
- 12.Foxman B, Newman M, Percha B, Holmes KK, Aral SO. Measures of sexual partnerships: lengths, gaps, overlaps, and sexually transmitted infection. Sex Transm Dis. 2006;33:209–14. doi: 10.1097/01.olq.0000191318.95873.8a. [DOI] [PubMed] [Google Scholar]
- 13.American Association for Public Opinion Research Standard Definitions: Final Disposition of Case Codes and Outcome Rates for Surveys. 2006 [Google Scholar]
- 14.Stigum H, Magnus P, Harris JR, Samuelsen SO, Bakketeig LS. Frequency of sexual partner change in a Norwegian population. Data distribution and covariates. Am J Epidemiol. 1997;145:636–43. doi: 10.1093/oxfordjournals.aje.a009161. [DOI] [PubMed] [Google Scholar]
- 15.Garnett GP, Mertz KJ, Finelli L, Levine WC, Louis ME. The transmission dynamics of gonorrhoea: modelling the reported behaviour of infected patients from Newark, New Jersey. Philos Trans R Soc Lond B Biol Sci. 1999;354:787–97. doi: 10.1098/rstb.1999.0431. [DOI] [PMC free article] [PubMed] [Google Scholar]
- 16.Kretzschmar M, Welte R, van den Hoek A, Postma MJ. A comparative model-based analysis of screening programs for Chlamydia trachomatis infections. Am J Epidemiol. 2001;153:90–101. doi: 10.1093/aje/153.1.90. [DOI] [PubMed] [Google Scholar]
- 17.Blumberg S, Luke J. Wireless substitution: Early release of estimates from the National Health Interview Survey, July - December 2007. National Center for Health Statistics. 2008 Available from: http://www.cdc.gov/nchs/nhis.htm. May 13, 2008.
- 18.Scherer A, McLean A. Mathematical models of vaccination. British Medical Bulletin. 2002;62:187–199. doi: 10.1093/bmb/62.1.187. [DOI] [PubMed] [Google Scholar]


