

Abstract
Sensory representations are repeatedly transformed by neural computations that determine which of their attributes can be effectively processed at each stage. While some early computations are common across multiple sensory systems, they can utilize dissimilar underlying mechanisms depending on the properties of each modality. Recent work in the olfactory bulb has substantially clarified the neural algorithms underlying early odor processing. The high-dimensionality of odor space strictly limits the utility of topographical representations, forcing similarity-dependent computations such as decorrelation to employ unusual neural algorithms. The distinct architectures and properties of the two prominent computational layers in the olfactory bulb suggest that the bulb is directly comparable not to the retina alone, but also to primary visual cortex.
Keywords: chemotopy, decorrelation, contrast enhancement, high-dimensionality, normalization, glomerulus
The unique architecture of the olfactory system
Why is the neural architecture of the olfactory system structured as it is? The neural circuits of early sensory systems are faced with common computational problems such as gain control and decorrelation; however, the specific neural algorithms and underlying biophysical circuit mechanisms that solve these computational problems can be constructed quite differently from one another in service to the peculiar properties of each modality. Moreover, each successive stage of sensory processing within a given modality has unique capacities and limitations that depend on the architecture of stimulus representations at that stage and determine the processing tasks that can be effectively performed. Understanding the mechanics of sensory system function requires consideration across these different levels of analysis [1, 2], as well as assessment of the processing capacities and limitations at each stage of the cascade of representations that underlies sensation. Here I review the functional architecture and theoretical organization of the early olfactory system, emphasizing the structure of primary odor representations and their transformation within the olfactory bulb.
The transduction of odor stimuli by olfactory receptor proteins (ORs) expressed on the cilia of primary olfactory sensory neurons (OSNs) has been reviewed in detail elsewhere [3]. Briefly, the receptive fields of OSNs for odorants are largely conferred by the type of OR that they express, which in mice is likely to be a single allele of one receptor type out of 1000-1200 different available receptors [4, 5]. These receptive fields are coordinated for subsequent processing via the convergence of axons from OSNs expressing the same OR to the same target locations on the surface layer of the main olfactory bulb (MOB) [6], there forming discrete glomeruli that exhibit receptive fields determined largely by the properties of that OR (Figure 1a). Moreover, in the MOB of mammals, most neurons that extend their dendrites into glomeruli, including mitral cells and multiple types of periglomerular and tufted cells, do so into only a single glomerulus, generating a columnar architecture in the MOB that is based directly on OR receptive fields and extends even into the deep layers of the MOB [7]. Mitral cells that innervate the same glomerulus exhibit similar receptive fields [8]; these are largely inherited from the corresponding OR but also are transformed by multiple layers of intrinsic, functionally inhibitory lateral interactions within the MOB (Figure 1a). In this way, MOB columns architecturally resemble columns identified in other sensory cortices [9, 10].
Figure 1.

(a) Circuit diagram of the mammalian olfactory bulb. The axons of olfactory sensory neurons expressing the same odorant receptor type converge together as they cross the cribriform plate and arborize together to form glomeruli (shaded ovals) across the surface of the olfactory bulb. Several classes of olfactory bulb neuron innervate each glomerulus, including both principal neurons and intrinsic interneurons. Glomerular interneuron classes are heterogeneous, including olfactory nerve-driven periglomerular cells (PGo), external tufted cell-driven periglomerular cells (PGe), and multiple subtypes of external tufted cells (ET). Superficial short-axon cells (sSA) are not associated with specific glomeruli but project broadly and laterally within the deep glomerular layer, interacting with glomerular interneurons. Principal neurons include mitral cells (Mi), which interact via reciprocal connections in the external plexiform layer (EPL) with the dendrites of inhibitory granule cells (Gr), thereby receiving recurrent and lateral inhibition. Middle/deep tufted cells (not depicted) constitute another, less understood class of olfactory bulb principal neurons noted for their relative lack of an inhibitory surround. Both of these principal neuron types project divergently to several regions of the brain, though the projection profiles of the two classes differ [71, 90]. A sparse, heterogeneous population of inhibitory interneurons known collectively as deep short-axon cells [91] also is not depicted. OE, olfactory epithelium (in the nasal cavity); GL, glomerular layer; EPL; external plexiform layer; MCL, mitral cell layer; IPL, internal plexiform layer; GCL, granule cell layer. Filled triangles denote excitatory (glutamatergic) synapses; open circles denote inhibitory (GABAergic) synapses. (b) Schematic depiction of decorrelation between two overlapping representations (α and β), depicted in one dimension (left panel). Canonical “Mexican-hat” decorrelation (upper right panel) generates an explicit inhibitory surround in which the edges of the representation are inhibited below baseline, yielding a sharp reduction in overlap among similar representations. This computation is performed by lateral inhibition in the retina and inferior colliculus, and by the nontopographical model of olfactory receptive field decorrelation. A lesser degree of decorrelation can also be obtained by broad, nonspecific inhibition, including lateral inhibition with an unstructured surround [45, 46] (lower right panel), although this imposes a general reduction in activity across the entire representation. This operation is the general result of lateral inhibitory mechanisms as studied to date in the olfactory bulb. While both computations can effect a measurable decorrelation, the two transformations differ substantially. (c) Replication of experimental data from [23] by the nontopographical model [26] demonstrating Mexican-hat decorrelation in mitral cells among the responses to similar odorants (3-carbon through 11-carbon aliphatic aldehydes). Periodic bursts of spikes reflect background activity evoked by the respiration cycle; a 2 second odorant stimulus was presented during the third inhalation (black bar; green shading). The odorant hexanal ((6)CHO) is near the center of this mitral cell's receptive field and evokes the strongest activation; pentanal and heptanal also excite the cell, whereas butanal ((4)CHO) and octanal ((5)CHO) are within its inhibitory surround, and hence evoke a net inhibition. The mitral cell is unresponsive to the other four odorants. The right panel illustrates how the Mexican-hat function maps onto the trajectory through odor similarity space defined by the homologous odor series. Plus sign connotes excitation; minus sign connotes inhibition. Figure adapted from ref. [26].
ORs are ordinary G protein-coupled receptors (GPCRs) [11], remarkable only in their diversity and in their direct exposure to the vast complexity of the external chemical environment. Like most GPCRs, they have moderately broad receptive fields, binding to a range of full and partial agonists with various ligand-receptor affinities and efficacies [12, 13], and exhibit graded levels of activation to increasing ligand concentrations [14]. Unlike most other GPCRs, which commonly exist in highly regulated internal environments containing only a single effective ligand, these broad receptive fields are an integral part of normal function in ORs. Odor stimuli – even odors comprising only one type of molecule – nearly always activate multiple OR types to differing degrees such that the profile of activation levels across all glomeruli is characteristic of a given odor stimulus. Structurally and perceptually similar odorants tend to activate correspondingly greater numbers of glomeruli in common [15, 16], suggesting that overlapping neuronal representations in the periphery underlie perceptual similarity in olfaction much as they do in, for example, tonotopically-organized auditory structures. Unlike auditory tonotopy, however, the physical mapping of glomeruli across the MOB with respect to the overlap in their receptive fields – chemotopy – is far from clear.
Similarity-based topographical mapping in sensory systems
In some sensory systems, neurons with similar receptive fields are positioned correspondingly closely to one another, creating an intrinsic topographical organization that facilitates the post-transduction processing of computations that depend on these receptive field similarities. In both auditory tonotopy and visual retinotopy, for example, this organization enables neurons with similar receptive fields to be reliably identified by virtue of their physical proximity, thereby greatly simplifying the process of accurately targeting selective projections between similarly-tuned neurons. Perhaps the most prominent of these similarity-dependent computations is decorrelation, the controlled reduction in overlap among neurons' receptive fields, or, equivalently, in the mutual information that their activity represents. Decorrelation is instantiated in a variety of contexts in the brain, notably underlying efficient coding and neural data compression [17-19], but in early sensory processing it serves as contrast enhancement, sharpening sensory representations while emphasizing their boundaries [20]. In the retina and inferior colliculus, the topographical mapping of receptive field similarity enables decorrelation (a computational-level transformation in Marr's levels-of-analysis framework; [1, 2]) to be performed by nearest-neighbor lateral inhibition (an algorithm in that same framework) [21, 22]. That is, because physically neighboring neurons can be relied upon to exhibit correspondingly similar receptive fields, lateral inhibitory projections will selectively inhibit similarly-tuned neurons. This computation canonically yields a “Mexican-hat” decorrelation function in which neurons are most strongly and selectively inhibited when they are in the immediate surround of activated neurons – i.e., when their receptive fields overlap only modestly or partially with the pattern of sensory stimulation (Figure 1b). Notably, this same canonical function has been observed in olfactory bulb mitral cells, appropriately with respect to an axis of chemical similarity [23] (Figure 1c). These results indicate that the olfactory system is utilizing a similar computational transformation as these other sensory systems. However, owing to the physical properties of the olfactory modality, the underlying algorithm that mediates this transformation differs.
Disordered chemotopy in the olfactory bulb
In contrast to visual retinotopy and auditory tonotopy, the physical proximity of MOB glomeruli does not predict the similarity of their receptive fields [24]. Hence, olfactory chemotopy of the sort that could facilitate similarity-dependent computations does not exist in the MOB. While this result was predicted by theoretical modeling [25, 26], it appears initially at odds with other work reporting that odor representations in the MOB are chemotopically mapped [16, 27]. Confusion in the literature about the meaning and implications of MOB chemotopy hinges on the spatial scale at which it is assessed. Fine-scale chemotopy studies [24, 28] resolve activity in individual glomeruli and compare the receptive field and physical location of each glomerulus to that of every other glomerulus under study. Coarser-scale studies may utilize experimental techniques that do not resolve individual glomeruli, or may simply analyze their data broadly, e.g., by identifying regions of the MOB that tend to respond more prominently to a certain group of odorants, despite the additional presence of glomeruli within each region that exhibit dissimilar receptive fields [16, 27]. This latter approach can reveal interesting nonuniformities in the distribution of glomerular receptive fields, notably the tendency in rats (but perhaps not mice) for heavier molecules to be mapped more ventrally in the bulb [29, 30], likely owing to the physics of odorant deposition in the rat's intricate airway [31]. However, coarse-scale mapping also effectively masks the presence of inactive glomeruli in favor of nearby active glomeruli, resulting in overestimation of the breadth and clustering of odor-evoked activity. For purposes of similarity-dependent computation, the important question is whether the proximity of any two glomeruli (or columns) reliably predicts the overlap in their receptive fields; this question is addressed only by fine-scale chemotopy studies, and the answer is no [24].
Indeed, theoretical considerations rule out the very possibility of fine-scale, functional chemotopy in olfaction [25, 26]. Briefly, for proximity along the two-dimensional surface of the MOB to reliably reflect odor similarity, all of the possible variance in odor qualities must reduce to a maximum of two principal components (akin to the two spatial dimensions of retinotopy or the single dimension of auditory frequency). The sheer diversity of odorant stimuli clearly violates this constraint. Specifically, the metric for olfactory similarity is based on profiles of ligand-receptor potency across glomeruli, with the highest-potency odor ligands for each OR type comprising the center of its receptive field. Consequently, the “surround” for any given OR comprises all odor ligands with weaker potencies for that receptor, irrespective of the many and diverse ways in which molecular structural differences in these ligands could reduce the affinity or efficacy of their receptor interactions. These many different possible means of increasing dissimilarity correspond mathematically to a high-dimensional similarity space and impose fundamental constraints on how the olfactory system can and cannot effect standard sensory transformations such as decorrelation. For example, similarity spaces with dimensionalities higher than two cannot be continuously mapped onto a two-dimensional surface such as that of the MOB [32, 33]; instead, they will yield patchy, discontinuous maps in which proximity cannot be relied upon to reflect similarities in receptive fields [26]. Indeed, glomerular organization itself – a highly patchy, discontinuous map – may just be the simplest means of mapping a high-dimensional modality onto the brain; notably, glomerular architectures have evolved independently in vertebrate and protostome olfactory systems [34] as well as among the chemosensory neurons of scorpion pectine organs [35]. Discontinuities in representational maps are common across modalities [36], particularly in higher-order, heterotopic representations that incorporate additional stimulus attributes into sensory representations [17, 37-39]. Lacking a continuous topographical representation in the MOB, then, by what algorithm(s) could similarity-dependent computations such as decorrelation be performed on odor representations?
Algorithms for decorrelation in the olfactory bulb
Decorrelation with respect to odorants' chemical similarities has been observed in the Mexican-hat response properties of mitral cells [23] (Figure 1c). Several algorithms have been proposed to mediate this computation in the MOB, falling into three broad classes: (1) classical, nearest-neighbor lateral inhibition, (2) lateral inhibitory networks with different topologies, and (3) entirely local, nontopographical mechanisms.
Lateral inhibition in the olfactory bulb was first proposed by Rall and colleagues [40] on the basis of their anatomical description of the lateral inhibitory circuitry of the MOB external plexiform layer (EPL; Figure 1a). In this layer, the lateral dendrites of activated mitral cells excite the dendrites of granule cells, which in turn inhibit the lateral dendrites of the same and other mitral cells (reviewed in [41]). This compelling anatomy, along with its explicit analogies to retinal circuitry, has dominated theoretical interpretations of bulbar function such that nearest-neighbor lateral inhibition can be considered the classical model of MOB decorrelation [42]. Some variants of this classical model have suggested that nearest-neighbor lateral inhibition operates in the glomerular layer, rather than the EPL, via the lateral axonal projections of periglomerular cells [43-45]. However, despite the apparently appropriate anatomical circuitry in both layers, there is no evidence supporting the hypothesis that nearest-neighbor lateral inhibition mediates decorrelation in the MOB.
Some reports describing “center-surround” functional organization in the MOB do not distinguish nearest-neighbor inhibition from nonspecific inhibition across the MOB in their definition of “surround” [45, 46]; indeed, some of these explicitly demonstrate that functional inhibition is not localized to an immediately surrounding region [46]. Other studies have interpreted the effects of GABA-A receptor blockade as evidence of lateral inhibition [23, 47], although the experiments performed could not differentiate between lateral and local (within-column) inhibition, or between granule cell-mediated inhibition in the EPL and periglomerular cell-mediated inhibition in the glomerular layer. Finally, two additional studies have described proximity-dependent anatomical features in the MOB that might suggest privileged near-neighbor interactions. First, a spatially localized lateral projection network has been described that comprises superficial short-axon (sSA) cells and other glomerular-layer interneurons (Figure 1a); its relatively localized lateral projections appear to mediate center-surround interactions among glomeruli [48]. Interestingly, however, theoretical study of this anatomically center-surround network suggests that small-world network effects could render it functionally nonlocalized – i.e., computationally equivalent to an all-to-all coupled network capable of computing a global average of MOB activity [25]. Of course, there is substantial metabolic advantage in implementing the smallest and most localized network possible that remains capable of mediating such global effects [49]. The existence of sSA cells consequently does not constitute strong evidence for functionally nearest-neighbor computations in the MOB.
Second, mitral cell lateral dendrites project laterally into the surrounding EPL, initially seeming to form a classical inhibitory surround (Figure 1a). However, these projections are extensive enough to suggest that lateral interactions among MOB columns are not substantially limited by physical proximity [7, 41]. Electrophysiological studies have reported a distance-dependent reduction in the amplitude of regenerative action potentials along these dendrites [47, 50]; however, analogous studies using calcium imaging show no such decrement [51-53]. Moreover, recent work using a retrograde transsynaptic tracer, believed to cross synapses with an efficiency reflecting the strength of the synaptic connection, does not support a center-surround interpretation. Rather, these data reveal a patchy, discrete, distance-independent matrix of columnar interactions that both emphasizes the utility of the MOB column concept and suggests that the strengths of lateral interactions in the EPL are independent of distance [7], a result supported by electrophysiological data [28].
Recognizing the implications of these data, a second class of lateral inhibitory models has been developed that avoids the limitations of strictly nearest-neighbor interactions [54-56]. The central principle of such models is that the strength of lateral inhibitory connections in the EPL between mitral cells of different MOB columns correlates with the overlap in their receptive fields in a proximity-independent, functionally high-dimensional manner. While a promising solution in principle, current evidence suggests that the effects of lateral interactions among MOB columns do not correlate with the similarity of their receptive fields [28]. These data argue against the capacity of EPL lateral inhibition to mediate the decorrelation function observed in mitral cell responses to homologous series of odors (Figure 1c) [23]. However, as discussed below, recent evidence suggests that this layer may mediate a distinct form of decorrelation among higher-order or acquired odor attributes.
The third class of algorithm eschews targeted lateral inhibition entirely. Rather, glomerular-layer circuit elements are identified that enable each glomerulus in isolation to construct its own inhibitory surround, rendering the locations of other glomeruli irrelevant for purposes of decorrelation while replicating the experimental results previously attributed to lateral inhibition in the MOB (Figure 1c) [26]. Briefly, this nontopographical theory proposes that a subclass of periglomerular (PG) cells, receiving direct OSN excitation and inhibiting the apical dendrites of coglomerular mitral cells, is more sensitive to afferent input than these coglomerular mitral cells and hence will respond more strongly to odors while otherwise inheriting an identical chemoreceptive field from the same convergent OSN population (Figure 2a). An appropriate subclass of PG cells, previously identified via electron microscopy [57-59], has since been characterized electrophysiologically; these are now referred to as olfactory nerve-driven PG cells (PGo; Figure 1a, 2b) [60]. Moreover, it has recently been confirmed using calcium imaging that these PG cells are selectively activated at low afferent input levels that evoke no apparent activity in their coglomerular mitral or external tufted cells, and that PG cell-mediated inhibition is capable of suppressing mitral cell action potentials [61].
Figure 2.

Illustration of the nontopographical model for olfactory receptive field decorrelation. (a) Level of activation of selected MOB neurons as a function of ligand-receptor potency in its presynaptic OSN population. All response profiles depicted are from neurons innervating the same glomerulus. Negative values of neuronal activation connote inhibition. Odors with very weak potencies for the OR in question evoke no OSN activity and hence no mitral cell activity. Increasing the ligand-receptor potency to the point where it evokes OSN activity begins to excite PGo neurons, which owing to their high input resistance and small gemmule volume respond strongly to even weak inputs and deliver local intraglomerular inhibition onto mitral cells. Moderate ligand-receptor potencies begin to also directly activate mitral cells (Miin), but this excitation is overpowered by the inhibition received from the more strongly activated PGo neurons, which shunt away depolarizing current such that the overall net response of mitral cells (Miout) is inhibitory. Strong ligand-receptor potencies excite mitral cells more strongly, overwhelming the capacity of PGo inhibition to impair spike generation and hence evoking action potentials in mitral cells. The result is that mitral cells exhibit an excitatory response to high-potency odorant ligands, and an inhibitory response to odorant ligands of moderate potency – i.e., to the “surrounding” region in a space defined by odor quality, as illustrated in Figure 1c. Figure adapted from ref. [26]. (b) Illustration of the triune synapse at which an OSN excites a mitral cell and PGo cell gemmule in parallel, and the PGo cell immediately inhibits the mitral cell. This synaptic triad is the basis for nontopographical intraglomerular inhibition proposed to mediate decorrelation among similar OR receptive fields.
Based on this intraglomerular architecture, the nontopographical model predicts that for any given glomerular column, inhibition of mitral cells will predominate when the odor ligand is of intermediate potency, such that PGo cells are substantially activated but mitral cells are not, generating a true inhibitory surround in a high-dimensional odor similarity space that is intrinsically defined by ligand-receptor potency. The excitatory center of the mitral cell's receptive field corresponds to a strong ligand-receptor potency, such that the mitral cell's direct activation by OSNs overpowers its PGo-mediated inhibition (Figure 2a). Notably, in this model, mitral cells are more strongly inhibited by intermediate-potency ligands than they are by low-potency ligands, generating a true inhibitory surround [23] as opposed to a relatively unstructured, nonspecific inhibition that can provide only weak decorrelation effects (Figure 1b). The results of this model directly replicate the inhibitory surround observed in mitral cell responses that was previously attributed to lateral inhibition, provided that changes in odor concentration are normalized or otherwise regulated so as to prevent the broad overpowering of PG cell inhibition by increasing odor concentration (the abscissa of Figure 2a also can reflect concentration). Indeed, the response profiles of mitral cells imply the existence of just such a normalizing process.
Global normalization
One of the clearest transformations between OSN properties and mitral cell properties is that higher odorant concentrations lead to broader representations and monotonically greater activity among OSNs and their axon terminals [62-64], but not among mitral cells, which do not reliably exhibit monotonic increases in firing rate as a function of increasing odor concentration. Rather, as odor concentration increases, mitral cells exhibit a number of qualitatively different response profiles: for example, they may exhibit relatively constant levels of activity, adjust the temporal distribution of their action potentials (generally towards shorter latencies), or transition from excitation at lower odor concentrations to being inhibited at higher odor concentrations [65-69]. Notably, those mitral cells that do monotonically increase their firing rate in response to higher odorant concentrations are reported to be the strongest-responding cells to the odor in question – i.e., those for which the odorant is in the excitatory center of their receptive fields [70]. These diverse response profiles are consistent with the output of a decorrelation computation (Figure 1b), in which the activity of mitral cells stimulated with odorants comprising the central excitatory peaks of their receptive fields are predicted to increase in intensity with higher odorant concentrations, whereas mitral cells stimulated with odorants in the shoulders of their receptive fields will exhibit only modest changes in their response patterns with concentration changes, and mitral cells stimulated with odorants near the edges of their excitatory receptive fields will instead become inhibited at higher concentrations.
These physiological data reveal the presence of one or more normalization mechanisms operating at the level of the first synapse, such that the absolute variability in mitral cell response intensities is limited and changes in odor stimulus properties will excite some mitral cells while inhibiting others [65-69] (in principle, normalization implies that the mean population activity among mitral cells remains roughly constant). Normalization enables relational representations, in which the relative pattern of activity among mitral cells is the best predictor of odor quality, and facilitates odor recognition irrespective of concentration [25]. (Interestingly, middle tufted cells, a separate class of projection neuron in the MOB often considered together with mitral cells, receive less intrinsic inhibition than mitral cells and are consequently more consistently excited by higher odor concentrations [71]). The mechanisms of olfactory normalization among mitral cells, however, remain a subject of study.
The broad concentration-response functions provided by OSN populations [72] are compressed in several ways by MOB circuitry, notably via the presynaptic inhibition of OSN terminals [73]. This compression, like that observed in other cortices [74], is probably essential to enable the limited dynamic range of mitral cells to encode sensory information across wide ranges of odorant concentration. True population normalization, however, requires integration of the activation levels across MOB columns so that an appropriate level of inhibition can be delivered to each column. Theoretical modeling [25] has suggested that such a normalization effect can be mediated in the MOB by a lateral excitatory network in the deep glomerular layer interconnecting sSA and external tufted (ET) cells (Figure 1a) [48]. Specifically, this network has been proposed to deliver a globally averaged level of afferent activation onto a second class of PG cells; these PGe cells are driven primarily by ET cells and inhibit their coglomerular mitral cells [60]. In the model, activation of PGe cells by the ET/sSA cell network inhibits all mitral cells in proportion to the global average of all olfactory afferent input activity, normalizing odor representations so as to emphasize relational rather than absolute levels of afferent excitation [25]. Whereas lateral excitatory networks, if sufficiently densely interconnected, have the inherent property of distributing excitation relatively uniformly across their membership even if the initial (afferent) excitation is heterogeneous, the ET/sSA network is only moderately dense and is localized in its connectivity (Figure 3a) [48]. However, sSA axonal profiles include a substantial minority of long-range projections, theoretically sufficient to evoke small-world effects [75] such that the measured connectivity in this network is functionally equivalent to an all-to-all matrix of connections, but at a greatly reduced metabolic cost (Figure 3b) [25]. An important implication of this finding is that center-surround anatomical profiles do not necessarily imply center-surround functional computations.
Figure 3.
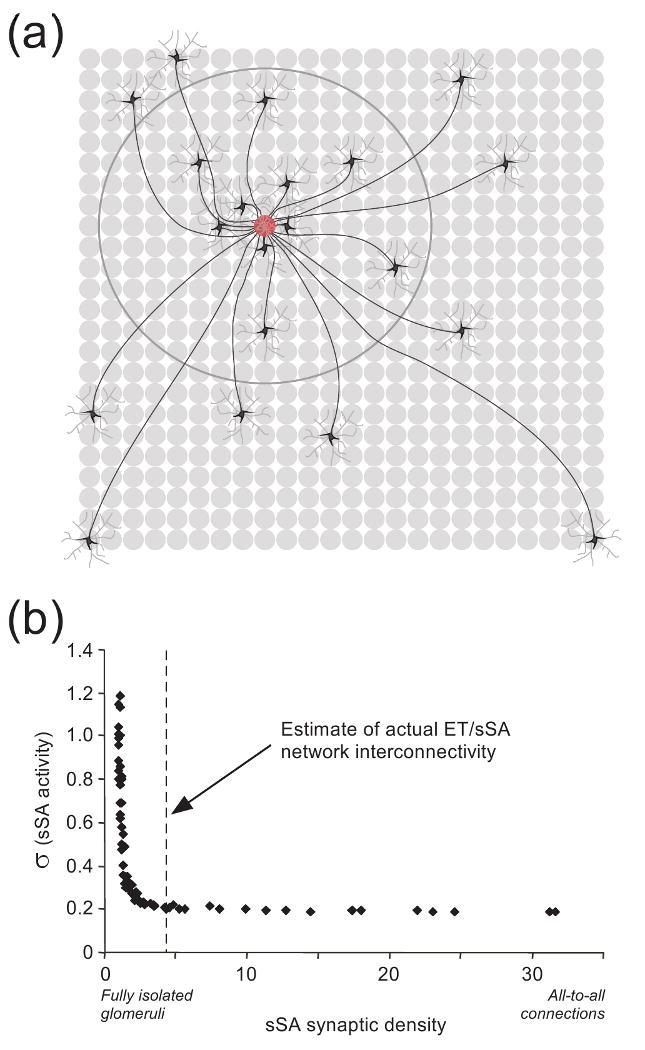
Normalization of mitral cell gross activity levels via the external tufted/superficial short-axon cell (ET/sSA) network. (a) Schematic depiction of lateral connectivity in the deep glomerular layer via sSA cells [48]. Dye injections into single glomeruli (red glomerulus) indicate that ∼50 sSA neurons project axons to a given glomerulus (twenty sSA neurons are depicted here); furthermore, whereas sSA cell axons branch extensively, for clarity only one axonal branch per sSA neuron is depicted here. The dendritic arbors of sSA neurons extend across a small number of glomeruli (depicted as light grey arbors around each sSA neuron). Of the sSA neurons projecting axons to a given glomerulus, 50% are located over 5-7 glomerular diameters away from the injected glomerulus (denoted by large circle), whereas 10% are located over 15-18 glomerular diameters distant (two neurons depicted in lower corners). The longest sSA axons extend 20-30 glomerular diameters, an appreciable fraction of the circumference of the MOB (∼80 glomerular diameters in rats or mice). Grey circles denote glomeruli. Data drawn from ref. [48]. (b) The interglomerular connectivity of the ET/sSA network is functionally equivalent to a fully-connected all-to-all network [25]. The abscissa denotes an overall measure of sSA network connectivity, between the hypothetical extremes of no ET/sSA connectivity at all (fully isolated glomeruli) and full connectivity in which every glomerulus is directly linked to every other glomerulus (all-to-all connections). The greater the connectivity, the lower the variance in the activation levels among sSA neurons. That is, zero connectivity means that sSA neurons directly inherit (via ET cells) the heterogeneous odor-evoked activation levels of the OSNs associated with the nearest glomerulus, such that different sSA neurons differ widely in their activation levels across the MOB. In contrast, full connectivity implies that every sSA neuron receives essentially the same amount of afferent input (by receiving excitation drawn from every glomerulus in the MOB), which produces minimal variance in the activity levels among different sSA neurons. An estimate of actual ET/sSA connectivity in the mouse MOB (dashed vertical line) suggests that this center-surround connectivity pattern exerts the same quantitative, normalizing effect as would a fully-connected all-to-all network, but at a fraction of the metabolic cost. Figure adapted from ref. [25].
This model predicts that activity in sSA cells should be relatively uniform across the extent of the MOB. Theoretical predictions of activity levels among ET cells, in contrast, are less well constrained, in part because each receives heterogeneous afferent inputs from OSNs as well as the theoretically uniform level of excitation received from sSA cells. Like PG cells, ET cells also comprise at least two discrete subpopulations with different morphological and electrophysiological properties [76]. Recordings from ET cells demonstrate that they are spontaneously bursting and resonant in the respiratory theta band [77, 78], interconnect glomeruli associated with the same OR [79], and participate in short-term synaptic plasticity within the glomerular microcircuit [60]. The full role of ET cells within MOB circuitry remains unclear.
Computations in the external plexiform layer
If normalization and the decorrelation of odorant representations are indeed mediated in the MOB glomerular layer, what might be the role of the broadly interconnected lateral inhibitory network of the EPL? The capacity of this layer for arbitrary, distance-independent connections among MOB columns [7, 28], and for learning-dependent plasticity therein that modifies odor perception [80] based on the stimulus-selective [81] and NMDA-dependent [82] survival of new granule cells, suggests a powerful engine for processing high-dimensional odorant representations, and the predominance of lateral inhibitory connections suggests a capacity for decorrelation operations. Yet this network is poorly situated to decorrelate odor representations based upon OR receptive field overlap. The apparent efficacy of lateral interactions does not correspond to a pattern of receptive field similarities [28], and it is indeed difficult to see how such a map could possibly be generated. The potency-based inhibitory surround provided to mitral cells by coglomerular PGo cells in the glomerular layer is no longer available in the EPL (Figure 1a). Hypothetical activity-dependent mechanisms, by which lateral inhibitory connection strengths among mitral cells in different MOB columns depend on the probability of their co-activation, cannot distinguish between the co-activation of two ORs owing to receptive field overlap and their co-activation owing to the correlated presence of two dissimilar odor features (perhaps comprising different parts of the same odorant molecule), and hence cannot construct a similarity map based solely on the former. Whatever operations are being transformed within the EPL lateral inhibitory network probably include decorrelation [55], but they do not appear to include the decorrelation of odor representations based upon the similarity space defined by odorant structural similarities. What other aspects of odor representations might then be decorrelated at this level?
The evidence to date suggests an exciting possibility. The EPL is theoretically capable of an arbitrarily high-dimensional decorrelation of odor representations, but lacks a predefined similarity space in which to base these computations. Perhaps there is no such fixed space. More precisely, perhaps transformations based on elemental odor similarities are completed within the glomerular layer, and the role of the EPL is instead to re-transform these odor representations according to additional, higher-order, similarity-independent factors, such as experience, context, and patterns of learned contingency. Indeed, decorrelation operations in such a plastic similarity space generally require a feedback architecture such as that of the EPL, as distinct from the predominantly feedforward architecture (and relatively fixed similarity space) of the glomerular layer [18]. It is well established that odor learning, context, and top-down neuromodulation do affect mitral cell responses to odor stimuli [83-86], though computations in particular MOB layers are not specifically implicated in most studies. However, EPL computations (in the sense of the learning-dependent selective survival of new granule cells) do appear to underlie an experience-dependent remapping of odor space that allocates additional resources (granule cells) to enable behavioral discrimination between highly similar odorants once experience has demonstrated that they are distinct [80]. Such disproportionate remapping is an recurring property of sensory systems, reflecting the selective allocation of metabolic resources to specific regions of sensory space, whether directly based on primary receptor distributions (as in the somatosensory homunculus [87]), on learning, or on the higher-order statistics of natural scenes [17-19, 88].
Notably, whereas the organization of primary representations often is inherited by subsequent sensory structures, the transformations mediated in these secondary structures may concern higher-order stimulus attributes rather than the elemental similarity features of the primary representation. For example, whereas primary visual cortex (V1) inherits a basic retinotopic organization, additional maps of orientation, spatial frequency, ocular dominance, and other higher-order attributes of the visual scene also are embedded into its cortical architecture [17, 38]. Decorrelation and related tuning operations in V1 are performed with respect to higher-order visual stimulus attributes rather than retinotopy per se – e.g., the regulation of orientation selectivity [89]. While the details of these operations are modality-specific, EPL computations in the MOB also may reflect such higher-order stimulus attributes, as well as the effects of learned associations and/or behavioral state.
Conclusion
Olfactory sensory responses can be usefully described as a cascade of successive representations, each undergoing specific transformations that can be theoretically and experimentally elucidated. The primary olfactory representation is that mediated by OSNs. Among the properties of this representation are a direct dependence on the properties of OR receptive fields and a strong sensitivity to odor concentration that can obscure the consistent representation of odor quality. In contrast, the secondary olfactory representation, as mediated by mitral cells and propagated to several areas of the brain, is relational and reflects both afferent OSN activity and intrinsic factors including the effects of behavioral state and accumulated experience. The transformations between the primary representation and this secondary representation can be grouped into two successive stages: glomerular-layer computations and EPL computations. Glomerular-layer computations are likely to normalize afferent activity levels into a manageable dynamic range and to mediate the decorrelation of odor representations with respect to the odors' structural similarities, as identified by the patterns of overlap in OR receptive fields. Subsequent EPL computations are less clear, but may further decorrelate and modify secondary odor representations with respect to higher-order odor attributes, olfactory experience and learning, and/or other factors (as opposed to the traditionally construed form of olfactory decorrelation that is based upon odorant structural similarities and studied using homologous series of odorants). In sum, the MOB implements a coordinated set of early sensory transformations directly analogous to those in other sensory systems, but must accomplish these with unique circuit architectures and algorithms adapted to the olfactory modality. Further elucidation of the intrinsic learning mechanisms and top-down neuromodulatory effects within the MOB, as well as appreciation for the complex properties and problems of natural olfactory scenes, will be critical to understanding the full role of the MOB and the nature and structure of the information that it provides to piriform cortex and other downstream structures.
Acknowledgments
I thank Christiane Linster, Nathan Schoppa, and four anonymous reviewers for consultation and criticism. Supported by NIDCD grants R01 DC009948 (CRCNS) and R03 DC007725.
Glossary
- Chemotopy
The physical distribution of neurons or glomeruli on the surface of the brain (typically the olfactory bulb) with respect to their receptive fields for chemical stimuli (odorants). While the term does not intrinsically imply any organizational principle, it is sometimes used more narrowly to refer to some form of ordered chemotopic map in which the physical location of a neuron or glomerulus with respect to others implies something about its receptive field.
- Decorrelation
A process by which similar or overlapping neural representations are transformed so as to overlap (or correlate) less, thereby selectively emphasizing their differences over their commonalities. In the present context, this corresponds to the narrowing (sharpening) of receptive fields, and incorporates functions such as contrast enhancement and optimal coding.
- Levels of analysis
A framework for understanding and comparing complex systems by enabling their simultaneous description at multiple distinct but interrelated levels, from the abstract to the concrete. In his studies of visual perception, Marr identified three useful levels of analysis: the computational, algorithmic, and implementational [1, 2]. Briefly, the computational level describes what the system is doing, irrespective of how it is doing it. The algorithmic level describes the operations and/or rules that are being performed, as well as the system of representation in which they are based. Finally, the implementational (or hardware) level describes the physiological and biophysical (or mechanical and electronic) mechanisms that embody the functions of the higher levels.
- Proximity-dependence
A characteristic of neural network algorithms or mechanisms that depend on the physical proximity among neurons; i.e., for which proximity is an independent variable. A classic example is lateral inhibition, in which neighboring neurons inhibit one another strongly and more distant neurons inhibit one another weakly or not at all.
- Representation
A spatiotemporal pattern of neural activity that carries information about some stimulus or state. In olfaction, the primary representation refers to afferent information contained in the activation profile of primary OSNs, whereas the secondary representation refers to the transformation of this information contained across the population of secondary olfactory principal neurons: mitral and middle/deep tufted cells. Subsets of the complete secondary representation can also be referred to separately as secondary representations, such as the discussion of the mitral cell representation and the relative neglect of the middle/deep tufted cell representation within this review
- Similarity-dependence
A characteristic of neural network computations that depend on knowledge or estimation of the receptive field similarities among their inputs. Decorrelation is an example of a similarity-dependent neural computation
- Similarity space
An abstract metric space of arbitrary dimensionality in which all aspects of stimulus similarity can be plotted and similarities (generally, the extent of overlap of receptive fields) are reflected by the Euclidean distance between any two points
- Spatial scale
The degree of precision in spatial localization that is relevant for a given representation or metric
Footnotes
Publisher's Disclaimer: This is a PDF file of an unedited manuscript that has been accepted for publication. As a service to our customers we are providing this early version of the manuscript. The manuscript will undergo copyediting, typesetting, and review of the resulting proof before it is published in its final citable form. Please note that during the production process errorsmaybe discovered which could affect the content, and all legal disclaimers that apply to the journal pertain.
References
- 1.Marr D. Vision: A computational investigation into the human representation and processing of visual information. W. H. Freeman; 1983. [Google Scholar]
- 2.Marr D, Poggio T. MIT AI Memo #357. 1976. From understanding computation to understanding neural circuitry. [Google Scholar]
- 3.Kleene SJ. The electrochemical basis of odor transduction in vertebrate olfactory cilia. Chem Senses. 2008;33:839–859. doi: 10.1093/chemse/bjn048. [DOI] [PubMed] [Google Scholar]
- 4.Serizawa S, et al. Negative feedback regulation ensures the one receptor-one olfactory neuron rule in mouse. Science. 2003;302:2088–2094. doi: 10.1126/science.1089122. [DOI] [PubMed] [Google Scholar]
- 5.Nguyen MQ, et al. Prominent roles for odorant receptor coding sequences in allelic exclusion. Cell. 2007;131:1009–1017. doi: 10.1016/j.cell.2007.10.050. [DOI] [PMC free article] [PubMed] [Google Scholar]
- 6.Mombaerts P. Axonal wiring in the mouse olfactory system. Annu Rev Cell Dev Biol. 2006;22:713–737. doi: 10.1146/annurev.cellbio.21.012804.093915. [DOI] [PubMed] [Google Scholar]
- 7.Willhite DC, et al. Viral tracing identifies distributed columnar organization in the olfactory bulb. Proc Natl Acad Sci U S A. 2006;103:12592–12597. doi: 10.1073/pnas.0602032103. [DOI] [PMC free article] [PubMed] [Google Scholar]
- 8.Chen TW, et al. Odor coding by modules of coherent mitral/tufted cells in the vertebrate olfactory bulb. Proc Natl Acad Sci U S A. 2009;106:2401–2406. doi: 10.1073/pnas.0810151106. [DOI] [PMC free article] [PubMed] [Google Scholar]
- 9.Callaway EM. Feedforward, feedback and inhibitory connections in primate visual cortex. Neural Netw. 2004;17:625–632. doi: 10.1016/j.neunet.2004.04.004. [DOI] [PubMed] [Google Scholar]
- 10.Lubke J, Feldmeyer D. Excitatory signal flow and connectivity in a cortical column: focus on barrel cortex. Brain Struct Funct. 2007;212:3–17. doi: 10.1007/s00429-007-0144-2. [DOI] [PubMed] [Google Scholar]
- 11.Vaidehi N, et al. Prediction of structure and function of G protein-coupled receptors. Proc Natl Acad Sci U S A. 2002;99:12622–12627. doi: 10.1073/pnas.122357199. [DOI] [PMC free article] [PubMed] [Google Scholar]
- 12.Araneda RC, et al. The molecular receptive range of an odorant receptor. Nat Neurosci. 2000;3:1248–1255. doi: 10.1038/81774. [DOI] [PubMed] [Google Scholar]
- 13.Brink CB, et al. Recent advances in drug action and therapeutics: relevance of novel concepts in G-protein-coupled receptor and signal transduction pharmacology. Br J Clin Pharmacol. 2004;57:373–387. doi: 10.1111/j.1365-2125.2003.02046.x. [DOI] [PMC free article] [PubMed] [Google Scholar]
- 14.Kobilka BK, Deupi X. Conformational complexity of G-protein-coupled receptors. Trends Pharmacol Sci. 2007;28:397–406. doi: 10.1016/j.tips.2007.06.003. [DOI] [PubMed] [Google Scholar]
- 15.Cleland TA, et al. Behavioral models of odor similarity. Behav Neurosci. 2002;116:222–231. doi: 10.1037//0735-7044.116.2.222. [DOI] [PubMed] [Google Scholar]
- 16.Johnson BA, Leon M. Chemotopic odorant coding in a mammalian olfactory system. J Comp Neurol. 2007;503:1–34. doi: 10.1002/cne.21396. [DOI] [PMC free article] [PubMed] [Google Scholar]
- 17.Zhaoping L. Theoretical understanding of the early visual processes by data compression and data selection. Network. 2006;17:301–334. doi: 10.1080/09548980600931995. [DOI] [PubMed] [Google Scholar]
- 18.Wick SD, et al. Pattern orthogonalization via channel decorrelation by adaptive networks. J Comput Neurosci. 2009 doi: 10.1007/s10827-009-0183-1. Epub ahead of print. [DOI] [PubMed] [Google Scholar]
- 19.Olshausen BA, Field DJ. Natural image statistics and efficient coding. Network. 1996;7:333–339. doi: 10.1088/0954-898X/7/2/014. [DOI] [PubMed] [Google Scholar]
- 20.Cleland TA. Contrast enhancement. In: Binder MD, et al., editors. Encyclopedia of Neuroscience. Springer; 2009. pp. 876–880. [Google Scholar]
- 21.Lange D, et al. Inhibitory interaction in the retina: techniques of experimental and theoretical analysis. Ann N Y Acad Sci. 1966;128:955–971. doi: 10.1111/j.1749-6632.1965.tb11710.x. [DOI] [PubMed] [Google Scholar]
- 22.Yang L, et al. GABAergic circuits sharpen tuning curves and modify response properties in the mustache bat inferior colliculus. J Neurophysiol. 1992;68:1760–1774. doi: 10.1152/jn.1992.68.5.1760. [DOI] [PubMed] [Google Scholar]
- 23.Yokoi M, et al. Refinement of odor molecule tuning by dendrodendritic synaptic inhibition in the olfactory bulb. Proc Natl Acad Sci U S A. 1995;92:3371–3375. doi: 10.1073/pnas.92.8.3371. [DOI] [PMC free article] [PubMed] [Google Scholar]
- 24.Soucy ER, et al. Precision and diversity in an odor map on the olfactory bulb. Nat Neurosci. 2009;12:210–220. doi: 10.1038/nn.2262. [DOI] [PubMed] [Google Scholar]
- 25.Cleland TA, et al. Relational representation in the olfactory system. Proc Natl Acad Sci U S A. 2007;104:1953–1958. doi: 10.1073/pnas.0608564104. [DOI] [PMC free article] [PubMed] [Google Scholar]
- 26.Cleland TA, Sethupathy P. Non-topographical contrast enhancement in the olfactory bulb. BMC Neurosci. 2006;7:7. doi: 10.1186/1471-2202-7-7. [DOI] [PMC free article] [PubMed] [Google Scholar]
- 27.Mori K, et al. Maps of odorant molecular features in the Mammalian olfactory bulb. Physiol Rev. 2006;86:409–433. doi: 10.1152/physrev.00021.2005. [DOI] [PubMed] [Google Scholar]
- 28.Fantana AL, et al. Rat olfactory bulb mitral cells receive sparse glomerular inputs. Neuron. 2008;59:802–814. doi: 10.1016/j.neuron.2008.07.039. [DOI] [PubMed] [Google Scholar]
- 29.Fletcher ML, et al. Optical imaging of postsynaptic odor representation in the glomerular layer of the mouse olfactory bulb. J Neurophysiol. 2009;102:817–830. doi: 10.1152/jn.00020.2009. [DOI] [PMC free article] [PubMed] [Google Scholar]
- 30.Johnson BA, et al. Spatial representations of odorants in olfactory bulbs of rats and mice: similarities and differences in chemotopic organization. J Comp Neurol. 2009;514:658–673. doi: 10.1002/cne.22046. [DOI] [PMC free article] [PubMed] [Google Scholar]
- 31.Schoenfeld TA, Cleland TA. The anatomical logic of smell. Trends Neurosci. 2005;28:620–627. doi: 10.1016/j.tins.2005.09.005. [DOI] [PubMed] [Google Scholar]
- 32.Haykin S. Neural networks and learning machines. Prentice Hall; 2008. [Google Scholar]
- 33.Kohonen T, Hari R. Where the abstract feature maps of the brain might come from. Trends Neurosci. 1999;22:135–139. doi: 10.1016/s0166-2236(98)01342-3. [DOI] [PubMed] [Google Scholar]
- 34.Eisthen HL. Why are olfactory systems of different animals so similar? Brain Behav Evol. 2002;59:273–293. doi: 10.1159/000063564. [DOI] [PubMed] [Google Scholar]
- 35.Wolf H. The pectine organs of the scorpion, Vaejovis spinigerus: structure and (glomerular) central projections. Arthropod Struct Dev. 2008;37:67–80. doi: 10.1016/j.asd.2007.05.003. [DOI] [PubMed] [Google Scholar]
- 36.Luo L, Flanagan JG. Development of continuous and discrete neural maps. Neuron. 2007;56:284–300. doi: 10.1016/j.neuron.2007.10.014. [DOI] [PubMed] [Google Scholar]
- 37.Schreiner CE, Winer JA. Auditory cortex mapmaking: principles, projections, and plasticity. Neuron. 2007;56:356–365. doi: 10.1016/j.neuron.2007.10.013. [DOI] [PMC free article] [PubMed] [Google Scholar]
- 38.Ts'o DY, et al. Whither the hypercolumn? J Physiol. 2009;587:2791–2805. doi: 10.1113/jphysiol.2009.171082. [DOI] [PMC free article] [PubMed] [Google Scholar]
- 39.Wolf F, Geisel T. Universality in visual cortical pattern formation. J Physiol Paris. 2003;97:253–264. doi: 10.1016/j.jphysparis.2003.09.018. [DOI] [PubMed] [Google Scholar]
- 40.Rall W, et al. Dendrodendritic synaptic pathway for inhibition in the olfactory bulb. Exp Neurol. 1966;14:44–56. doi: 10.1016/0014-4886(66)90023-9. [DOI] [PubMed] [Google Scholar]
- 41.Egger V, Urban NN. Dynamic connectivity in the mitral cell-granule cell microcircuit. Semin Cell Dev Biol. 2006;17:424–432. doi: 10.1016/j.semcdb.2006.04.006. [DOI] [PubMed] [Google Scholar]
- 42.DeVries SH, Baylor DA. Synaptic circuitry of the retina and olfactory bulb. Cell. 1993;72(Suppl):139–149. doi: 10.1016/s0092-8674(05)80033-9. [DOI] [PubMed] [Google Scholar]
- 43.Linster C, Gervais R. Investigation of the role of interneurons and their modulation by centrifugal fibers in a neural model of the olfactory bulb. J Comput Neurosci. 1996;3:225–246. doi: 10.1007/BF00161133. [DOI] [PubMed] [Google Scholar]
- 44.Linster C, Hasselmo M. Modulation of inhibition in a model of olfactory bulb reduces overlap in the neural representation of olfactory stimuli. Behav Brain Res. 1997;84:117–127. doi: 10.1016/s0166-4328(97)83331-1. [DOI] [PubMed] [Google Scholar]
- 45.Vucinic D, et al. Interglomerular center-surround inhibition shapes odorant-evoked input to the mouse olfactory bulb in vivo. J Neurophysiol. 2006;95:1881–1887. doi: 10.1152/jn.00918.2005. [DOI] [PubMed] [Google Scholar]
- 46.Luo M, Katz LC. Response correlation maps of neurons in the mammalian olfactory bulb. Neuron. 2001;32:1165–1179. doi: 10.1016/s0896-6273(01)00537-2. [DOI] [PubMed] [Google Scholar]
- 47.Margrie TW, et al. Action potential propagation in mitral cell lateral dendrites is decremental and controls recurrent and lateral inhibition in the mammalian olfactory bulb. Proc Natl Acad Sci U S A. 2001;98:319–324. doi: 10.1073/pnas.011523098. [DOI] [PMC free article] [PubMed] [Google Scholar]
- 48.Aungst JL, et al. Centre-surround inhibition among olfactory bulb glomeruli. Nature. 2003;426:623–629. doi: 10.1038/nature02185. [DOI] [PubMed] [Google Scholar]
- 49.Wen Q, Chklovskii DB. A cost-benefit analysis of neuronal morphology. J Neurophysiol. 2008;99:2320–2328. doi: 10.1152/jn.00280.2007. [DOI] [PubMed] [Google Scholar]
- 50.Lowe G. Inhibition of backpropagating action potentials in mitral cell secondary dendrites. J Neurophysiol. 2002;88:64–85. doi: 10.1152/jn.2002.88.1.64. [DOI] [PubMed] [Google Scholar]
- 51.Debarbieux F, et al. Action potential propagation in dendrites of rat mitral cells in vivo. J Neurosci. 2003;23:5553–5560. doi: 10.1523/JNEUROSCI.23-13-05553.2003. [DOI] [PMC free article] [PubMed] [Google Scholar]
- 52.Xiong W, Chen WR. Dynamic gating of spike propagation in the mitral cell lateral dendrites. Neuron. 2002;34:115–126. doi: 10.1016/s0896-6273(02)00628-1. [DOI] [PubMed] [Google Scholar]
- 53.Charpak S, et al. Odor-evoked calcium signals in dendrites of rat mitral cells. Proc Natl Acad Sci U S A. 2001;98:1230–1234. doi: 10.1073/pnas.021422798. [DOI] [PMC free article] [PubMed] [Google Scholar]
- 54.Migliore M, Shepherd GM. Dendritic action potentials connect distributed dendrodendritic microcircuits. J Comput Neurosci. 2008;24:207–221. doi: 10.1007/s10827-007-0051-9. [DOI] [PMC free article] [PubMed] [Google Scholar]
- 55.Arevian AC, et al. Activity-dependent gating of lateral inhibition in the mouse olfactory bulb. Nat Neurosci. 2008;11:80–87. doi: 10.1038/nn2030. [DOI] [PMC free article] [PubMed] [Google Scholar]
- 56.Linster C, et al. Computational modeling suggests that response properties rather than spatial position determine connectivity between olfactory glomeruli. J Neurophysiol. 2005;93:3410–3417. doi: 10.1152/jn.01285.2004. [DOI] [PubMed] [Google Scholar]
- 57.Shepherd GM, Greer CA. Olfactory bulb. In: Shepherd GM, editor. The synaptic organization of the brain. 4th. Oxford University Press; 1998. pp. 159–204. [Google Scholar]
- 58.Pinching AJ, Powell TP. The neuropil of the glomeruli of the olfactory bulb. J Cell Sci. 1971;9:347–377. doi: 10.1242/jcs.9.2.347. [DOI] [PubMed] [Google Scholar]
- 59.White EL. Synaptic organization in the olfactory glomerulus of the mouse. Brain Res. 1972;37:69–80. doi: 10.1016/0006-8993(72)90346-0. [DOI] [PubMed] [Google Scholar]
- 60.Shao Z, et al. Two GABAergic intraglomerular circuits differentially regulate tonic and phasic presynaptic inhibition of olfactory nerve terminals. J Neurophysiol. 2009;101:1988–2001. doi: 10.1152/jn.91116.2008. [DOI] [PMC free article] [PubMed] [Google Scholar]
- 61.Gire DH, Schoppa NE. Control of on/off glomerular signaling by a local GABAergic microcircuit in the olfactory bulb. J Neurosci. 2009;29:13454–13464. doi: 10.1523/JNEUROSCI.2368-09.2009. [DOI] [PMC free article] [PubMed] [Google Scholar]
- 62.Duchamp-Viret P, et al. Odor response properties of rat olfactory receptor neurons. Science. 1999;284:2171–2174. doi: 10.1126/science.284.5423.2171. [DOI] [PubMed] [Google Scholar]
- 63.Duchamp-Viret P, et al. Peripheral odor coding in the rat and frog: quality and intensity specification. J Neurosci. 2000;20:2383–2390. doi: 10.1523/JNEUROSCI.20-06-02383.2000. [DOI] [PMC free article] [PubMed] [Google Scholar]
- 64.Bozza T, et al. In vivo imaging of neuronal activity by targeted expression of a genetically encoded probe in the mouse. Neuron. 2004;42:9–21. doi: 10.1016/s0896-6273(04)00144-8. [DOI] [PubMed] [Google Scholar]
- 65.Hamilton KA, Kauer JS. Patterns of intracellular potentials in salamander mitral/tufted cells in response to odor stimulation. J Neurophysiol. 1989;62:609–625. doi: 10.1152/jn.1989.62.3.609. [DOI] [PubMed] [Google Scholar]
- 66.Harrison TA, Scott JW. Olfactory bulb responses to odor stimulation: analysis of response pattern and intensity relationships. J Neurophysiol. 1986;56:1571–1589. doi: 10.1152/jn.1986.56.6.1571. [DOI] [PubMed] [Google Scholar]
- 67.Meredith M. Patterned response to odor in mammalian olfactory bulb: the influence of intensity. J Neurophysiol. 1986;56:572–597. doi: 10.1152/jn.1986.56.3.572. [DOI] [PubMed] [Google Scholar]
- 68.Wellis DP, et al. Discrimination among odorants by single neurons of the rat olfactory bulb. J Neurophysiol. 1989;61:1161–1177. doi: 10.1152/jn.1989.61.6.1161. [DOI] [PubMed] [Google Scholar]
- 69.Chalansonnet M, Chaput MA. Olfactory bulb output cell temporal response patterns to increasing odor concentrations in freely breathing rats. Chem Senses. 1998;23:1–9. doi: 10.1093/chemse/23.1.1. [DOI] [PubMed] [Google Scholar]
- 70.Davison IG, Katz LC. Sparse and selective odor coding by mitral/tufted neurons in the main olfactory bulb. J Neurosci. 2007;27:2091–2101. doi: 10.1523/JNEUROSCI.3779-06.2007. [DOI] [PMC free article] [PubMed] [Google Scholar]
- 71.Nagayama S, et al. Mitral and tufted cells differ in the decoding manner of odor maps in the rat olfactory bulb. J Neurophysiol. 2004;91:2532–2540. doi: 10.1152/jn.01266.2003. [DOI] [PubMed] [Google Scholar]
- 72.Friedrich RW, Korsching SI. Combinatorial and chemotopic odorant coding in the zebrafish olfactory bulb visualized by optical imaging. Neuron. 1997;18:737–752. doi: 10.1016/s0896-6273(00)80314-1. [DOI] [PubMed] [Google Scholar]
- 73.McGann JP, et al. Odorant representations are modulated by intra- but not interglomerular presynaptic inhibition of olfactory sensory neurons. Neuron. 2005;48:1039–1053. doi: 10.1016/j.neuron.2005.10.031. [DOI] [PubMed] [Google Scholar]
- 74.Pouille F, et al. Input normalization by global feedforward inhibition expands cortical dynamic range. Nat Neurosci. 2009;12:1577–1585. doi: 10.1038/nn.2441. [DOI] [PubMed] [Google Scholar]
- 75.Watts DJ, Strogatz SH. Collective dynamics of ‘small-world’ networks. Nature. 1998;393:440–442. doi: 10.1038/30918. [DOI] [PubMed] [Google Scholar]
- 76.Antal M, et al. External tufted cells in the main olfactory bulb form two distinct subpopulations. Eur J Neurosci. 2006;24:1124–1136. doi: 10.1111/j.1460-9568.2006.04988.x. [DOI] [PMC free article] [PubMed] [Google Scholar]
- 77.Hayar A, Ennis M. Endogenous GABA and glutamate finely tune the bursting of olfactory bulb external tufted cells. J Neurophysiol. 2007;98:1052–1056. doi: 10.1152/jn.01214.2006. [DOI] [PMC free article] [PubMed] [Google Scholar]
- 78.Liu S, Shipley MT. Multiple conductances cooperatively regulate spontaneous bursting in mouse olfactory bulb external tufted cells. J Neurosci. 2008;28:1625–1639. doi: 10.1523/JNEUROSCI.3906-07.2008. [DOI] [PMC free article] [PubMed] [Google Scholar]
- 79.Zhou Z, Belluscio L. Intrabulbar projecting external tufted cells mediate a timing-based mechanism that dynamically gates olfactory bulb output. J Neurosci. 2008;28:9920–9928. doi: 10.1523/JNEUROSCI.3082-08.2008. [DOI] [PMC free article] [PubMed] [Google Scholar]
- 80.Moreno MM, et al. Olfactory perceptual learning requires adult neurogenesis. Proc Natl Acad Sci U S A. 2009;106:17980–17985. doi: 10.1073/pnas.0907063106. [DOI] [PMC free article] [PubMed] [Google Scholar]
- 81.Alonso M, et al. Olfactory discrimination learning increases the survival of adult-born neurons in the olfactory bulb. J Neurosci. 2006;26:10508–10513. doi: 10.1523/JNEUROSCI.2633-06.2006. [DOI] [PMC free article] [PubMed] [Google Scholar]
- 82.Fiske BK, Brunjes PC. NMDA receptor regulation of cell death in the rat olfactory bulb. J Neurobiol. 2001;47:223–232. doi: 10.1002/neu.1029. [DOI] [PubMed] [Google Scholar]
- 83.Restrepo D, et al. From the top down: flexible reading of a fragmented odor map. Trends Neurosci. 2009;32:525–531. doi: 10.1016/j.tins.2009.06.001. [DOI] [PMC free article] [PubMed] [Google Scholar]
- 84.Wilson DA, Stevenson RJ. Learning to smell: olfactory perception from neurobiology to behavior. Johns Hopkins University Press; 2006. [Google Scholar]
- 85.Chaudhury D, et al. Bulbar acetylcholine enhances neural and perceptual odor discrimination. J Neurosci. 2009;29:52–60. doi: 10.1523/JNEUROSCI.4036-08.2009. [DOI] [PMC free article] [PubMed] [Google Scholar]
- 86.Doucette W, Restrepo D. Profound context-dependent plasticity of mitral cell responses in olfactory bulb. PLoS Biol. 2008;6:e258. doi: 10.1371/journal.pbio.0060258. [DOI] [PMC free article] [PubMed] [Google Scholar]
- 87.Penfield W, Rasmussen T. The cerebral cortex of man: a clinical study of localization of function. MacMillan; 1950. [Google Scholar]
- 88.Geisler WS. Visual perception and the statistical properties of natural scenes. Annu Rev Psychol. 2008;59:167–192. doi: 10.1146/annurev.psych.58.110405.085632. [DOI] [PubMed] [Google Scholar]
- 89.Yao H, et al. Intracortical mechanism of stimulus-timing-dependent plasticity in visual cortical orientation tuning. Proc Natl Acad Sci U S A. 2004;101:5081–5086. doi: 10.1073/pnas.0302510101. [DOI] [PMC free article] [PubMed] [Google Scholar]
- 90.Cleland TA, Linster C. Central olfactory processing. In: Doty RL, editor. Handbook of olfaction and gustation. 2nd. Marcel Dekker; 2003. pp. 165–180. [Google Scholar]
- 91.Eyre MD, et al. Distinct deep short-axon cell subtypes of the main olfactory bulb provide novel intrabulbar and extrabulbar GABAergic connections. J Neurosci. 2008;28:8217–8229. doi: 10.1523/JNEUROSCI.2490-08.2008. [DOI] [PMC free article] [PubMed] [Google Scholar]