Abstract
Nitric oxide (•NO) is a ubiquitous signaling molecule that participates in the neuromolecular phenomena associated with memory formation. In the hippocampus, neuronal •NO production is coupled to the activation of the NMDA-type of glutamate receptor. Although, •NO-mediated signaling has been associated with soluble guanylate cyclase activation, cytochrome oxidase is also a target for this gaseous free radical, for which •NO competes with O2. Here, we show, for the first time in a model preserving tissue cytoarchitecture (rat hippocampal slices) and at a physiological O2 concentration, that endogenous NMDA-evoked •NO production inhibits tissue O2 consumption for submicromolar concentrations. The simultaneous real-time recordings reveal a direct correlation between the profiles of •NO and O2 in the CA1 subregion of the hippocampal slice. These results, obtained in a system close to in vivo models, strongly support the current paradigm for O2 and •NO interplay in the regulation of cellular respiration.
Keywords: Nitric Oxide, Oxygen, Hippocampus, Microelectrode, Cytochrome oxidase, NMDA
INTRODUCTION
Nitric oxide (•NO) is a ubiquitous intercellular messenger involved in the physiology of diverse systems, including the cardiovascular, immune and nervous systems [1]. Soluble guanylate cyclase is one of the better characterized biochemical targets of •NO, (reviewed in [2]), but cytochrome oxidase (CcO) has emerged as another potential target and mediator of the actions attributed to the free radical. CcO is the terminal complex of the mitochondrial respiratory chain: it accepts electrons from cytochrome c and reduces O2 to H2O. Low concentrations of •NO were shown to reversibly inhibit CcO and consequently mitochondrial respiration in cellular and mitochondrial models, by competing with O2 [3–6]. Due to the difficulty in measuring •NO binding to CcO in vivo, theoretical models for the binding and reaction of •NO at the reduced and oxidized centers of the enzyme have then been proposed [7–9].
The hippocampus is a structure of the medial temporal lobe in the CNS involved in memory formation [10]. A neural role for •NO as an intercellular signaling molecule was proposed by Garthwaite et al., who associated the production of the free radical to the activation of the N-methyl-D-aspartate (NMDA) type of glutamate receptor [11], a notion confirmed in subsequent studies (reviewed in [12]). At the glutamatergic synapse, namely in the hippocampus, the NMDA receptor and the neuronal isoform of nitric oxide synthase (nNOS), the enzyme responsible for •NO production, are physically and functionally coupled at the postsynaptic density [13]. This supramolecular complex is maintained by protein-protein interactions mediated by the scaffold protein PSD-95 [14]. As such, nNOS is under the direct influence of Ca2+ entering the open NMDA receptor channel.
We previously showed that NMDA-evoked •NO production in the rat hippocampal slice is heterogeneous among the different subregions, with CA1 showing a higher production of •NO relative to CA3 and DG. We further demonstrated that maximal concentration of the free radical did not exceed a few hundred nM under conditions entailing the activation of a physiological pathway of •NO production in the CNS and at a concentration of O2 reported as physiological for the rodent neuronal tissue [15, 16].
In this study we show that endogenously produced •NO regulates O2 consumption in the CA1 subregion of the rat hippocampal slice. This is a quantitative and dynamic assessment carried out in a complex biological preparation, which retains cytoarchitectural and neuronal circuit integrity.
MATERIALS AND METHODS
Chemicals and biochemicals
NMDA and 3-Br-7-NI were obtained from Tocris Cookson (Avonmouth, U.K.). o-Phylenediamine and ascorbate were from Fluka. Glutathione and diethylenetriaminepentacetic acid were from Sigma. Nafion® was from Aldrich. All other reagents were analytical grade. The buffer used for microelectrode testing and calibrations was PBS with the following composition: 140 mM NaCl, 2.7 mM KCl, 8.1 mM NaHPO4, 1.8 mM KH2PO4, and 0.1 mM diethylenetriaminepentacetic acid, pH 7.4. The media used in hippocampal slice experiments was artificial cerebrospinal fluid (aCSF) composed of 124 mM NaCl, 2mM KCl, 25 mM NaHCO3, 1.25 mM KH2PO4, 1.5 mM CaCl2, and 10 mM D-glucose. For dissection and recovery a modified aCSF was used to increase viability. Composition of this modified aCSF was 124 mM NaCl, 2 mM KCl, 25 mM NaHCO3, 1.25 mM KH2PO4, 0.5 mM CaCl2, 10 mM MgSO4, 0.2 mM ascorbate, 1 mM glutathione, and 10 mM D-glucose. In both cases, aCSF was continuously bubbled with humidified carbox (95% O2 / 5%C O2) for pH buffering (pH 7.4) and oxygenation.
Electrochemical Instrumentation
Fast cyclic voltammetry was carried out on an I-400 potentiostat (Ensman Instruments, Bloomington, IN); signals were monitored on a digital storage oscilloscope (Tektronix TDS 220). Amperometric currents from carbon fiber microelectrode modification and calibration were recorded on a PGSAT 12 potentiostat (Eco-Chimie, Utrecht, The Netherlands) with low current module, controlled by GPES software, version 4.9. The amperometric currents recordings of •NO in slices were performed on the inNO model T electrochemical detection system (Innovative Instruments, Tampa, FL). The O2 measurements in tissue were performed using the Amu 130 Amperometer (Tacussel Electronique, France). In hippocampal simultaneous recordings of •NO and O2, a two-electrode circuit was used (one for each recording), with a Ag/AgCl pellet reference electrode and the carbon fiber microelectrode as a working electrode. For other experiments, a three-electrode cell with a Pt-wire auxiliary electrode, an Ag/AgCl (3M) reference electrode, and the carbon fiber microelectrode as a working electrode was used. The working electrode was held at a constant potential of either +0.9 or −0.8V versus Ag/AgCl for •NO or O2 measurements, respectively.
Carbon Fiber Microelectrode Construction and Surface Coating
Carbon fiber microelectrodes were fabricated as previously described [15, 17–19]. Briefly, a single carbon fibers (8 µm i.d.; Courtaulds, London) was inserted into a borosilicate glass capillary (1.16 mm i.d. and 2.0 mm o.d.; Harvard Apparatus) and cleaned with acetone. Each capillary was pulled on a vertical puller (Harvard Apparatus) and the protruding carbon fiber was cut to a tip length of ~100 µm or ~20-50 µm, depending on whether the microelectrode was to be used for •NO or O2 measurements, respectively. The electrical contact between the carbon fiber and the copper wire was provided by conductive silver paint (RS, Northants, U.K.). Carbon fiber microelectrodes used to measure •NO were first coated with Nafion® by dipping the fiber into a Nafion® solution at room temperature for 30 s and drying for 10 min at 170°C in an oven. Microelectrodes were then coated by electropolimerization of o-phenylenediamine (o-PD) as described [20]. A 5-mM o-PD solution in PBS supplemented with 0.1 mM ascorbate was made fresh each day and used immediately. Electropolimerization of o-PD on the carbon surface was performed by amperometry at constant potential of +0.9 V versus Ag/AgCl for 15 min.
Microsensor Testing Procedures
Each carbon fiber microelectrode was tested for general recording characteristics in PBS by fast cyclic voltammetry at a scan rate of 200 V/s between −0.4 and +1.6 V. This potential range provides an electrical pretreatment of the carbon fiber that improves sensitivity. Stable background current and sharp transients at reversal potentials indicated suitable recording properties of the microelectrode. Each carbon fiber microelectrode for •NO was calibrated in a single stream flow injection analysis system by using a homemade flow cell with PBS as a carrier solution at a flow rate of 2.0 ml/min. Transient oxidation currents were measured in response to a 100 µl aliquot of a •NO solution (0.1 − 1 µM in deaerated PBS) injected repeatedly with a four-valve port. The microelectrodes for O2 measurement were calibrated in a 2 ml cell with PBS as a support electrolyte, at 32°C. The reduction current was measured for three distinct O2 values – 0, 0.24, and 1 mM – achieved by bubbling the PBS with argon, allowing it to achieve atmospheric O2 and bubbling it with Carbox, respectively.
Rat hippocampal slices
Male Wistar rats (100–150 g) were killed by cervical displacement according to approved guidelines. The brain was rapidly removed and placed in ice-cold modified aCSF. The hippocampi were dissected and placed on the stage of a McIlwain tissue chopper (Campden Instruments, London), and 400 µm-thick sections were obtained. The slices were separated and transferred to a pre-incubation chamber (BSC-PC, Harvard Apparatus) containing modified aCSF at room temperature, continuously bubbled with Carbox. Slices were recovered under these conditions for at least 1 h before recordings.
Simultaneous recording of •NO and O2 profiles
Individual slices were placed in a recording chamber (BSC-BU with BSC-ZT top, Harvard Apparatus) and perfused at a flow rate of 2 ml/min with normal aCSF at 32°C (temperature controller model TC-202A, Harvard Apparatus) continuously bubbled with humidified Carbox. Both carbon fiber microelectrodes (one for •NO and another for O2) were inserted in the pyramidal cell layer of the CA1 subregion of the rat hippocamal slice, 100–200 µm into the tissue. The electrodes were inserted in an anti-parallel orientation with a 50 µm gap between them. The hippocampal slice was stimulated with NMDA at different concentrations (10, 50, and 100 µM) added to the perfusion media for 2 min (unless otherwise indicated). For experiments with the NOS inhibitor 3-Bromo-7-Nitroindazole (3-Br-7-NI), shown to be nNOS selective in vivo (24), each individual slice was pre-incubated in aCSF (continuously bubbled with Carbox) at 32°C containing 30 µM of the compound for 30–60 min prior to being placed in the recording chamber. In these experiments, the perfusion media (aSCF) also contained 30 µM of 3-Br-7-NI.
Data analysis
For each individual •NO recording, the ascending phase was fitted to a sigmoid function, which allowed the T80% for this phase to be calculated. Numerical values presented as mean ± s.e.m. Statistical significance of differences between two values was evaluated by unpaired t-Student test. All analyses were performed with commercially available software.
RESULTS
Simultaneous recording of •NO and O2 in the CA1 subregion of hippocampus
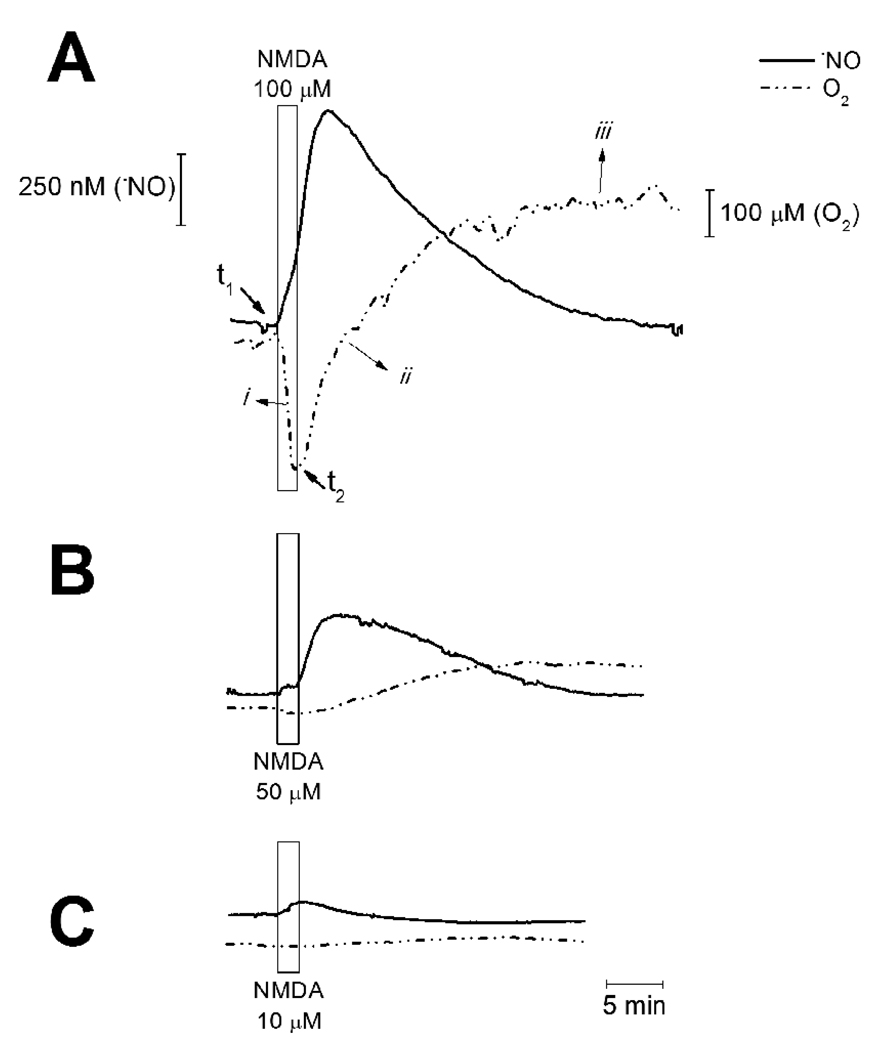
Both •NO and O2 were simultaneously recorded in the CA1 subregion of rat hippocampal slices upon stimulation of the NMDA-type of glutamate receptor (NMDAr). The specific agonist NMDA was present in the perfusion medium for a 2 min period. Recordings were performed at a depth of 200 µm, where cells experience a physiological O2 concentration (average [O2] at 200µm depth in CA1 statum pyramidale was 57.3 ± 38.2 µM, n = 7) because a steep O2 gradient exists from the surface of the slice to the 200 µm depth [15]. Stimulation of the NMDAr induced a transient increase in the •NO concentration (Fig. 1). Regarding the O2 profile, 2 phases can be described following NMDAr stimulation: initially, an increase in O2 consumption was observed (rapid decrease in [O2], i in Fig.1A); this was followed by a decrease in O2 consumption (ii in Fig. 1A) until a new steady state [O2] was achieved (iii in Fig. 1A), which reflected an overall lower consumption rate as compared to the rate observed prior to stimulation.
Fig. 1. Simultaneous recording of •NO and O2 in the CA1 subregion of the hippocampus.
Graphs show simultaneous recording of •NO (solid line) and O2 (dashed line) in the CA1 subregion of hippocampal slices challenged with NMDA at different concentrations: (A) 100 µM, (B) 50 µM, and (C) 10 µM for a 2 min period (indicated by the rectangle). Values t1 and t2 indicate the starting point of increase in •NO and O2, respectively. The symbols i, ii and iii indicate different phases in the O2 profile.
The [O2] measured in the extracellular space translates the equilibrium between the rate of tissue O2 consumption and the diffusion of O2 from the perfusion media (saturated with 95% O2). The initial increase in O2 consumption (i) is a result of increased tissue energy requirement upon activation of the NMDAr ([21]). In the second phase of the O2 profile (ii and iii), the decrease in O2 consumption was not transient: [O2] increased from a basal value to a new steady state – the basal value was not recovered for the duration of the recordings.
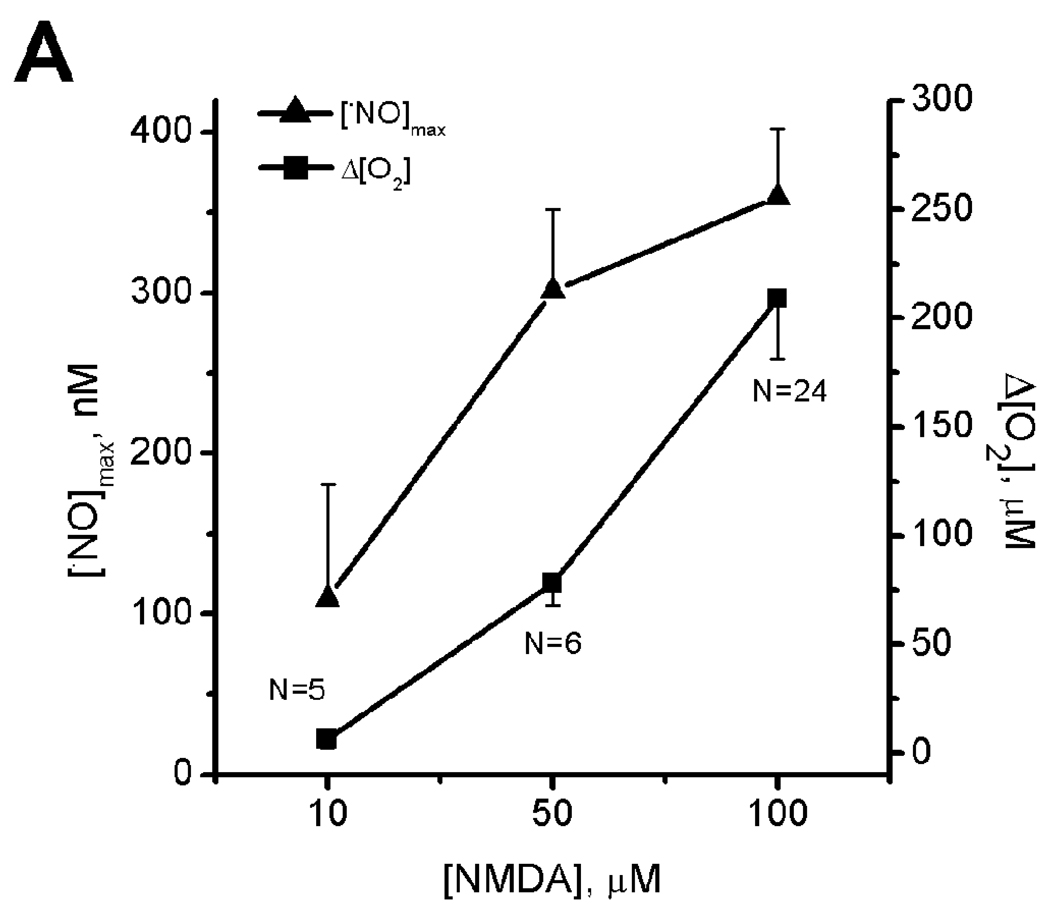
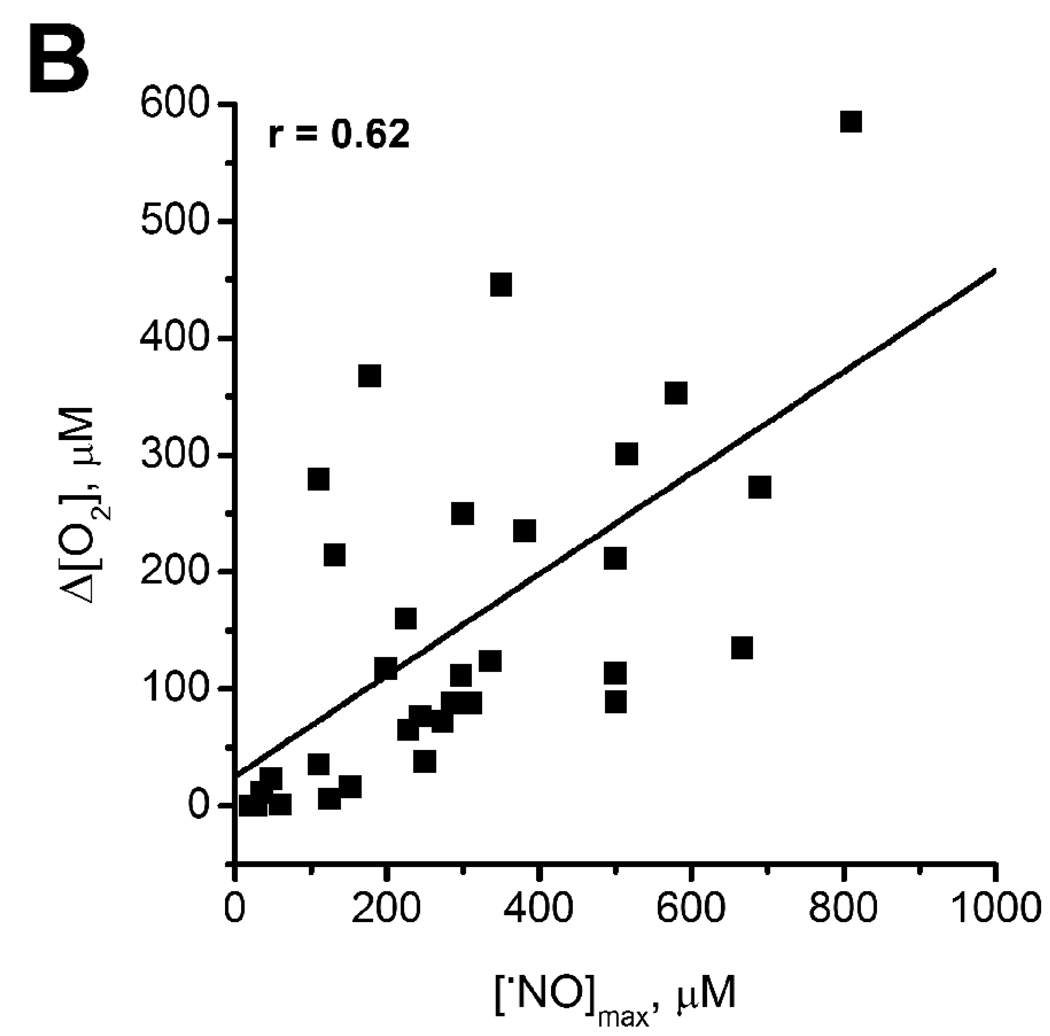
Both maximal production of •NO and the extent of increase in O2 (Δ[O2]) depend directly upon the intensity of tissue stimulation, i.e., the NMDA concentration (Fig. 2A). The plot of Δ[O2] as a function of peak [•NO] (Fig. 2B) revealed a direct and positive linear correlation between the two measured parameters (r = 0.62). This observation substantiates the notion that •NO regulates O2 consumption at the tissue level. Note that all •NO concentrations measured were in the sub-micromolar range, in which the physiological or direct actions of the free radical are proposed to occur ([22, 23]).
Fig. 2. Relationship between NMDA receptor activation and the profiles of •NO and O2 recorded simultaneously in the CA1 subregion of the hippocampal slice.
Plot (A) shows the average [•NO] (▲) and [O2] (■) for each concentration of stimulus (NMDA) used. Error bars represent s.e.m. In (B), for each individual recording, the variation in O2 (Δ[O2]) is plotted as a function of the peak •NO concentration, revealing a linear correlation (r = 0.69) between the two measured parameters (n = 22).
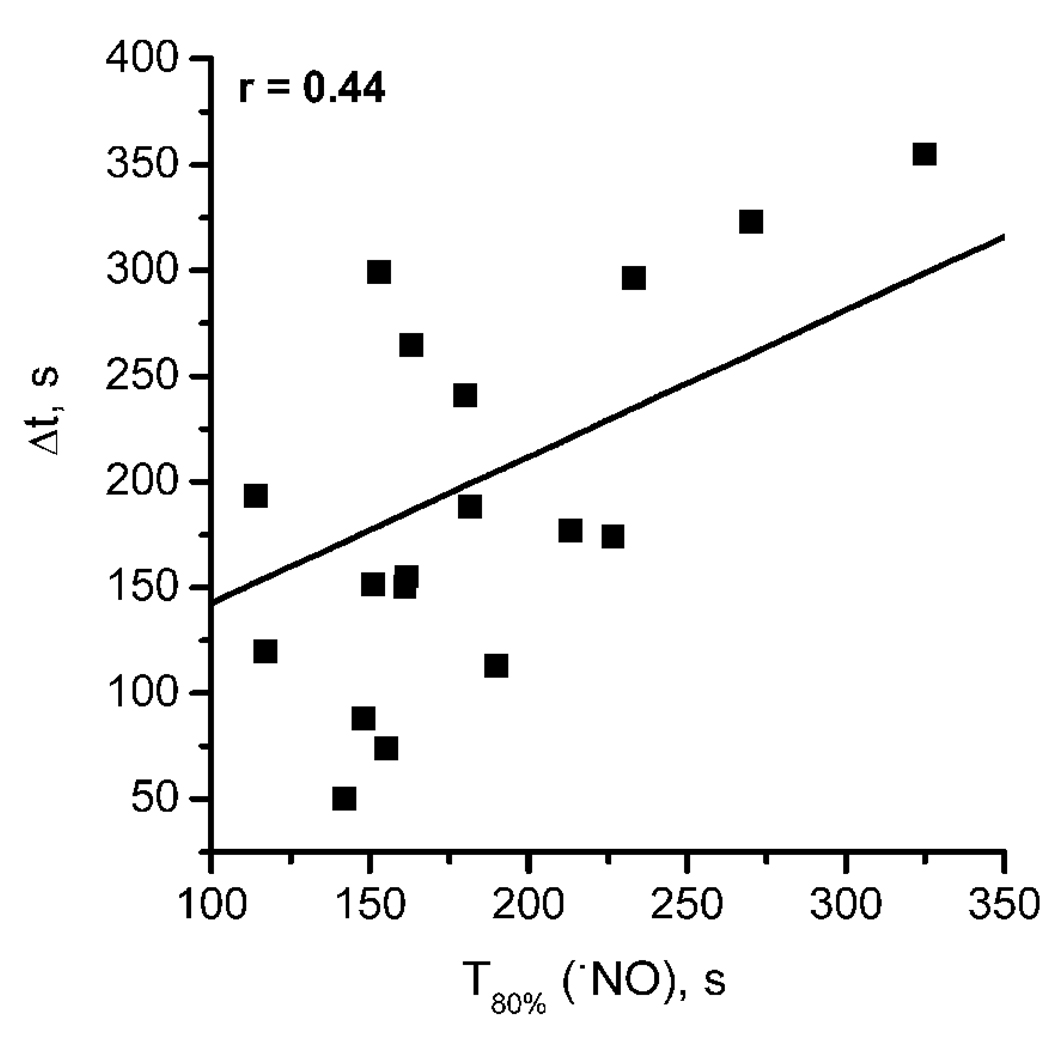
As shown in the recordings in Fig. 1, while increase in •NO occurred immediately upon NMDAr stimulation (t1 indicated in Fig. 1), a “delay” was observed for the onset of increase in O2 (t2 in Fig. 1). This time interval (Δt = t2 – t1) for each simultaneous recording was plotted as a function of the time required to achieve 80% of •NO maximal concentration (T80%) (Fig. 3), revealing a positive linear correlation between these two parameters (r = 0.44).
Fig. 3. Correlation between the time-courses of the •NO and O2 profiles in the CA1 region on hippocampal slices challenged with NMDA.
The graph shows the linear correlation (r=0.44) observed between the delayed onset of O2 increase relative to •NO response (Δt) and rate of •NO production, represented as T80% (n = 16).
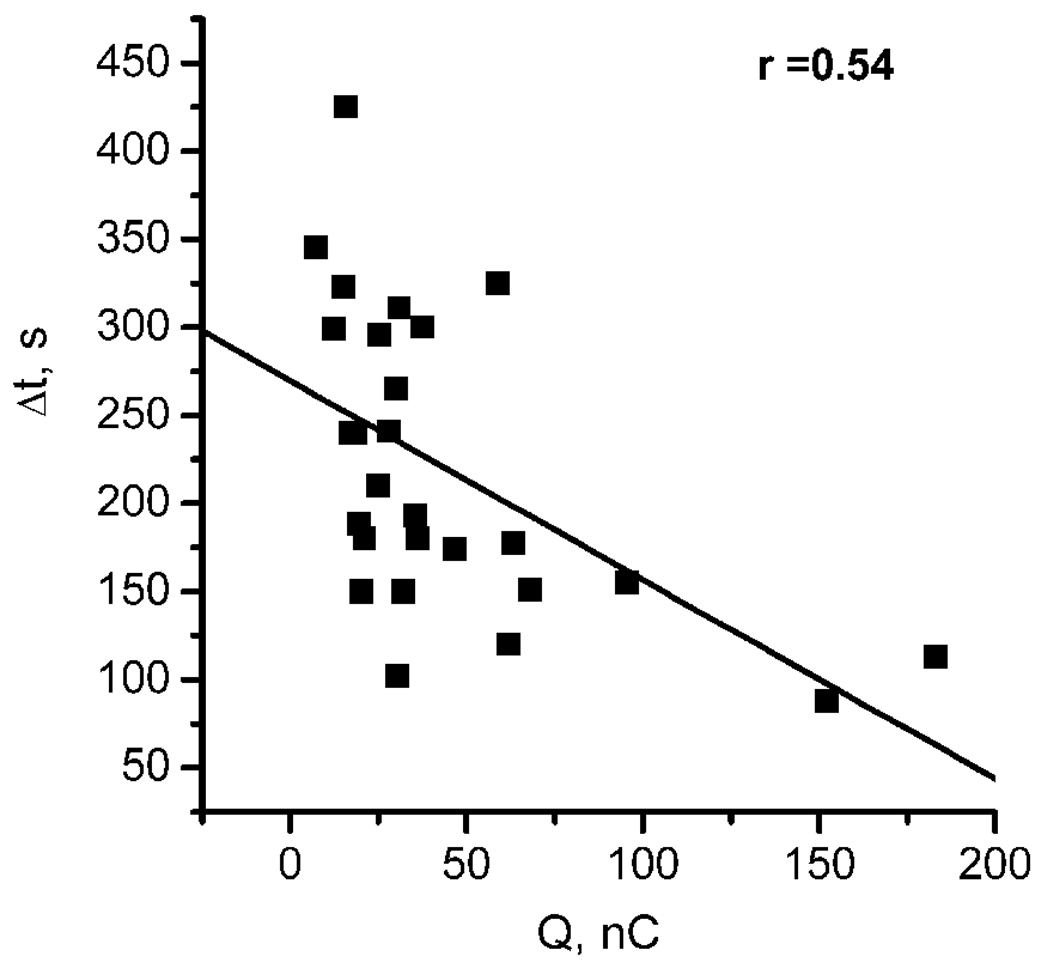
This “delay” seems to point towards a threshold concentration of •NO required for interference with the rate of O2 consumption in the hippocampus to be observed. The faster such a condition is achieved (most probably a threshold concentration), the shorter the “delay” Δt. A negative correlation (r = 0.54) was also observed between the total charge of the •NO signal (Q) and the delay for the increase in O2 (Fig. 4), further substantiating the association between endogenous •NO concentration dynamics and regulation of O2 consumption in the hippocampus. In agreement with the notion of a threshold of •NO, the partial charge of the •NO signal calculated for the time interval Δt displayed an average value of 5.2 ± 1.1 nC (n = 19) and the average •NO concentration at t2 (at the time when O2 consumption rate decreases in each individual recording) was 271.8 ± 89.3 nM (n = 14).
Fig. 4. Relationship between the time-course of each O2 profile and the total charge of individual •NO signals.
The graph shows the negative correlation (r=0.54) observed between delay in increase in O2 relative to stimulus application (Δt) and the total charge of each individual •NO signal (n = 15).
Inhibition of neuronal NOS
In order to confirm the association between neuronal •NO production and the decrease of O2 consumption in the CA1 subregion of the hippocampal slice, simultaneous recordings were performed in slices pre-treated with 3-Br-7-NI (30 µM), a potent inhibitor of NOS which has been shown to be more selective for the neuronal isoform in vivo [24]. For slices challenged with 100 µM NMDA, pre-treatment with the nNOS inhibitor resulted in 58.5% decrease in maximal •NO production, which was accompanied by a decrease in Δ[O2] of 50.9% relative to untreated hippocampal (Table I). These results suggest that the changes observed in O2 consumption were associated to •NO produced upon stimulation of the NMDAr.
Table 1.
Effect of 3-Bromo-7-Nitroindazole on •NO and O2 profiles in hippocampal slices challenged with NMDA
| [•NO]max, µM | Δ[O2], µM | |
|---|---|---|
| Control | 359.6 ± 42.6 (n=23) | 208.7 ± 27.2 (n=25) |
| 3-Br-7-NI | 149.3 ± 44.1 (n=10) ** | 102.3 ± 27.8 (n=9)* |
Values of maximal [•NO] and Δ[O2] observed in the CA1 subregion of the hippocampal slice upon application of NMDA 100 µM for 2 min for untreated slices (control) and slices pre-treated for 30–60 min with 3-Br-7-NI 30 µM. For [•NO], treatment with 3-Br-7-NI resulted in a 58.5% decrease while for [O2], decrease in response for treated slices was 50.9%. Values represent mean ± s.e.m.,
p<0.05;
p<0,005, relative do control and for t-studant test.
Calcium-dependency of both NMDA-evoked •NO production and variation in O2 consumption
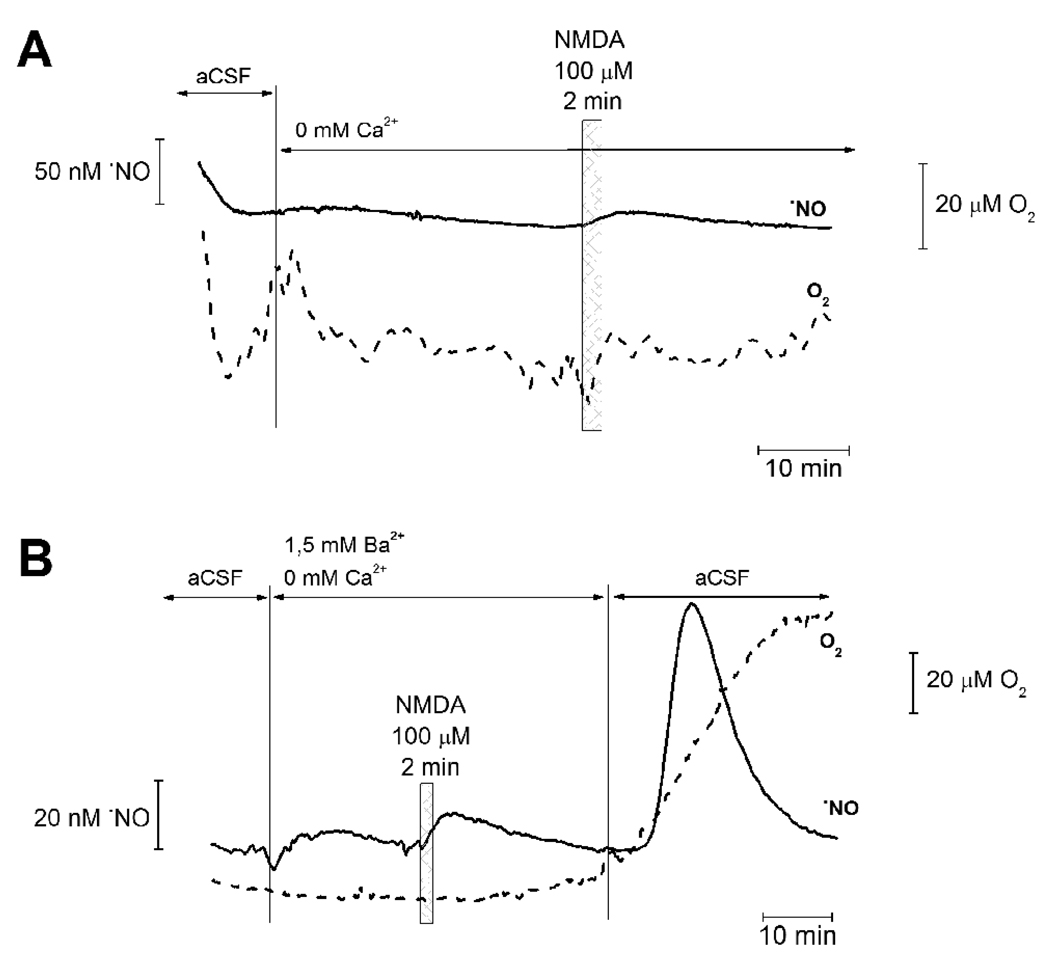
Production of •NO by the constitutively expressed nNOS is strictly dependant on the increase in intracellular Ca2+ [25]. In order to substantiate the association between NMDA-evoked •NO production and variation in O2 consumption rate, recordings were performed in Ca2+-free medium or using medium where Ca2+ was substituted for Ba2+. As shown in Figs. 5A and B, under both conditions, stimulation of the rat hippocampal slices with NMDA (100 µM) elicited no increase in •NO concentration and no variations in O2 consumption. Reintroduction of Ca2+ to the perfusion media lead to an increase in •NO concentration followed by decrease in O2 consumption rate (Fig. 5B).
Fig. 5. Calcium dependency of NMDA-evoked •NO and O2 profiles in hippocampal slices.
Simultaneous recording of •NO and O2 in the CA1 subregion of rat hippocampal slices challenged with NMDA in the absence of Ca2+ in perfusion media (A) or in media where Ca2+ has been substituted for Ba2+ (B). In the later situation, Ca2+ was reintroduced in the last section of the recording. In both cases, NMDA-evoked variations in •NO and O2 were abolished in the absence of Ca2+. Checkered boxes indicate moment of NMDA application (100 µM, perfused for a 2 minute time period).
Effect of cyanide on •NO and O2 profiles
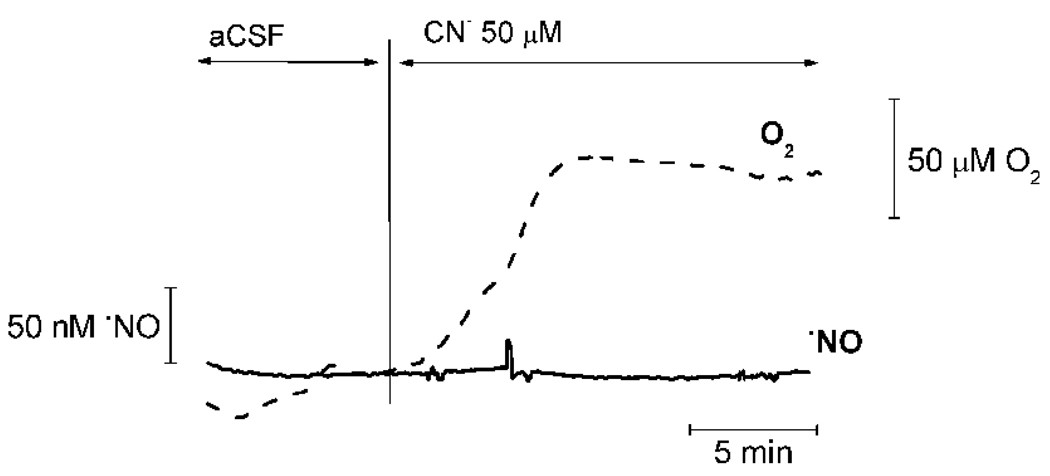
Cyanide can block CcO activity and inhibit mitochondrial respiration. By adding cyanide to the perfusion media, we compared the •NO and O2 profiles with those obtained in response to stimulation of hippocampal slices with NMDA. While no change was observed in •NO concentration in the hippocampal CA1 subregion, O2 consumption decreased in a similar fashion as observed when •NO production was evoked by NMDAr stimulation (Fig. 6), an expected observation since both •NO and cyanide block CcO.
Fig. 6. Effect of cyanide on •NO and O2 profiles in hippocampal slices.
Addition of the CN– (50 µM) to the perfusion media lead to an increase in O2 in the CA1 subregion of the hipppocampal slice, but has no effect on •NO concentration. The variation in the O2 profile was similar to that observed in the presence of NMDA-evoked •NO production.
DISCUSSION
Our previous study on •NO concentration dynamics resulting from stimulation of the NMDAr showed that the CA1 subregion – that presented physiological pO2 levels in resting conditions – generated the highest concentration of •NO [15]. In this study, we show for the first time real-time and simultaneous recordings of •NO and O2 levels during NMDAr activation in a model that preserves the cytoarchitecture and neuronal circuitry of the hippocampus. By placing two microsensors in close proximity of each other (~50 µm distance between electrodes), we were able to analyze the interacting profiles of the two gaseous molecules with high spatial and temporal resolution. The recordings and analysis presented point toward an intricate relationship between the profiles of •NO and O2 in the CA1 subregion of the rat hippocampus.
The simultaneous recordings of •NO and O2 (Fig.1) showed that activation of the NMDA-type of glutamate receptors in rat hippocampal slices leads to a transient increase in •NO concentration in the CA1 subregion, which seems associated with subsequent inhibition of O2 consumption. The coupling between •NO production and regulation of O2 consumption was further supported by the recordings performed in slices pre-treated with a potent NOS inhibitor, 3-Br-7-NI, as well as in recordings performed in the absence of Ca2+, which is responsible for bridging NMDAr activation to •NO production.
Prior to the inhibition of respiration, NMDA receptor activation induced a transient increase in O2 consumption (indicated as i in Fig. 1A). This most likely reflects an increase in energy demand in order to drive ion pumps to restore intracellular Na+ and Ca2+ levels after synaptic activity ([26, 27]). This increase in O2 consumption upon glutamatergic stimulation of neuronal activity has previously been observed in single cell recordings ([28]) and hippocampal slice cultures ([29]). The fact that this increase in O2 consumption is observed in the presence of increasing •NO concentrations seems to point toward a threshold concentration of the radical required to interfere with mitochondrial metabolism (further discussed below).
The recordings and analyses here presented suggest a direct relationship between the temporal and spatial profiles of •NO and O2 in the hippocampus, most probably due to the inhibition of cytochrome oxidase by •NO. Such an inhibition has been proposed as a physiological pathway for regulation of mitochondrial respiration, along with ADP and O2 [4, 5, 30, 31]. Cytochrome oxidase has similar binding constants for O2 and •NO (~2×10⁸ and 0.4 × 10⁸, respectively) [32–36]. Studies carried out in isolated mitochondria, synaptosomes, and cells [3–6, 37–39] revealed that cellular respiration was inhibited by relatively low levels of •NO (<0.1 µM), such as those described by us in the rat hippocampal slice [15].
The reversibility of O2 consumption rate after NMDAr stimulation to a basal value is dependent on the peak concentration of •NO achieved: while for low •NO production, inhibition of O2 consumption is reversed in the time of the recording (Fig. 1C), for higher •NO concentrations, inhibition is not reversed (Fig. 1A and B).
Because direct measurement of •NO binding to CcO has not yet been possible, the detailed molecular mechanism of inhibition has not yet been unequivocally established. The current experimental evidence and mathematical modeling suggest that CcO can display both O2-dependent (competitive, prevailing at high enzymatic turnover) and O2-independent (uncompetitive, prevailing in situations of low turnover) behaviors with respect to •NO inhibition [7, 9, 40]. Initially, this inhibition was described as •NO competing with O2 for the reduced (active) heme a3/CuB binuclear center of CcO [4] and half inhibition being achieved even for a low •NO/O2 ratio [41]. More recent findings revealed that a simple competitive model may be inadequate to explain the interaction of •NO with CcO, for – in addition to the fully reduced heme a3/CuB binuclear center – •NO can also bind to the oxidized CuB, which is not accessible to O2; the latter also renders CcO inactive [33, 35, 42, 43]. During uncompetitive inhibition of CcO by •NO, bound •NO is oxidized to nitrite [44], which must then be removed in order for enzyme activity to be restored [8, 9, 40, 44, 45].
The exact mechanism by which CcO is inhibited by •NO in vivo is not yet completely understood and while most authors agree that only one •NO molecule binds to the enzyme and that there is both a competitive and uncompetitive component to this reversible inhibition, other propose 2 binding sites for •NO at CcO ([7–9, 40, 44]. On the other hand, the EC50 for •NO inhibition varies with O2 concentration and enzymatic turnover, all factors that, alongside •NO concentration, are variable under our experimental conditions (as may be expected to occur in vivo).
The existence of a threshold of •NO in the hundred nM range seems to be incongruous considering the low Ki values for both the reduced and oxidized forms of CcO. Yet, recent evidence suggests that •NO can inhibit CcO without effecting the net O2 consumption, for in intact cells CcO does not operate to its full capacity [46, 47]. At low nM levels, •NO binds to a fraction of CcO at the binuclear heme a3/CuB center, thus inhibiting a sub-population of the enzyme. The increasing concentration of reduced cythochrome c will continue to reduce unbound CcO, which will undergo an increased turnover, thus maintaining cellular respiration. Only when a threshold concentration of •NO is achieved will CcO inhibition result in a net inhibition of O2 consumption. This view is in agreement with our data, which also suggests that the O2 evolution is dependent on a threshold of •NO. So, during this period where •NO is present but no decrease in O2 consumption is observed (Δt), partial inhibition of CcO cannot be ruled out.
The irreversible inhibition of other complexes of the mitochondrial respiratory chain by •NO and by •NO-derived species (e.g., ONOO– generated by the reaction of •NO with O2-•, reviewed in [48]) seems unlikely, for – if it were the case – O2 would probably increase to a level closer to that found in the perfusion media. Also, this type of irreversible inhibition of the complexes of the respiratory chain is proposed to occur for prolonged exposure to high (µM) concentrations of •NO, which is not the case in this experimental model.
Other authors have argued that, in vivo, •NO concentration will not reach the required concentration for inhibition of mitochondrial respiration to be observed ([49]). The data presented here, with direct and simultaneous recording of •NO and O2 upon stimulation of neuronal activity reveal that this may not be strictly true, at least in the CA1 pyramidal cell layer of the hippocampus. This discrepancy may be due to several factors: firstly, although both studies used brain slice preparations, we have used hippocampal slices, whilst in the referred paper cerebellar slices were used. Although both are neuronal tissue, variations in NMDAr/nNOS expression and coupling cannot be ignored as a contributing factor for observed differences. Also, Bellamy et. al conclude that the •NO concentration would not reach a concentration high enough to interfere with mitochondrial respiration based on cGMP quantification (as a measure of [•NO]) in tissue homogenates and the known values of EC50 for •NO/CcO. The quantification of cGMP is an indirect method, which allows for estimation of •NO concentration; however, all temporal and spatial resolution of the •NO signal is lost because the authors did not use real time measurements. As we have previously shown, NMDA-evoked •NO concentration dynamics may vary between different hippocampal subregions ([15]), and probably more so between different neuronal structures. The results presented here indicate that, at a localized level, NMDA-evoked •NO production can interfere with mitochondrial respiration.
Overall, the results presented here indicate that the relationship between neuronal •NO production and the control of O2 consumption rate is very complex at the tissue level and that, small differenced in the concentration dynamics of •NO may lead to different outcomes in terms of metabolic rate.
ACKNOWLEDGEMENTS
This work was supported by the Calouste Gulbenkian Foundation (Prémio Estímulo à Investigação 2004) and NIH Grant 2RO1 AG016718 (to EC).
ABBREVIATIONS
- NMDA
N-methyl-D-aspartate
- NMDAr
NMDA receptor
- •NO
nitric oxide
- CcO
cytochrome oxidase
- CA1/3
cornus ammon 1/3
- NOS
nitric oxide synthase
- DG
dentate gyrus
- CNS
central nervous system
- PSD-95
postsynaptic density protein 95
- aCSF
artificial cerebral-spinal fluid
Footnotes
Publisher's Disclaimer: This is a PDF file of an unedited manuscript that has been accepted for publication. As a service to our customers we are providing this early version of the manuscript. The manuscript will undergo copyediting, typesetting, and review of the resulting proof before it is published in its final citable form. Please note that during the production process errors may be discovered which could affect the content, and all legal disclaimers that apply to the journal pertain.
REFERENCES
- 1.Moncada S, Higgs A. The L-arginine-nitric oxide pathway. N Engl J Med. 1993;329:2002–2012. doi: 10.1056/NEJM199312303292706. [DOI] [PubMed] [Google Scholar]
- 2.Poulos TL. Soluble guanylate cyclase. Curr Opin Struct Biol. 2006;16:736–743. doi: 10.1016/j.sbi.2006.09.006. [DOI] [PubMed] [Google Scholar]
- 3.Bolanos JP, Peuchen S, Heales SJ, Land JM, Clark JB. Nitric oxide-mediated inhibition of the mitochondrial respiratory chain in cultured astrocytes. J Neurochem. 1994;63:910–916. doi: 10.1046/j.1471-4159.1994.63030910.x. [DOI] [PubMed] [Google Scholar]
- 4.Brown GC, Cooper CE. Nanomolar concentrations of nitric oxide reversibly inhibit synaptosomal respiration by competing with oxygen at cytochrome oxidase. FEBS Lett. 1994;356:295–298. doi: 10.1016/0014-5793(94)01290-3. [DOI] [PubMed] [Google Scholar]
- 5.Cleeter MW, Cooper JM, Darley-Usmar VM, Moncada S, Schapira AH. Reversible inhibition of cytochrome c oxidase, the terminal enzyme of the mitochondrial respiratory chain, by nitric oxide. Implications for neurodegenerative diseases. FEBS Lett. 1994;345:50–54. doi: 10.1016/0014-5793(94)00424-2. [DOI] [PubMed] [Google Scholar]
- 6.Schweizer M, Richter C. Nitric oxide potently and reversibly deenergizes mitochondria at low oxygen tension. Biochem Biophys Res Commun. 1994;204:169–175. doi: 10.1006/bbrc.1994.2441. [DOI] [PubMed] [Google Scholar]
- 7.Antunes F, Boveris A, Cadenas E. On the mechanism and biology of cytochrome oxidase inhibition by nitric oxide. Proc Natl Acad Sci U S A. 2004;101:16774–16779. doi: 10.1073/pnas.0405368101. [DOI] [PMC free article] [PubMed] [Google Scholar]
- 8.Antunes F, Cadenas E. The mechanism of cytochrome C oxidase inhibition by nitric oxide. Front Biosci. 2007;12:975–985. doi: 10.2741/2118. [DOI] [PubMed] [Google Scholar]
- 9.Cooper CE, Mason MG, Nicholls P. A dynamic model of nitric oxide inhibition of mitochondrial cytochrome c oxidase. Biochim Biophys Acta. 2008;1777:867–876. doi: 10.1016/j.bbabio.2008.03.021. [DOI] [PubMed] [Google Scholar]
- 10.Jarrard LE. What does the hippocampus really do? Behav Brain Res. 1995;71:1–10. doi: 10.1016/0166-4328(95)00034-8. [DOI] [PubMed] [Google Scholar]
- 11.Garthwaite J, Garthwaite G, Palmer RM, Moncada S. NMDA receptor activation induces nitric oxide synthesis from arginine in rat brain slices. Eur.J.Pharmacol. 1989;172:413–416. doi: 10.1016/0922-4106(89)90023-0. [DOI] [PubMed] [Google Scholar]
- 12.Prast H, Philippu A. Nitric oxide as modulator of neuronal function. Prog Neurobiol. 2001;64:51–68. doi: 10.1016/s0301-0082(00)00044-7. [DOI] [PubMed] [Google Scholar]
- 13.Burette A, Zabel U, Weinberg RJ, Schmidt HH, Valtschanoff JG. Synaptic localization of nitric oxide synthase and soluble guanylyl cyclase in the hippocampus. J Neurosci. 2002;22:8961–8970. doi: 10.1523/JNEUROSCI.22-20-08961.2002. [DOI] [PMC free article] [PubMed] [Google Scholar]
- 14.Christopherson KS, Hillier BJ, Lim WA, Bredt DS. PSD-95 assembles a ternary complex with the N-methyl-D-aspartic acid receptor and a bivalent neuronal NO synthase PDZ domain. J Biol Chem. 1999;274:27467–27473. doi: 10.1074/jbc.274.39.27467. [DOI] [PubMed] [Google Scholar]
- 15.Ledo A, Barbosa RM, Gerhardt GA, Cadenas E, Laranjinha J. Concentration dynamics of nitric oxide in rat hippocampal subregions evoked by stimulation of the NMDA glutamate receptor. Proc Natl Acad Sci U S A. 2005;102:17483–17488. doi: 10.1073/pnas.0503624102. [DOI] [PMC free article] [PubMed] [Google Scholar]
- 16.Frade JG, Barbosa RM, Laranjinha J. Stimulation of NMDA and AMPA glutamate receptors elicits distinct concentration dynamics of nitric oxide in rat hippocampal slices. Hippocampus. 2008;19:603–611. doi: 10.1002/hipo.20536. [DOI] [PubMed] [Google Scholar]
- 17.Barbosa RM, Silva AM, Tome AR, Stamford JA, Santos RM, Rosario LM. Control of pulsatile 5-HT/insulin secretion from single mouse pancreatic islets by intracellular calcium dynamics. J Physiol. 1998;510 (Pt 1):135–143. doi: 10.1111/j.1469-7793.1998.135bz.x. [DOI] [PMC free article] [PubMed] [Google Scholar]
- 18.Ferreira NR, Ledo A, Frade JG, Gerhardt GA, Laranjinha J, Barbosa RM. Electrochemical measurement of endogenously produced nitric oxide in brain slices using Nafion/o-phenylenediamine modified carbon fiber microelectrodes. Analytica Chimica Acta. 2005;535:1–7. [Google Scholar]
- 19.Santos RM, Lourenco CF, Piedade AP, Andrews R, Pomerleau F, Huettl P, Gerhardt GA, Laranjinha J, Barbosa RM. A comparative study of carbon fiber-based microelectrodes for the measurement of nitric oxide in brain tissue. Biosensors & bioelectronics. 2008;24:704–709. doi: 10.1016/j.bios.2008.06.034. [DOI] [PubMed] [Google Scholar]
- 20.Friedemann MN, Robinson SW, Gerhardt GA. o-Phenylenediamine-modified carbon fiber electrodes for the detection of nitric oxide. Anal Chem. 1996;68:2621–2628. doi: 10.1021/ac960093w. [DOI] [PubMed] [Google Scholar]
- 21.Foster KA, Beaver CJ, Turner DA. Interaction between tissue oxygen tension and NADH imaging during synaptic stimulation and hypoxia in rat hippocampal slices. Neuroscience. 2005;132:645–657. doi: 10.1016/j.neuroscience.2005.01.040. [DOI] [PubMed] [Google Scholar]
- 22.Wink DA, Grisham MB, Mitchell JB, Ford PC. Direct and indirect effects of nitric oxide in chemical reactions relevant to biology. Methods Enzymol. 1996;268:12–31. doi: 10.1016/s0076-6879(96)68006-9. [DOI] [PubMed] [Google Scholar]
- 23.Wink DA, Mitchell JB. Chemical biology of nitric oxide: Insights into regulatory, cytotoxic, and cytoprotective mechanisms of nitric oxide. Free radical biology & medicine. 1998;25:434–456. doi: 10.1016/s0891-5849(98)00092-6. [DOI] [PubMed] [Google Scholar]
- 24.Bland-Ward PA, Moore PK. 7-Nitro indazole derivatives are potent inhibitors of brain, endothelium and inducible isoforms of nitric oxide synthase. Life sciences. 1995;57:PL131–PL135. doi: 10.1016/0024-3205(95)02046-l. [DOI] [PubMed] [Google Scholar]
- 25.Bredt DS, Snyder SH. Isolation of nitric oxide synthetase, a calmodulin-requiring enzyme. Proc Natl Acad Sci U S A. 1990;87:682–685. doi: 10.1073/pnas.87.2.682. [DOI] [PMC free article] [PubMed] [Google Scholar]
- 26.Mattson MP, Liu D. Energetics and oxidative stress in synaptic plasticity and neurodegenerative disorders. Neuromolecular medicine. 2002;2:215–231. doi: 10.1385/NMM:2:2:215. [DOI] [PubMed] [Google Scholar]
- 27.Erecinska M, Nelson D, Silver IA. Metabolic and energetic properties of isolated nerve ending particles (synaptosomes) Biochim Biophys Acta. 1996;1277:13–34. doi: 10.1016/s0005-2728(96)00103-x. [DOI] [PubMed] [Google Scholar]
- 28.Gleichmann M, Collis LP, Smith PJ, Mattson MP. Simultaneous single neuron recording of O2 consumption, [Ca2+]i and mitochondrial membrane potential in glutamate toxicity. J Neurochem. 2009;109:644–655. doi: 10.1111/j.1471-4159.2009.05997.x. [DOI] [PMC free article] [PubMed] [Google Scholar]
- 29.Kann O, Schuchmann S, Buchheim K, Heinemann U. Coupling of neuronal activity and mitochondrial metabolism as revealed by NAD(P)H fluorescence signals in organotypic hippocampal slice cultures of the rat. Neuroscience. 2003;119:87–100. doi: 10.1016/s0306-4522(03)00026-5. [DOI] [PubMed] [Google Scholar]
- 30.Brown GC, Borutaite V. Nitric oxide inhibition of mitochondrial respiration and its role in cell death. Free radical biology & medicine. 2002;33:1440–1450. doi: 10.1016/s0891-5849(02)01112-7. [DOI] [PubMed] [Google Scholar]
- 31.Poderoso JJ, Carreras MC, Lisdero C, Riobo N, Schopfer F, Boveris A. Nitric oxide inhibits electron transfer and increases superoxide radical production in rat heart mitochondria and submitochondrial particles. Arch Biochem Biophys. 1996;328:85–92. doi: 10.1006/abbi.1996.0146. [DOI] [PubMed] [Google Scholar]
- 32.Brunori M, Forte E, Arese M, Mastronicola D, Giuffre A, Sarti P. Nitric oxide and the respiratory enzyme. Biochim Biophys Acta. 2006;1757:1144–1154. doi: 10.1016/j.bbabio.2006.05.011. [DOI] [PubMed] [Google Scholar]
- 33.Brudvig GW, Stevens TH, Chan SI. Reactions of nitric oxide with cytochrome c oxidase. Biochemistry. 1980;19:5275–5285. doi: 10.1021/bi00564a020. [DOI] [PubMed] [Google Scholar]
- 34.Gibson QH, Greenwood C. Reactions of cytochrome oxidase with oxygen and carbon monoxide. Biochem J. 1963;86:541–554. doi: 10.1042/bj0860541. [DOI] [PMC free article] [PubMed] [Google Scholar]
- 35.Stevens TH, Brudvig GW, Bocian DF, Chan SI. Structure of cytochrome a3-Cua3 couple in cytochrome c oxidase as revealed by nitric oxide binding studies. Proc Natl Acad Sci U S A. 1979;76:3320–3324. doi: 10.1073/pnas.76.7.3320. [DOI] [PMC free article] [PubMed] [Google Scholar]
- 36.Wainio WW. Reactions of cytochrome oxidase. J Biol Chem. 1955;212:723–733. [PubMed] [Google Scholar]
- 37.Carr GJ, Ferguson SJ. Nitric oxide formed by nitrite reductase of Paracoccus denitrificans is sufficiently stable to inhibit cytochrome oxidase activity and is reduced by its reductase under aerobic conditions. Biochim Biophys Acta. 1990;1017:57–62. doi: 10.1016/0005-2728(90)90178-7. [DOI] [PubMed] [Google Scholar]
- 38.Clementi E, Brown GC, Foxwell N, Moncada S. On the mechanism by which vascular endothelial cells regulate their oxygen consumption. Proc Natl Acad Sci U S A. 1999;96:1559–1562. doi: 10.1073/pnas.96.4.1559. [DOI] [PMC free article] [PubMed] [Google Scholar]
- 39.Sarti P, Silver RB, Paroli L, Nikonorov I, Blanck TJ. Permeability of rat heart myocytes to cytochrome c. Cell Mol Life Sci. 1999;56:1061–1069. doi: 10.1007/s000180050493. [DOI] [PMC free article] [PubMed] [Google Scholar]
- 40.Mason MG, Nicholls P, Wilson MT, Cooper CE. Nitric oxide inhibition of respiration involves both competitive (heme) and noncompetitive (copper) binding to cytochrome c oxidase. Proc Natl Acad Sci U S A. 2006;103:708–713. doi: 10.1073/pnas.0506562103. [DOI] [PMC free article] [PubMed] [Google Scholar]
- 41.Brown GC. Regulation of mitochondrial respiration by nitric oxide inhibition of cytochrome c oxidase. Biochim Biophys Acta. 2001;1504:46–57. doi: 10.1016/s0005-2728(00)00238-3. [DOI] [PubMed] [Google Scholar]
- 42.Boelens R, Wever R, Van Gelder BF, Rademaker H. An EPR study of the photodissociation reactions of oxidised cytochrome c oxidase-nitric oxide complexes. Biochim Biophys Acta. 1983;724:176–183. doi: 10.1016/0005-2728(83)90136-6. [DOI] [PubMed] [Google Scholar]
- 43.Hill BC, Brittain T, Eglinton DG, Gadsby PM, Greenwood C, Nicholls P, Peterson J, Thomson AJ, Woon TC. Low-spin ferric forms of cytochrome a3 in mixed-ligand and partially reduced cyanide-bound derivatives of cytochrome c oxidase. Biochem J. 1983;215:57–66. doi: 10.1042/bj2150057. [DOI] [PMC free article] [PubMed] [Google Scholar]
- 44.Sarti P, Giuffre A, Forte E, Mastronicola D, Barone MC, Brunori M. Nitric oxide and cytochrome c oxidase: mechanisms of inhibition and NO degradation. Biochem Biophys Res Commun. 2000;274:183–187. doi: 10.1006/bbrc.2000.3117. [DOI] [PubMed] [Google Scholar]
- 45.Cooper CE, Torres J, Sharpe MA, Wilson MT. Nitric oxide ejects electrons from the binuclear centre of cytochrome c oxidase by reacting with oxidised copper: a general mechanism for the interaction of copper proteins with nitric oxide? FEBS Lett. 1997;414:281–284. doi: 10.1016/s0014-5793(97)01009-0. [DOI] [PubMed] [Google Scholar]
- 46.Palacios-Callender M, Hollis V, Mitchison M, Frakich N, Unitt D, Moncada S. Cytochrome c oxidase regulates endogenous nitric oxide availability in respiring cells: a possible explanation for hypoxic vasodilation. Proc Natl Acad Sci U S A. 2007;104:18508–18513. doi: 10.1073/pnas.0709440104. [DOI] [PMC free article] [PubMed] [Google Scholar]
- 47.Rodriguez-Juarez F, Aguirre E, Cadenas S. Relative sensitivity of soluble guanylate cyclase and mitochondrial respiration to endogenous nitric oxide at physiological oxygen concentration. Biochem J. 2007;405:223–231. doi: 10.1042/BJ20070033. [DOI] [PMC free article] [PubMed] [Google Scholar]
- 48.Brown GC. Nitric oxide and mitochondria. Front Biosci. 2007;12:1024–1033. doi: 10.2741/2122. [DOI] [PubMed] [Google Scholar]
- 49.Bellamy TC, Griffiths C, Garthwaite J. Differential sensitivity of guanylyl cyclase and mitochondrial respiration to nitric oxide measured using clamped concentrations. J Biol Chem. 2002;277:31801–31807. doi: 10.1074/jbc.M205936200. [DOI] [PubMed] [Google Scholar]


