Abstract
Oxidative injury to cells such as the retinal pigment epithelium (RPE) is often modeled using H2O2-treated cultures, but H2O2 concentrations are not sustained in culture medium. Here medium levels of H2O2 and cytotoxicity were analyzed in ARPE-19 cultures following H2O2 delivery as a single pulse or with continuous generation using glucose oxidase (GOx). When added as a pulse, H2O2 is rapidly depleted (within 2 hr); cytotoxicity at 24, determined by the MTT assay for mitochondrial function, is unaffected by medium replacement at 2 hr. Continuous generation of H2O2 produces complex outcomes. At low GOx concentrations, H2O2 levels are sustained by conditions in which generation matches depletion, but when GOx concentrations produce cytotoxic levels of H2O2, oxidant depletion accelerates. Acceleration results partly from the release of contents from oxidant damaged cells as indicated by testing depletion after controlled membrane disruption with detergents. Cytotoxicity analyses show that cells can tolerate short exposure to high H2O2 doses delivered as a pulse but are susceptible to lower chronic doses. The results provide broadly applicable guidance for using GOx to produce sustained H2O2 levels in cultured cells. This approach will be specifically useful for modeling chronic stress relevant for RPE aging and have wider value for studying cellular effects of sub-lethal oxidant injury and for evaluating antioxidants that may protect significantly against mild but not lethal stress.
Keywords: hydrogen peroxide, oxidative stress, glucose oxidase, ARPE-19 cells
INTRODUCTION
Hydrogen peroxide (H2O2) treatment of cultured cells is a commonly-used model to test oxidative stress susceptibility or antioxidant efficiency in cell types that are at high risk for oxidative damage in vivo, such as cells of the retinal pigment epithelium (RPE). The RPE is located adjacent to the outer retina where it performs functions essential for photoreceptor survival. Oxidative stress to the largely non-mitotic RPE cell layer over time is theorized to produce tissue dysfunction that contributes to the development of age-related macular degeneration (AMD) [1–3].
The RPE is at high risk for oxidative stress since it resides in an environment of high oxygen tension and is exposed to phototoxic blue light [4,5]. Among the reactive oxygen species to which the cells are exposed is hydrogen peroxide. As in most cells, H2O2 is generated during normal oxygen metabolism in mitochondria. In the RPE, H2O2 is also produced during daily phagocytosis of shed photoreceptor outer segments [6] and is generated as a consequence of light irradiation of the pigment melanin [7,8].
H2O2 has been used in many investigations of oxidative stress to the RPE in which the agent was added to the culture medium of the immortalized human RPE cell line ARPE-19 followed by various measures of cytotoxicity [9–16]. Since H2O2 is a small, non-charged molecule, it easily crosses cell membranes and localizes in multiple sub-cellular compartments (for review see [17]). The intrinsic chemical reactivity of H2O2 is relatively low, but on exposure to redox-active metal ions, H2O2 decomposes to the very reactive hydroxyl radical (OH•) [18,19], which is presumed to be responsible for hydrogen peroxide’s cytotoxicity.
Although H2O2 addition to cell cultures is a common model of stress induction, its concentration in the medium over the period of cell treatment is usually not determined or controlled. Concentration is of significance since the effects of H2O2 are concentration dependent and range from physiological signaling [18,20–23] to overt cell death. H2O2 is typically added to culture medium as a single pulse at empirically-determined concentrations but the availability of H2O2 to cells changes over time as the agent is depleted from the medium.
The kinetics of H2O2 decomposition over short time frames (1–2 hr) has been examined in cultures of several monolayer cell types [24,25] including the RPE [10]. In the analysis using RPE cells, H2O2 concentration was examined in cultures under serum-free conditions and the agent was found to be largely depleted from the culture medium within an hour of addition [10]. H2O2 concentration was not, however, the major focus of this investigation and the assay that was employed, which is based on the oxidation of o-dianisidine dihydrochloride [26], is sensitive to the presence of oxygen. Here therefore we re-evaluated the time course of H2O2 availability to RPE cultures using a modification of an alternative, oxygen-insensitive method that can be used to quantify H2O2 in biological samples [27]. By the addition of catalase to the assay, the contribution of H2O2 can further be distinguished from organic hydroperoxides [27,28]. Using this technique, we quantified changes in the concentration of hydrogen peroxide over time in the culture medium of ARPE-19 cells and compared the results for oxidant delivered by two methods: as a single-addition pulse, or by continuous enzymatic generation using glucose/glucose oxidase. For the latter, H2O2 was determined over a long time course (24 hr). Measurements of H2O2 depletion in culture medium were coupled with analyses of ARPE-19 cell cytotoxicity.
MATERIALS AND METHODS
Reagents
Iron (II) ammonium sulfate hexahydrate (Mohr’s Salt) was from Fisher Scientific (Fair Lawn, NJ, USA). Bovine Serum Albumin (BSA), Butylated Hydroxytoluene (BHT), catalase, digitonin, glucose oxidase (from Aspergillus niger), 3-[4,5-dimethylthiazo-2-yl]-2,5-diphenyl tetrazolium bromide (MTT), and xylenol orange disodium salt were from Sigma-Aldrich ChemieGmbh (Steinheim, Germany). Hydrogen peroxide was from Standard Company (Lublin, Poland). Dimethyl Sulfoxide (DMSO) and methanol were from Polish Chemical Reagents (POCh; Gliwice, Poland). Penicillin and streptomycin were from Polfa Tarchomin S.A. (Warsaw, Poland).
Hydrogen peroxide treatment of cell cultures
ARPE-19 cells (American Type Culture Collection, Rockville, MD) were propagated using twice weekly feedings of Minimal Essential Medium (MEM) containing 10% fetal bovine serum (FBS) and antibiotics (penicillin 150 U/ml and streptomycin 0.1 mg/ml). For H2O2 treatment experiments, cells were plated in MEM containing 10% FBS in 24-well plates at a density of 100×103 cells/cm2 to produce confluency on day 1 post-plating when exposure to H2O2 was initiated. Two H2O2 treatment protocols were used: pulse delivery of a range of concentrations of H2O2, or addition of glucose oxidase to initiate continuous enzymatic generation of the oxidant.
For pulse delivery, culture medium was first removed and cells were rinsed twice with phosphate-buffered saline (PBS) containing calcium and magnesium ions (PBS-Ca/Mg). Cultures were fed with MEM, plus or minus 10% FBS, containing either no H2O2 (control) or a range of concentrations of H2O2 to 400 μM, freshly prepared in deionized water. After incubation with the oxidant for intervals to 3 hrs, cells were rinsed twice with PBS-Ca/Mg then re-fed with fresh MEM plus 10% FBS.
For continuous enzymatic generation of H2O2, the cultures were first re-fed with fresh MEM containing 10% FBS. Glucose oxidase (GOx) was then added to the medium to initiate the generation of H2O2 by oxidation of the glucose contained in MEM (1 mg/ml D-glucose). Stock solutions of GOx were pre-prepared by solubilizing the enzyme in 50 mM sodium acetate buffer, pH 5.1, at a concentration of 10 kU/ml and storing aliquots at −20 °C. Just prior to use, stock solutions were thawed, diluted and added to the culture medium to produce final concentrations of 3–10 mU/ml. GOx was also added to medium in culture wells lacking cells to determine H2O2 production in the absence of culture monolayers.
After addition of H2O2 (pulse delivery) or of GOx (to initiate continuous H2O2 generation), aliquots of culture medium were retrieved at intervals to determine H2O2 levels and cells were harvested after 24 hr to assay for cytotoxicity by the methods described below.
In some experiments membrane disrupting agents were added to cultures to determine whether release of cellular contents such as antioxidant enzymes affected H2O2 decomposition in the culture medium. For these experiments, release was titrated using digitonin as previously described [29,30]. Briefly, digitonin was prepared by dissolving the agent in water at 100 mg/ml with heating (98° C), then cooling to room temperature and adding to culture medium with serum to generate a concentration of 1.0 mg/ml. To produce a graded disruption of membrane compartments, serial dilutions of digitonin in medium were prepared in the range of 0.0001–1.0 mg/ml for addition to ARPE-19 cultures. Complete membrane disruption was achieved by the addition of 0.1% Triton X-100 [29,30,31] in culture medium containing serum. Fifteen minutes after the addition of digitonin or Triton X-100, H2O2 was added as a pulse or glucose oxidase was added at a final concentration of 10 mU/ml to initiate H2O2 generation. Medium H2O2 was determined following a 1 hr incubation as described below.
Hydrogen peroxide determination
Hydrogen peroxide concentration in culture medium was determined by a modified Ferrous Oxidation – Xylenol Orange (FOX2) assay [27, 28, 32]. Concentrated FOX reagent contained 1 mM xylenol orange disodium salt and 2.5 mM ammonium ferrous sulfate (Mohr’s salt) in 250 mM H2SO4. Just prior to use, one volume of concentrated reagent was added to 9 volumes of methanol containing 4.4 mM butylated hydroxytoluene (BHT) to produce complete FOX reagent.
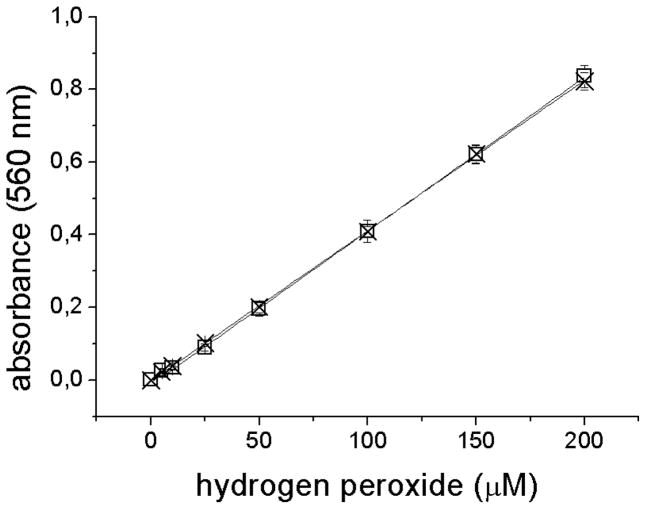
For the assay, an aliquot of medium retrieved from ARPE-19 cultures (100 μl MEM, plus or minus 10% FBS), was mixed with 900 μl complete FOX reagent. Samples were incubated for 30 min at room temperature and centrifuged for 10 min at 20,200 × g. Absorbance of the supernatant was read spectrophotometrically at 560 nm against methanol as background control. Preliminary experiments were conducted to confirm that the presence of serum did not affect H2O2 measurement. As shown (Fig. 1), hydrogen peroxide determinations did not differ for a range of concentrations of H2O2 added to MEM either lacking serum or containing 10% FBS.
Fig. 1.
H2O2 determinations in the presence and absence of serum using the FOX2 assay. Calibration curves for H2O2 concentrations in the range of 0 – 200 μM were measured immediately after oxidant addition to MEM without (X; linear regression: y = 0.0041x − 0.0018, r2 = 0.9999) and with 10% FBS (□; linear regression: y = 0.0042x − 0.0135, r2 = 0.9998).
Since oxidation of ferrous to ferric ions in biological samples could also result from the interaction of ferrous ions with organic hydroperoxides, H2O2 specificity was confirmed by measuring absorbance in samples without and with catalase as previously described [28] using catalase at a final concentration of 220 U/ml in the assay mix.
Cytotoxicity assay
Cytotoxicity was determined by the MTT assay for mitochondrial redox function 24 hr after treatment of ARPE-19 cultures with H2O2 or GOx. According to the protocol, a stock solution of MTT (5.0 mg/ml in PBS) was diluted with MEM/10% FBS to a final concentration of 0.5 mg/ml and added to cells in control (untreated) or H2O2-treated culture wells. After incubation for 90 min at 37° C, the resulting blue precipitate was solubilized in DMSO:ethanol (1:1). Absorbance at 560 nm was determined and results are reported as a percent of untreated controls.
RESULTS AND DISCUSSION
Pulse delivery of H2O2
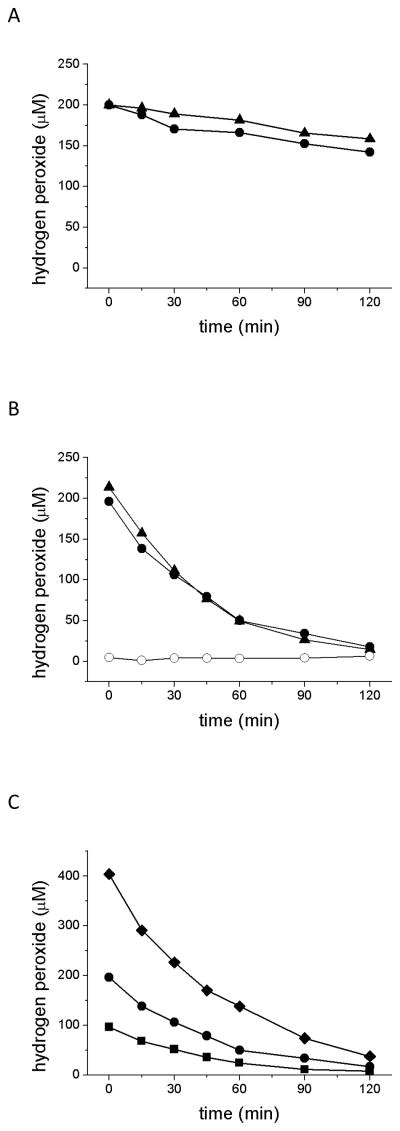
The response of cultured cells to chemical oxidants such as H2O2 is likely determined by both the concentration of the agent and the time of exposure. The most common method for delivering H2O2 to cultures is as a single addition (pulse) into the medium, but the time of exposure is not well controlled using this protocol because the initial concentration is not sustained (Fig. 2). In the absence of cells, H2O2 concentration in culture medium declines slowly with time (Fig. 2A). As illustrated for an initial concentration of 200 μM, the depletion rate is similar over 2 hr at 37° C in the absence and presence of serum (Fig. 2A). It is not clear which component(s) of MEM is responsible for the slow but measureable decomposition of H2O2 in medium, which is nearly an order of magnitude higher than in PBS (data not shown). Perhaps amino acids present in MEM, such as methionine, cysteine and tryptophane, interact with H2O2, leading to its consumption [33,34]. Serum, however, has little effect on H2O2 stability.
Fig. 2.
H2O2 depletion in culture medium incubated alone (A), or incubated in the presence of ARPE-19 cells (B and C). For A and B, 200 μM H2O2 was added to the medium at time 0 and aliquots of medium were withdrawn at intervals to 120 min for determination of H2O2. (A) H2O2 decomposition was similar in culture medium in the absence (▲) and presence (●) of serum (decay rate constants were kd = 0.0020 min−1 and 0.0027 min−1, respectively). (B) H2O2 decomposition was more rapid in medium incubated with cells but did not differ in the absence (▲) and presence (●) of serum; decay rate constants were kd = 0.0228 min−1 and 0.0198 min−1, respectively. Addition of catalase to medium with serum confirms the specificity of the determinations for H2O2 (O). (C) H2O2 was added to serum-containing medium in a range of concentrations: 100 μM (■), 200 μM (●) and 400 μM (◆); decay rate constants were kd = 0.0192 min−1, 0.0198 min−1 and 0.0211 min−1, respectively.
In the presence of cells, H2O2 concentration in culture medium undergoes a much more rapid, exponential decrease with incubation time in both the absence and presence of serum (Fig. 2B). As shown for a starting H2O2 concentration of 200 μM, the half time of depletion is 35 minutes. By 2 hr the concentration of H2O2 in culture medium had diminished more than 10-fold. Similar outcomes are obtained for starting H2O2 concentrations across the range of 100–400 μM (Fig. 2C). A rapid depletion of H2O2 from serum-free medium exposed to RPE cultures was previously obtained using another method [10]. An apparent linear loss was shown (although kinetics were not discussed), while we observed an exponential decline. Exponential decay is consistent with results observed for other cell types [24] and indicates a first order reaction with dependence on substrate concentration. Regardless of the kinetics, from the pragmatic point of view, the significant observation is that H2O2 is not sustained at the added concentration when the agent is delivered as a pulse.
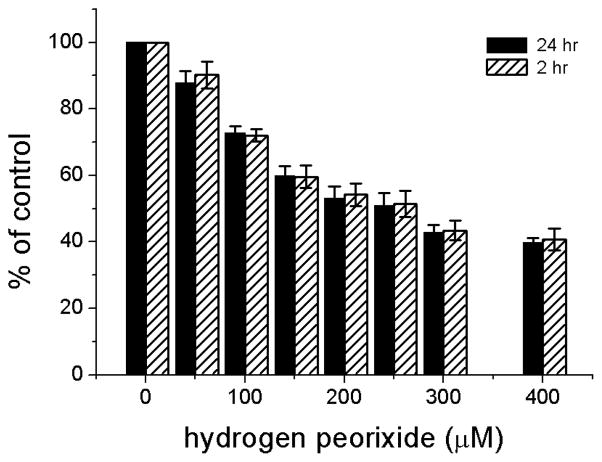
It is well established that H2O2 added to the medium of ARPE-19 cells as a single pulse produces an oxidant dose-dependent cytotoxicity that can be detected by the MTT assay 24 hr after treatment [9,13,35] (Fig. 3). Since H2O2 is largely depleted from culture medium within 2 hr (Figs. 2B, C), one would expect similar cytotoxicity whether the medium is replaced with fresh medium at 2 hr after oxidant addition or remains unchanged until the time of assay. As shown, similar outcomes are in fact obtained (Fig. 3).
Fig 3.
Cytotoxicity in confluent cultures of ARPE-19 cells after addition of H2O2. A range of concentrations of H2O2 from 0–400 μM was added to serum-containing MEM. Cytotoxicity was estimated 24 hr after H2O2 addition by the MTT assay in cultures in which the medium was not replaced (solid bars) or was replaced at 2 hr with fresh, H2O2–free MEM (hatched bars). Data, expressed as a percent of the untreated control, are from three independent experiments and are the means of three culture wells per group. Error bars indicate SD.
Continuous enzymatic generation of H2O2
Since H2O2 is labile in culture medium, sustained exposure to a given concentration is difficult to achieve when the agent is delivered in a single pulse. An alternative method for sustained H2O2 treatment of cultures is to continuously generate the product from medium glucose using glucose oxidase (GOx). This approach has been used for short-term treatment of cultured cells [30,36,37] including, recently, ARPE-19 cells [38]. However, the concentrations of H2O2 that are achieved or sustained in culture over longer time frames (to 24 hr) have not been determined, nor has cytotoxicity under these conditions of continuous exposure been evaluated.
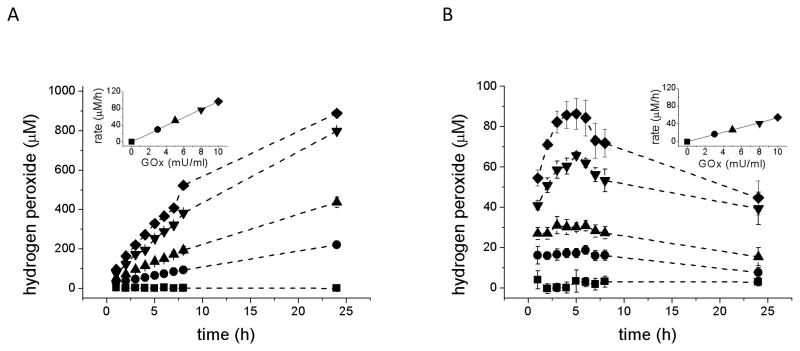
The addition of GOx to culture medium (MEM) produces a linear rate of accumulation of H2O2 as a function of enzyme concentration during the first hour of incubation in both the absence and presence of ARPE-19 cells (Fig. 4A and B, insets), although the rate of accumulation in the absence of cells is approximately twice as great as when cells are present. In the absence of cells, H2O2 concentration continues to increase over 24 hr, albeit at a lower rate than during the first hour (Fig. 4A and Table 1), perhaps because of partial GOx inhibition by glucose oxidation products such as hydrogen peroxide [39,40].
Fig. 4.
H2O2 concentration in culture medium generated from D-glucose after addition of glucose oxidase (GOx). GOx was added to the medium of culture wells without (A) or with (B) confluent cultures of ARPE-19 cells at the following concentrations: 0 (■) (control, without GOx), 3 mU/ml (●), 5 mU/ml (▲), 8 mU/ml (▼;), 10 mU/ml (◆). Aliquots of medium were taken at intervals to 24 hr and H2O2 concentration was determined. Since higher medium concentrations are achieved in the absence of cells, different y-axis scales are used. Data are from three independent experiments and are the means of three culture wells per group in each experiment. Error bars indicate SD.
The insets show the medium concentration of H2O2 at 1 hr post addition of 0 – 10 mU/ml GOx to illustrate the initial linear accumulation of H2O2 as a function of enzyme concentration and the more rapid accumulation in the absence (inset A) as compared to the presence (inset B) of cells.
Table 1.
Rates of H2O2 production by oxidation of D-glucose in MEM measured in culture medium without cells at intervals after GOx addition.
| Glucose oxidase (GOx) [mU/ml] | Rates of H2O2 production in medium without cells (μM × h−1 ) | ||
|---|---|---|---|
| during hr 1 | hrs 1–8 | hrs 8–24 | |
| 2 | 18.6 | 4.8 | 5.6 |
| 3 | 29.2 | 9.2 | 8.1 |
| 5 | 51.3 | 20.2 | 15.2 |
| 8 | 76.1 | 42.3 | 22.8 |
| 10 | 96.4 | 56.1 | 26.0 |
In the presence of cells (Fig. 4B), the concentration of H2O2 in the culture medium over time after GOx addition is strikingly different than in the absence of cells, and the pattern differs with enzyme concentration. With lower amounts of GOx (e.g., 3 mU/ml) H2O2 concentration in the medium is nearly stationary in the presence of cells, at least during the first 8 hrs after GOx addition. This outcome probably results from conditions in which the rates of H2O2 production and decomposition are approximately equal. With higher GOx amounts (e.g., 8 or 10 mU/ml), H2O2 concentration exhibits a complex dynamic. The concentration continues to rise after the first hour of enzyme addition, peaks at approximately 5 hrs, then decreases thereafter. Using 8 mU/ml GOx delivery to the ARPE-19 cultures as an example, H2O2 concentration achieved a maximum concentration of 70 μM at 5 hr and then declined to 40 μM by 24 hr (Fig. 4B). (The possible mechanisms underlying these changes in medium content of H2O2 are discussed in the next section.)
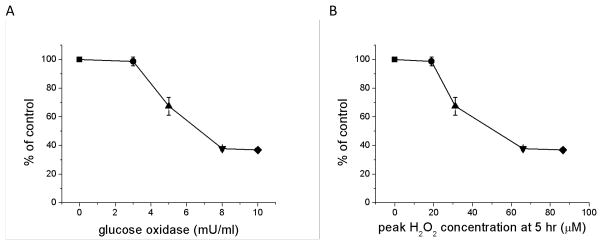
As for delivery of H2O2 in a single pulse (Fig. 3), GOx addition to culture medium also produces a dose-dependent cytotoxic response in confluent ARPE-19 cultures quantified by the MTT assay at 24 hr post addition (Fig. 5). Low amounts of added enzyme (e.g., 3 mU/ml) had little effect, but cytotoxicity was substantial at higher concentrations (e.g., 8 and 10 mU/ml) (Fig. 5A). This observation is noteworthy because the peak concentrations of H2O2, achieved at 5 hr post addition of higher concentrations enzyme (Fig. 4B), were relatively low as compared to peak concentrations that produced cytotoxicity when H2O2 was added in a single pulse (Fig. 3). Using 8 mU/ml GOx again as an example, the peak concentration of 70 μM H2O2 produced by this amount of enzyme reduced MTT by more than 60% at 24 hr (Fig. 5B), yet 250–300 μM H2O2 was required to produce comparable MTT reductions when the oxidant was delivered as a pulse (Fig. 3). Clearly, however, the dynamics of oxidant exposure to cells differ under the two conditions. When delivered as a pulse, H2O2 is depleted fairly rapidly (Fig. 2) while the GOx-treated cells were exposed to more sustained moderate concentrations over the full 24 hr incubation time (Fig. 4B).
Fig 5.
Cytotoxicity in confluent cultures of ARPE-19 cells after addition of glucose oxidase (GOx). GOx was added to serum-containing culture medium in a range of concentrations (3 [●], 5 [▲], 8 [▼], and 10 mU/ml [◆]), and cytotoxicity was estimated after 24 hr by the MTT assay with results reported as a percent of the no GOx control (■). Cytotoxicity is shown as a function of (A) GOx concentration and (B) the peak concentration of H2O2 achieved at 5 hr post GOx addition. The H2O2 concentrations were determined from the results of the paired experiment shown in Figure 4B. Data, expressed as a percent of the untreated control, are from three independent experiments and are the means of three culture wells per group in each experiment. Error bars indicate SD.
Cytotoxicity and H2O2 depletion in ARPE-19 cell cultures
As discussed above, the depletion of H2O2 added to culture medium is accelerated, and the accumulation of H2O2 generated enzymatically is suppressed, in the presence of ARPE-19 cells as compared to their absence. Cell dependent factors are therefore a major determinant of H2O2 availability to cultures over time.
When H2O2 is delivered to or generated outside cells, a gradient is established across the cell membrane [30] that depends not only on the extracellular concentration of the oxidant, but also on plasma membrane permeability to H2O2 [17,24,25] and on the amount and availability of enzymes that decompose H2O2, which include glutathione peroxidase (GPx) and catalase [24,25]. Experiments described above involving GOx administration to ARPE-19 cultures suggested that the moderate fluxes of H2O2 produced by low amounts of enzyme (e.g. 3 mU/ml) yield conditions in which the generation of oxidant is in balance with its removal from medium such that H2O2 does not continue to accumulate after the first hour (Fig. 4B). However, at enzyme levels above 5 mU/ml a different dynamic occurs in the ARPE-19 cultures; H2O2 concentration transiently increases (to 5 hrs) then decreases. Since cell toxicity also occurs at the higher enzyme amounts (Fig. 5A), we theorized that H2O2-induced cellular damage mediated the late fluctuations in medium oxidant concentration. Specifically, we hypothesized that release of cellular contents due to oxidant-induced cell membrane damage contributes to H2O2 medium depletion.
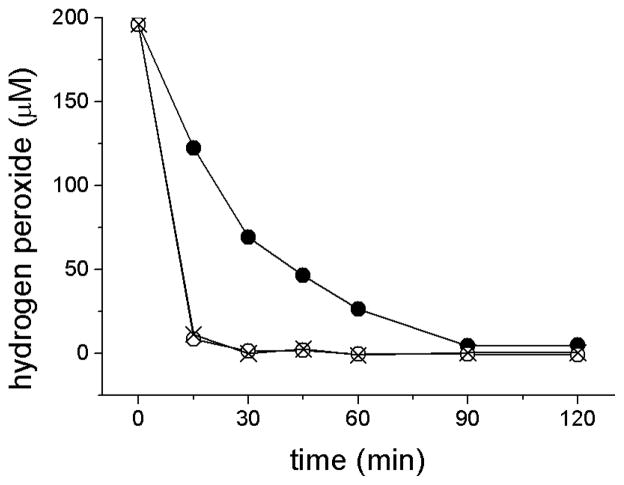
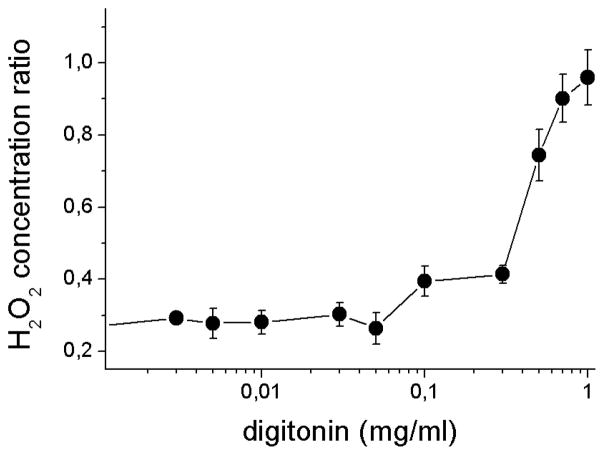
To test this hypothesis, ARPE-19 cells were subjected to detergent treatment to solubilize cell membranes, followed by analysis of medium H2O2 concentration. As shown (Fig. 6), disruption of cell membranes with Triton X-100 or high concentrations of digitonin (1.0 mg/ml) elicits rapid depletion of H2O2 added to culture medium. To further evaluate the effects of membrane disruption, membrane damage was titrated by treatment with a range of digitonin concentrations using methods developed to elicit a sequential release of contents from sub-cellular compartments [29,30]. For these experiments, H2O2 was generated by GOx addition to the ARPE-19 cultures after digitonin treatment; preliminary experiments confirmed that detergent did not inhibit GOx activity (not shown). H2O2 concentration in the culture medium was measured after 1 hr of incubation and expressed as a ratio of the H2O2 concentration after full membrane disruption (with Triton treatment) to partial membrane disruption (with varying digitonin levels) (Fig. 7). The ratio (approximately 0.3) was found to be nearly constant in lower concentrations of digitonin (to 0.05 mg/ml), but increased biphasically, initially to 0.4 at intermediate digitonin levels (0.1 to 0.3 mg/ml), and then to 1.0 at high levels (0.3 – 1.0 mg/ml). A similar pattern of ratios was obtained for additional GOx concentrations and incubation times (not shown).
Fig. 6.
H2O2 depletion in serum-containing culture medium incubated in the presence of intact ARPE-19 cells (●) or ARPE-19 cells disrupted by a 15 min pre-incubation in 0.1% Triton X-100 (O) or 1 mg/ml digitonin (X). H2O2 (200 μM) was added to the medium and aliquots of medium were withdrawn at intervals thereafter to 120 min for determination of H2O2.
Fig. 7.
H2O2 in serum-containing culture medium incubated with ARPE-19 cells disrupted by detergent treatment. Cells were pre-treated for 15 min with a range of concentrations of digitonin (0.0001 – 1.0 mg/ml) to produce partial cell disruption, or 0.1% Triton X-100 to produce full disruption. Glucose oxidase (10 mU/ml) was added to the culture medium to initiate H2O2 generation and medium concentrations of H2O2 were determined after 1 hr. Data are means of two culture wells in two independent experiments and are reported as the ratio of the H2O2 concentration in fully disrupted (Triton X-100) to partially disrupted (in digitonin) cells. Error bars indicate SD.
These results suggest that cytotoxic levels of H2O2 sufficient to cause membrane leakiness in cultured cells, which could occur as a consequence of H2O2–induced oxidation of unsaturated membrane lipids [41–43], contributes to the depletion of medium H2O2. The released cellular contents that produce accelerated H2O2 depletion on detergent treatment were not identified, but it is likely that contributors include H2O2–degrading enzymes GPx and catalase. The biphasic depletion effects resulting from digitonin treatment may also be attributed to these two enzymes, which are differentially compartmentalized within cells; GPx is cytosolic whereas catalase is largely confined to peroxisomes. Lower concentrations of digitonin are expected to disrupt plasma membranes releasing largely GPx, while higher concentrations sufficient to disrupt organellar membranes [29,30] could release catalase from peroxisomes. Regardless of the mediators of H2O2 depletion following membrane disruption, an important contributor to the dynamic changes in H2O2 availability to cultures over time appears to be the extent to which cells remain intact.
Technical and biological ramifications
H2O2 has multiple cellular effects ranging from cell signaling [18,20–23] to cell killing that are investigated using in vitro systems in which the oxidant is delivered via the culture medium. H2O2 concentration and time of exposure are difficult to control, however, because of the multiple dynamic mechanisms that affect H2O2 availability. As shown here, sustained exposure over long periods to known concentrations of H2O2 can be achieved by enzymatic generation using glucose oxidase. These conditions are arguably more physiologically relevant than those resulting from a single addition of a high H2O2 concentration, especially for modeling chronic oxidative stress, but the enzyme must be titrated carefully since fluxes that produce prominent cytotoxicity also produce accelerated depletion. The outcomes obtained here for ARPE-19 cells likely apply to other cultured cell types as well, although experimental conditions would require adjustment to accommodate cell type differences in membrane permeability to H2O2 [17,24,25] or concentrations of H2O2-degrading antioxidant enzymes. The RPE has notably high activities of GPx and catalase [44,45].
Here we evaluated cytotoxicity at a late time point (24 hr) after onset of H2O2 treatment and used reductions in mitochondrial redox function (MTT assay) as a toxicity measure. In ARPE-19 cells, other time points and other toxicity measures have been used [9–16,35,46–48]. Although H2O2 concentration changes dynamically over time especially after pulse addition, outcomes are typically determined at a fixed post-treatment interval. Comparison of concentrations of H2O2 that produce cytotoxicity at 24 hr in ARPE-19 cultures after pulse delivery versus continuous generation suggest that some cells in the culture population can tolerate short term exposure to high concentrations; it takes a high pulse dose to produce cytotoxicity comparable to a lower chronic dose. Little is known, however, about when cell death begins after initiation of H2O2 exposure, but this is relevant because it is during the window between initial exposure and cell death that antioxidants could function to increase the fraction of surviving cells. Cell death is clearly not immediate, and different antioxidants may be effective at different times following exposure. Identifying such effective agents in the future may require both well controlled H2O2 concentrations, perhaps using methods described here, and dynamic measures of cytotoxicity, such as those we have recently used to evaluate the effects of photic stress [49].
One goal in conducting this study was to determine whether H2O2 could be used to model chronic oxidative stress that is sub-lethal for the RPE. There is growing interest in sub-lethal, stress-induced injury to the RPE [35,44,48,50], which is considered relevant for RPE aging and ultimately for understanding how RPE stress contributes to retinal degenerations like AMD. Sustained enzymatic generation of moderate levels of H2O2, perhaps spiked with transient higher levels of added oxidant, may be a useful model to identify tissue-specific dysfunctions elicited in the RPE by sub-lethal oxidative stress. Sub-lethal stress models may also be required to identify therapeutically-important agents that are competent to protect against cumulative injury, but not against the overt cell death that is typically induced in models of acute stress involving agents such as hydrogen peroxide.
Acknowledgments
Supported by the Poland Ministry of Science and Higher Education (TS), grants R01 EY013722 and P30 EY01931 from the NEI (JMB), an unrestricted grant from Research to Prevent Blindness, Inc., to the Medical College of Wisconsin, and by local foundations and donors supporting macular degeneration research (Milwaukee, WI)
Abbreviations
- AMD
Age-related Macular degeneration
- FBS
Fetal Bovine Serum
- FOX
Ferrous Oxidation Xylenol orange assay
- GOx
Glucose Oxidase
- GPx
Glutathione Peroxidase
- MEM
Minimum Essential Medium
- PBS
Phosphate-Buffered Saline
- PBS-Ca/Mg
Phosphate-Buffered Saline containing Calcium and Magnesium ions
- RPE
Retinal Pigment Epithelium
Footnotes
Publisher's Disclaimer: This is a PDF file of an unedited manuscript that has been accepted for publication. As a service to our customers we are providing this early version of the manuscript. The manuscript will undergo copyediting, typesetting, and review of the resulting proof before it is published in its final citable form. Please note that during the production process errors may be discovered which could affect the content, and all legal disclaimers that apply to the journal pertain.
References
- 1.Cai J, Nelson KC, Wu M, Sternberg P, Jr, Jones DP. Oxidative damage and protection of the RPE. Prog Retinal Eye Res. 2000;19:205–221. doi: 10.1016/s1350-9462(99)00009-9. [DOI] [PubMed] [Google Scholar]
- 2.Beatty S, Koh H-H, Henson D, Boulton M. The role of oxidative stress in the pathogenesis of age-related macular degeneration. Surv Ophthalmol. 2000;45:115–134. doi: 10.1016/s0039-6257(00)00140-5. [DOI] [PubMed] [Google Scholar]
- 3.Zarbin MA. Current concepts in the pathogenesis of age-related macular degeneration. Arch Ophthalmol. 2004;122:598–614. doi: 10.1001/archopht.122.4.598. [DOI] [PubMed] [Google Scholar]
- 4.Algvere PV, Marshall J, Seregard S. Age-related maculopathy and the impact of blue light hazard. Acta Ophthalmol Scand. 2006;84:4–15. doi: 10.1111/j.1600-0420.2005.00627.x. [DOI] [PubMed] [Google Scholar]
- 5.Wu J, Seregard S, Algvere PV. Photochemical damage of the retina. Surv Ophthalmol. 2006;51:461–481. doi: 10.1016/j.survophthal.2006.06.009. [DOI] [PubMed] [Google Scholar]
- 6.Miceli MV, Liles MR, Newsome DA. Evaluation of oxidative processes in human pigment epithelial cells associated with retinal outer segment phagocytosis. Exp Cell Res. 1994;214:242–249. doi: 10.1006/excr.1994.1254. [DOI] [PubMed] [Google Scholar]
- 7.Sarna T, Burke JM, Korytowski W, Różanowska M, Skumatz CMB, Zaręba A, Zaręba M. Loss of melanin from human RPE with aging: possible role of melanin photooxidation. Exp Eye Res. 2003;76:89–98. doi: 10.1016/s0014-4835(02)00247-6. [DOI] [PubMed] [Google Scholar]
- 8.Korytowski W, Pilas B, Sarna T, Kalyanaraman B. Photoinduced generation of hydrogen peroxide and hydroxyl radicals in melanins. Photochem Photobiol. 1987;45:185–190. doi: 10.1111/j.1751-1097.1987.tb05362.x. [DOI] [PubMed] [Google Scholar]
- 9.Zaręba M, Raciti MW, Henry MM, Sarna T, Burke JM. Oxidative stress in ARPE-19 cultures: Do melanosomes confer cytoprotection? Free Radic Biol Med. 2006;40:87–100. doi: 10.1016/j.freeradbiomed.2005.08.015. [DOI] [PubMed] [Google Scholar]
- 10.Ballinger SW, Van Houten B, Jin G-F, Conklin CA, Godley BF. Hydrogen peroxide causes significant mitochondrial DNA damage in human RPE cells. Exp Eye Res. 1999;68:765–772. doi: 10.1006/exer.1998.0661. [DOI] [PubMed] [Google Scholar]
- 11.Geiger RC, Waters CM, Kamp DW, Glucksberg MR. KGF prevents oxygen-mediated damage in ARPE-19 cells. Invest Ophthalmol Vis Sci. 2005;46:3435–3442. doi: 10.1167/iovs.04-1487. [DOI] [PubMed] [Google Scholar]
- 12.Yang P, Peairs JJ, Tano R, Jaffe GJ. Oxidant-mediated Act activation in human RPE cells. Invest Ophthalmol Vis Sci. 2006;47:4598–4606. doi: 10.1167/iovs.06-0140. [DOI] [PubMed] [Google Scholar]
- 13.Kim M-H, Chung J, Yang J, Chung S-M, Kwag N-H, Yoo J-S. Hydrogen peroxide-induced cell death in a human retinal pigment epithelial cell line, ARPE-19. Korean J Ophthalmol. 2003;17:19–28. doi: 10.3341/kjo.2003.17.1.19. [DOI] [PubMed] [Google Scholar]
- 14.Weigel AL, Handa JT, Hjelmeland LM. Microarray analysis of H2O2-, HNE-, or tBH-treated ARPE-19 cells. Free Radic Biol Med. 2002;33:1419–1432. doi: 10.1016/s0891-5849(02)01082-1. [DOI] [PubMed] [Google Scholar]
- 15.Alizadeh M, Wada M, Gelfman CM, Handa JT, Hjelmeland LM. Downregulation of differentiation specific gene expression by oxidative stress in ARPE-19 cells. Invest Ophthalmol Vis Sci. 2001;42:2706–2713. [PubMed] [Google Scholar]
- 16.Tsao Y-P, Ho T-C, Chen S-L, Cheng H-C. Pigment epithelium-derived factor inhibits oxidative stress-induced cell death by activation of extracellular signal-regulated kinases in cultured retinal pigment epithelial cells. Life Sci. 2006;79:545–550. doi: 10.1016/j.lfs.2006.01.041. [DOI] [PubMed] [Google Scholar]
- 17.Bienert GP, Schjoerring JK, Jahn TP. Membrane transport of hydrogen peroxide. Biochim Biophys Acta. 2006;1758:994–1003. doi: 10.1016/j.bbamem.2006.02.015. [DOI] [PubMed] [Google Scholar]
- 18.Halliwell B, Clement MV, Long LH. Hydrogen peroxide in the human body. FEBS Lett. 2000;486:10–13. doi: 10.1016/s0014-5793(00)02197-9. [DOI] [PubMed] [Google Scholar]
- 19.Winterbourn CC. Hydroxyl radical production in body fluids. Roles of metal ions, ascorbate and superoxide. Biochem J. 1981;198:125–131. doi: 10.1042/bj1980125. [DOI] [PMC free article] [PubMed] [Google Scholar]
- 20.Wang X, Martindale JL, Liu Y, Holbrook NJ. The cellular response to oxidative stress: influences of mitogen-activated protein kinase signaling pathways on cell survival. Biochem J. 1998;333:291–300. doi: 10.1042/bj3330291. [DOI] [PMC free article] [PubMed] [Google Scholar]
- 21.Arnold RS, Shi J, Murad E, Whalen AM, Sun CQ, Polavarapu R, Parthasarathy S, Petros JA, Lambeth JD. Hydrogen peroxide mediates the cell growth and transformation caused by the mitogenic oxidase Nox1. Proc Natl Acad Sci USA. 2001;98:5550–5555. doi: 10.1073/pnas.101505898. [DOI] [PMC free article] [PubMed] [Google Scholar]
- 22.Rhee SG, Bae YS, Lee S-R, Kwon J. Hydrogen peroxide: a key messenger that modulates protein phosphorylation through cysteine oxidation. Sci STKE. 2000;2000:1–6. doi: 10.1126/stke.2000.53.pe1. [DOI] [PubMed] [Google Scholar]
- 23.Hensley K, Robinson KA, Gabbita SP, Salsman S, Floyd RA. Reactive oxygen species, cell signaling, and cell injury. Free Radic Biol Med. 2000;28:1456–1462. doi: 10.1016/s0891-5849(00)00252-5. [DOI] [PubMed] [Google Scholar]
- 24.Makino N, Sasaki K, Hashida K, Sakakura Y. A metabolic model describing the H2O2 elimination by mammalian cells including H2O2 permeation through cytoplasmic and peroxisomal membranes: comparison with experimental data. Biochim Biophys Acta. 2004;1673:149–159. doi: 10.1016/j.bbagen.2004.04.011. [DOI] [PubMed] [Google Scholar]
- 25.Makino N, Mise T, Sagara J-i. Kinetics of hydrogen peroxide elimination by astrocytes and C6 glioma cells. Analysis based on a mathematical model. Biochim Biophys Acta. 2008;1780:927–936. doi: 10.1016/j.bbagen.2008.03.010. [DOI] [PubMed] [Google Scholar]
- 26.Nowak D. Hydrogen peroxide release from human polymorphonuclear leukocytes measured with horseradish peroxidase and o-dianisidine. Effect of various stimulators and cytochalasin B. Biomed Biochim Acta. 1990;49:353–362. [PubMed] [Google Scholar]
- 27.Nourooz-Zadeh J, Tajaddini-Sarmadi J, Wolff SP. Measurement of plasma hydroperoxide concentrations by the ferrous oxidation-xylenol orange assay in conjunction with triphenylphosphine. Anal Biochem. 1994;220:403–409. doi: 10.1006/abio.1994.1357. [DOI] [PubMed] [Google Scholar]
- 28.Banerjee D, Kumar PA, Kumar B, Madhusoodanan UK, Nayak S, Jacob J. Determination of absolute hydrogen peroxide concentration by spectrophotometric method. Curr Sci. 2002;83:1193–1194. [Google Scholar]
- 29.Verleur N, Wanders RJA. Permeability properties of peroxisomes in digitonin-permeabilized rat hepatocytes. Evidence for free permeability towards a variety of substrates. Eur J Biochem. 1993;218:75–82. doi: 10.1111/j.1432-1033.1993.tb18353.x. [DOI] [PubMed] [Google Scholar]
- 30.Antunes F, Cadenas E. Estimation of H2O2 gradients across biomembranes. FEBS Lett. 2000;475:121–126. doi: 10.1016/s0014-5793(00)01638-0. [DOI] [PubMed] [Google Scholar]
- 31.Hamsley A, Pegg M, Crane D, Masters C. On the compartmentalization of catalase, fatty acyl-CoA oxidase and urate oxidase in mammalian livers, and the influence of clofibrate treatment on this microlocalization. Mol Cell Biochem. 1988;83:187–194. doi: 10.1007/BF00226146. [DOI] [PubMed] [Google Scholar]
- 32.Long LH, Evans PJ, Halliwell B. Hydrogen peroxide in human urine: implications for antioxidant defense and redox regulation. Biochem Biophys Res Commun. 1999;262:605–609. doi: 10.1006/bbrc.1999.1263. [DOI] [PubMed] [Google Scholar]
- 33.Kim YH, Berry AH, Spencer DS, Stites WE. Comparing the effect on protein stability of methionine oxidation versus mutagenesis: steps toward engineering oxidative resistance in proteins. Protein Eng. 2001;14:343–347. doi: 10.1093/protein/14.5.343. [DOI] [PubMed] [Google Scholar]
- 34.Shechter Y, Burstein Y, Patchornik A. Selective oxidation of methionine residues in proteins. Biochemistry. 1975;14:4497–4503. doi: 10.1021/bi00691a025. [DOI] [PubMed] [Google Scholar]
- 35.Qin S, De Vries GW. α2 but not α1 AMP-activated protein kinase mediates oxidative stress-induced inhibition of retinal pigment epithelium cell phagocytosis of photoreceptor outer segments. J Biol Chem. 2008;283:6744–6751. doi: 10.1074/jbc.M708848200. [DOI] [PubMed] [Google Scholar]
- 36.Meyskens FL, Jr, Chau HV, Tohidian N, Buckmeier J. Luminol-enhanced chemiluminescent response of human melanocytes and melanoma cells to hydrogen peroxide stress. Pigment Cell Res. 1997;10:184–189. doi: 10.1111/j.1600-0749.1997.tb00482.x. [DOI] [PubMed] [Google Scholar]
- 37.Antunes F, Cadenas E, Brunk UT. Apoptosis induced by exposure to a low steady-state concentration of H2O2 is a consequence of lysosomal rupture. Biochem J. 2001;356:549–555. doi: 10.1042/0264-6021:3560549. [DOI] [PMC free article] [PubMed] [Google Scholar]
- 38.Zhang X, Zhou J, Fernandes AF, Sparrow JR, Pereira P, Taylor A, Shang F. The proteasome: a target of oxidative damage in cultured human retina pigment epithelial cells. Invest Ophtalmol Vis Sci. 2008;49:3622–3630. doi: 10.1167/iovs.07-1559. [DOI] [PMC free article] [PubMed] [Google Scholar]
- 39.Kleppe K. The effect of hydrogen peroxide on glucose oxidase fromAspergillus niger. Biochemistry. 1966;5:139–143. doi: 10.1021/bi00865a018. [DOI] [PubMed] [Google Scholar]
- 40.Bao J, Furumoto K, Yoshimoto M, Fukunaga K, Nakao K. Competitive inhibition by hydrogen peroxide produced in glucose oxidation catalyzed by glucose oxidase. Biochem Eng J. 2003;13:69–72. [Google Scholar]
- 41.Zhu D, Tan KS, Zhang X, Sun AY, Sun GY, Lee JC-M. Hydrogen peroxide alters membrane and cytoskeleton properties and increases intercellular connections in astrocytes. J Cell Sci. 2005;118:3695–3703. doi: 10.1242/jcs.02507. [DOI] [PubMed] [Google Scholar]
- 42.Horowitz LD, Wallner JS, Decker DE, Buxser SE. Efficacy of lipid soluble, membrane-protective agents against hydrogen peroxide cytotoxicity in cardiac myocytes. Free Radic Biol Med. 1996;21:743–753. doi: 10.1016/0891-5849(96)00177-3. [DOI] [PubMed] [Google Scholar]
- 43.Block ER. Hydrogen peroxide alters the physical state and function of the plasma membrane of pulmonary artery endothelial cells. J Cell Physiol. 1991;146:362–369. doi: 10.1002/jcp.1041460305. [DOI] [PubMed] [Google Scholar]
- 44.Jarret SG, Boulton ME. Antioxidant up-regulation and increased nuclear DNA protection play key roles in adaptation to oxidative stress in epithelial cells. Free Radic Biol Med. 2005;38:1382–1391. doi: 10.1016/j.freeradbiomed.2005.02.003. [DOI] [PubMed] [Google Scholar]
- 45.Treichel JL, Henry MM, Skumatz CMB, Eells JT, Burke JM. Antioxidants and ocular cell type differences in cytoprotection from formic acid toxicity in vitro. Toxicol Sci. 2004;82:183–192. doi: 10.1093/toxsci/kfh256. [DOI] [PubMed] [Google Scholar]
- 46.Bucolo C, Drago F, Lin L-R, Reddy VN. Neuroactive steroids protect retinal pigment epithelium against oxidative stress. Neuroreport. 2005;16:1203–1207. doi: 10.1097/00001756-200508010-00014. [DOI] [PMC free article] [PubMed] [Google Scholar]
- 47.Lukinova N, Iacovelli J, Dentchev T, Wolkow N, Hunter A, Amado D, Ying G-S, Sparrow JR, Dunaief JL. Iron chelation protects the retinal pigment epithelial cell line ARPE-19 against cell death triggered by diverse stimuli. Invest Ophthalmol Vis Sci. 2009;50:1440–1447. doi: 10.1167/iovs.08-2545. [DOI] [PMC free article] [PubMed] [Google Scholar]
- 48.Zhu D-H, Wu J, Spee C, Ryan SJ, Hinton DR. BMP4 mediates oxidative stress-induced retinal pigment epithelial cell senescence and is overexpressed in age-related macular degeneration. J Biol Chem. 2009;284:9529–9539. doi: 10.1074/jbc.M809393200. [DOI] [PMC free article] [PubMed] [Google Scholar]
- 49.Zaręba M, Sarna T, Szewczyk G, Burke JM. Photobleaching of melanosomes from retinal pigment epithelium: II. Effects on the response of living cells to photic stress. Photochem Photobiol. 2007;83:925–930. doi: 10.1111/j.1751-1097.2007.00080.x. [DOI] [PubMed] [Google Scholar]
- 50.Burke JM, Zaręba M. Sublethal photic stress and the motility of RPE phagosomes and melanosomes. Invest Ophthalmol Vis Sci. 2009;50:1940–1947. doi: 10.1167/iovs.08-2671. [DOI] [PMC free article] [PubMed] [Google Scholar]


