Abstract
An MRI cardiac magnetic susceptometry (MRI-CS) technique for assessing cardiac tissue iron concentration based on phase mapping was developed. Normal control subjects (n=9) and thalassemia patients (n = 13) receiving long-term blood transfusion therapy underwent MRI-CS and MRI measurements of the cardiac relaxation rate R2*. Using MRI-CS, subepicardium and subendocardium iron concentrations were quantified exploiting the hemosiderin/ferritin iron specific magnetic susceptibility. The average of subepicardium and subendocardium iron concentrations and R2* of the septum were found to be strongly correlated (r=0.96, p<0.0001), and linear regression analysis yielded CIC (μg Fe/g wet tissue) = (6.4 ± 0.4) · R2* septum (s-1) - (120 ± 40). The results demonstrated that septal R2* indeed measures cardiac iron level.
Keywords: iron overload, heart, thalassemia, magnetic susceptibility, R2*, MRI
1. Introduction
Iron overload in the heart, mostly in the left ventricle (LV) wall, is the leading cause of death for thalassemia patients receiving chronic transfusions (1, 2). In iron overload, 70-90% of the total body iron burden is concentrated in the liver (3). Therefore, the measurement of the liver iron concentration has become a standard for tracking the severity of iron overload and response to chelation therapy (4). However, even well-chelated thalassemia patients with low liver iron concentrations may unexpectedly develop iron-induced heart failure. In recent years, it has become clear that the previously accepted assumption of a positive correlation between liver iron concentration and cardiac iron concentration (CIC) is not reliable in well-chelated patients (5). Regular iron measurements in the heart helps physicians design and manage chelation treatment programs to either prevent the development of cardiac problems or more effectively treat patients with cardiac failure. However, direct measurement of cardiac iron levels by subendocardial biopsy is not practical, and the size of the specimen is usually too small for reliable quantification. Therefore, there is a need for developing non-invasive techniques for reliable and frequent assessment of cardiac iron overload (6). Methods for quantitative iron assessment, especially MRI-R2*, have been used to assess the cardiac iron level (5). The septal R2* (= 1/T2*) in the short axis view of a mid-papillary heart slice is used for artifact-free cardiac iron measurements (7). This technique has been widely used in cross-sectional studies (8-10) and in trials comparing the efficiency of cardiac iron removal and the successive improvement of cardiac function between different chelators and treatment regimens (11). However, an important difficulty that we face is that there is no actual measure of iron concentration of the tissue for direct validation. It is well known that R2* is sensitive to shimming and susceptibility artifacts. Furthermore, R2* may also depend on details of the iron-hydroxide cluster (hemosiderin) distribution on a microscopic scale; therefore, this poses challenges for accurately diagnosing mild cardiac iron overload. Based on cross-sectional studies of T2* and cardiac function measured as left ventricular ejection fraction (LVEF) in transfused patients with thalassemia, a risk threshold of T2* < 20 ms (R2* > 50 s-1) for developing cardiomyopathy (5) has been suggested for data obtained on 1.5 T MRI scanners. It has been controversial whether the R2* method reliably reflects the tissue iron level near this threshold (12). On the other hand, magnetic susceptibility of the tissue has been known to be proportional to tissue iron under iron overload conditions (13). Biosusceptometry of the liver has been exploited to measure the liver iron concentration by systems using low-TC super conducting quantum interference devices (SQUID) (14, 15). A recent study of iron overload in a gerbil model demonstrated strong correlation between cardiac tissue magnetic susceptibility and iron concentration, confirming that the hemosiderin/ferritin iron specific magnetic volume susceptibility of ξ = 1.6·10-9 SI-units·(gwet tissue / μg Fe) is also valid for heart tissue (16). Consequently, MRI cardio-susceptometry (MRI-CS) was developed as an alternative non-invasive technique for a more direct assessment of cardiac iron (17). This MRI technique exploits the phase of the magnetic resonance signal, which directly reflects the microscopic local magnetic field that the spins in the tissues encounter, allowing quantification of the magnetic susceptibility of tissues. The objective of this work is to demonstrate the feasibility of performing magnetic susceptometry measurements of the heart in vivo with MRI in a group of normal control subjects and chronically transfused patients with thalassemia in comparison to measurements by cardiac MRI-R2*.
2. Materials and Method
This study was conducted jointly at Texas Children's Hospital (TCH) affiliated with Baylor College of Medicine (BCM) in Houston, Texas, and Children's Hospital & Research Center Oakland (CHRCO) in Oakland, California. The study designs adhered to HIPAA regulations. Institutional Review Boards of BCM and CHRCO approved the study. The scanners at the two sites had the same technical performance (Intera 1.5T whole body scanner, Philips Inc., Netherlands). Initially, both sites used Release 11.1 software, later, the scanner at Oakland was upgraded to Achieva 2.1 software. The upgrade did not affect the MRI protocols for this study and did not change the results from phantom measurements.
2.1. Assessment of Cardiac Iron by MRI-CS
Theory of Cardio-Susceptometry
MRI methods based on magnetic susceptibility effects have been applied to the brain (18, 19), liver (20) and extremities (21) although these methods are not applicable to the heart in vivo. Here we employ a novel MRI method based on boundary conditions of Maxwell's equations (22). The technique measures the magnetic susceptibility difference across the boundary of two uniform compartments by analyzing: (a) the phase of the MRI signal near the interface and (b) the orientation of the interface. The key problem is to find a suitable reference tissue with a constant magnetic susceptibility in contact with the heart. In all cases, the blood inside the left ventricle can be used as reference for the subendocardial portion of the left ventricular (LV) wall (subendocardium). For our patients, the intercostal muscle could be used as a reference for the subepicardial portion of the LV wall (subepicardium) (23). With this approach, a 3D phase map from gradient echo imaging is analyzed to extract the susceptibility difference. The phase difference across the interface of the myocardium and the reference tissue is given by (22):
| [1] |
Here Δχ is the difference in magnetic susceptibility between the myocardium and the reference tissue, TE is the echo time, f0 is the transmitter frequency, θn is the angle between the main magnetic field of the MRI scanner B0 and the direction perpendicular to the interface, and Shf is the orientation-independent shift term, which is set to -0.133 based on a previous animal model study (16).
MRI Data Acquisition
The magnetic resonance imaging cardiac susceptometry (MRI-CS) technique was developed on a Philips Intera 1.5T whole body clinical scanner. The cardiac susceptometry data acquisition used a 3D-TFE dual echo technique with ECG triggering and navigator respiratory gating and tracking. Although it is standard practice to position the navigator beam on the right side of the body on the liver-lung interface, the signal from the liver is often too weak to be used for gating for patients with iron overload. Therefore, a navigator beam with a length of 60 mm was positioned over the dome of the left hemi-diaphragm. An acceptance window of 3 to 6 mm for the diaphragm position was pre-determined during a 30-seconds data collection. Only the image data within this window were accepted. In addition, the center frequency of the RF excitation was adjusted in real time to track the location of the imaging volume (real time tracking) to minimize the effect of respiratory induced motion. The data acquisition efficiency was 40 to 50%, and the total data acquisition time was approximately 7 to 10 min. The images were acquired in the transverse orientation during diastole to minimize the effects of cardiac motion and blood flow inside the LV. The parameters for data acquisitions were: TFE factor = 16 for TFE readout, flip angle = 20°, TR/TE1/TE2 = 9.8/4.7/7.1 ms, slice thickness = 1.6 – 2.5mm, FOV = 300 – 350 mm, sampling matrix size 400 × 400, number of slices 15 – 20, NSA = 1, water-fat shift = 0.3 pixel. The MRI signal was received using a synergy cardiac coil (TCH) or a synergy body coil (CHRCO). The signal from one array element was analyzed. In most cases the images with TE of 4.7 ms were adequate for data analysis. The second TE data set (7.1 ms) was helpful for distinguishing muscle and fat in some cases.
Image Data Analysis
From the phase map of the first echo, the magnetic susceptibility of the subepicardium was estimated by using the intercostal muscle as a reference, while the oxy-blood inside the LV was used as a reference for estimating the magnetic susceptibility of the subendocardium. Data analysis was performed using internally developed software written in IDL 5.6 (Research Systems Inc., Boulder, CO).
For subepicardial susceptibility, an area of contact between the apex and chest wall was first identified. This area of contact was selected such that: it is isolated from costal bones with an area of 1 cm2 or greater, and the direction of the magnetic field of the MRI scanner is nearly within the interfacial plane. Then the data analysis proceeded in several steps (see Figure 1). First, the 3D image was rotated around the z-axis. followed by manual tracing of the regions of the cardiac tissue and reference, as well as the area of interface. Thereafter, polynomial least squares fits were performed for the interface surface, the phase distribution of the tissue and the reference volume. Finally, phase values and Δφ with the resulting magnetic subepicardial susceptibility Δχ (equation [1]) were calculated for each surface point and the mean and the standard error of Δχ could be obtained. The subendocardial susceptibility was quantified in a similar fashion using the signal of blood inside LV as the reference.
Figure 1.
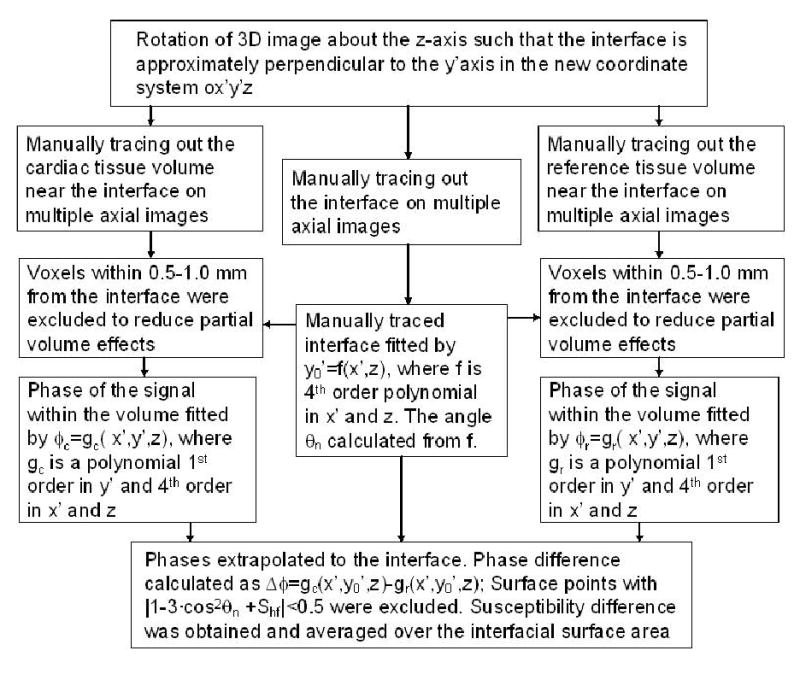
Block diagram outlining the procedure for the quantification of magnetic susceptibility difference between the cardiac tissue and the reference.
Conversion of the Magnetic Susceptibility to Cardiac Iron Concentration
In control subjects, we assumed a negligible gradient of iron distribution within the cardiac tissue. We also assumed an average iron concentration in the control heart of CICo = 47 μg Fe/g wet tissue (24). In a previous gerbil cardiac iron overload model (16) a specific magnetic volume susceptibility for cardiac iron of ξ = 1.6·10-9 SI-units·(gwet tissue / μg Fe) was reported, which agreed with the value found for iron overloaded liver tissue(13). Based on these data, the subendocardial iron concentration CICendo was given by:
| [2] |
The value of Δχcontrol_endo was the mean value of Δχendo measured from control subjects in this study. In a similarly fashion, the subepicardial iron concentration CICepi was given by:
| [3] |
Here, the value of Δχcontrol_epi was the mean Δχepi value measured from control subjects in this study. The quantity CICavg = (CICendo + CICepi)/2 was calculated as an average cardiac tissue iron concentration.
2.2 Assessment of Cardiac Iron by MRI-R2*
The measurement of R2* in a mid-papillary short axis slice of the interventricular septum is the current method of choice for cardiac iron assessment. However, MRI-CS can only be performed in close contact with a reference tissue of known magnetic susceptibility and preferably for interface orientations with θn near 0° or 90°. Presently for subepicardium, this can only be realized at the apical cardiac wall. Thus, for comparison, septal and apical cardiac R2* measurements were performed in a single short axis slice through septum and in a single transverse slice through apex, respectively. Multiple gradient echo images (TE = 2.0, 2.5, 3.0, 4.0, 6.0, 9.0, 12.0, 15.0, 18.0 ms) were acquired one for each breath-hold using an ECG triggered 2D turbo field echo technique. Other parameters were: FOV = 380×285 mm2, slice thickness 10 mm, sampling matrix = 256× 96, sampling bandwidth = 254 Hz/pixel, TR = 21 ms, flip angle= 20°, TFE factor = 5. The reconstructed image matrix size was 512×384.
R2* was quantified from manually drawn ROI at the left ventricular (LV) wall. Because data sets were acquired with multiple breath holds, the ROI had to be separately delineated on images with different TEs avoiding partial volume effects from the ROI boundary. The mean value of R2* and its standard error were determined. All data analyses were conducted using internally developed software written in IDL.
2.3 Control Subjects and Patients
Nine normal control subjects (5 female, 4 male, age range 21 to 36 years) were studied. From the control subjects, R2* at the septum and at the apex near the chest wall, and data for MRI cardio-susceptometry were acquired.
Thirteen β-thalassemia major patients (6 female, 7 male, age range 6 to 40 years) were studied. All patients were receiving regular blood transfusion therapy and chelation treatment with deferoxamine alone or in combination with deferiprone. The serum ferritin levels ranged from 792 to 6363 μg/l, with a mean value of 2880 μg/l. R2* was derived from measurements of septal short axis images (in all 13 patients) and apical images near the chest wall (in 10 of the 13 patients). MRI-CS was completed in all 13 patients.
2.4 Statistical methods
Parametrical statistical methods were applied (arithmetic mean, standard deviation, Pearson's correlation coefficient). For prediction, linear regression analysis was performed with non-zero intercept to calculate standard prediction error and coefficient of determination.
3. Results
3.1 Validation of MRI-CS by phantoms
Phantom studies were conducted to ensure that susceptibility measurements from Houston and Oakland MRI sites were consistent. A set of CuSO4 solutions in 60 ml clear cylindrical polystyrene jars (Fisher Scientific, USA) with concentrations from 100 to 400 mM were measured with this technique at both TCH and CHRCO. The jars had a diameter of 5 cm and a flat bottom with a thickness of 1.5 mm. The containers were submerged in distilled water, and the axis of the bottle was perpendicular to the magnetic field Bo. The phase difference across the flat container bottom was measured for quantification of the magnetic susceptibility (in Eq. [1], Shf = 0.074 according to Wang et. al. (22)). The linear regression resulted in a magnetic mass susceptibility of 18.0 · 10-6/mol for CuSO4 in aqueous solution, agreeing well with the value of 17.5 · 10-6/mol established previously (22). Excellent agreement between the two scanners was demonstrated (Figure 2).
Figure 2.
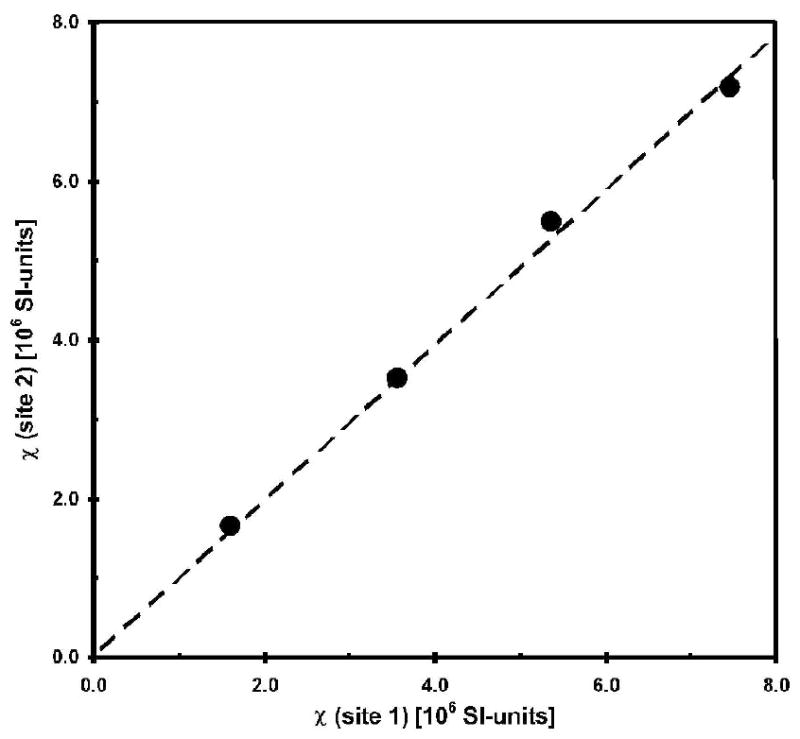
Results of the phantom validation studies at the two participating sites. Error bars are smaller than the symbol. The magnetic susceptibility χ of CuSO4 solution with concentrations of 100, 200, 300 and 400 mM was measured relative to distilled water with a regression coefficient of 0.98 (p < 0.0017) and a coefficient of determination R2 = 0.9967.
3.2 Quantification of cardiac iron concentration in patients and controls
The magnetic susceptibility was measured for subepicardium and subendocardium from all patients and control subjects. Figure 3A and Figure 3B shows the amplitude and phase images acquired with the 3D turbo gradient echo imaging from one patient. It can be seen that the LV wall has a decreased signal amplitude compared with the intercostal muscle, owing to an increase in R2*. On the other hand, the signal phase of the LV wall is increased relative to the intercostal muscle, due to an increase of the magnetic susceptibility in the cardiac tissue. The phase profile along an oblique line segment (y′ direction) in Figure 3A and 3B is shown in Figure 3C from the left ventricular oxygenated blood to the intercostal muscle. The phase difference between the LV wall and blood depends on Δχendo. The phase difference between LV wall and chest muscle depends on Δχepi. There was no need to perform any phase unwrapping procedure in the data analysis owing to the short TE in the data acquisition.
Figure 3.
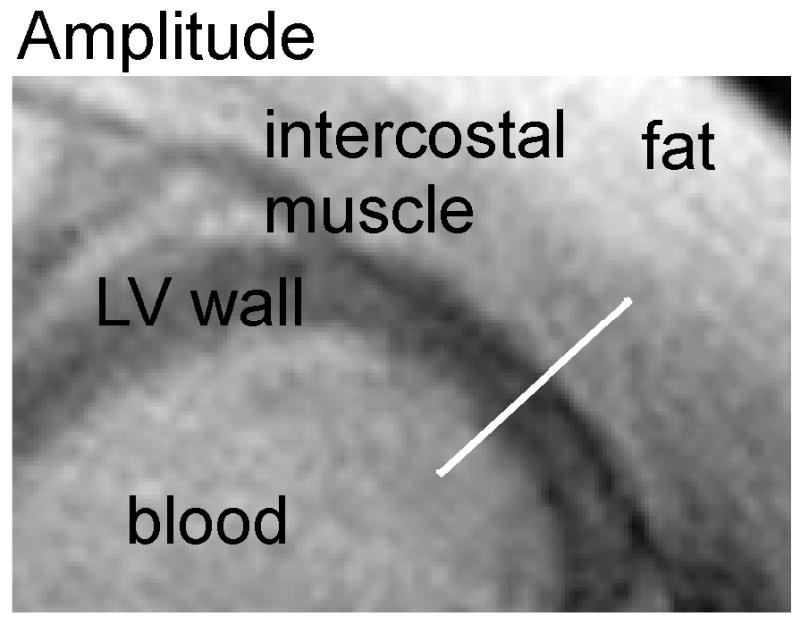
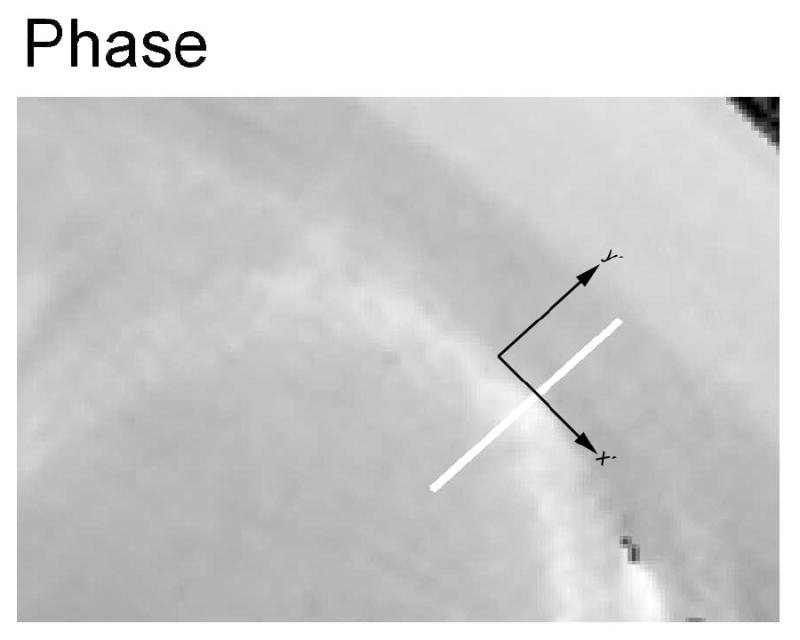
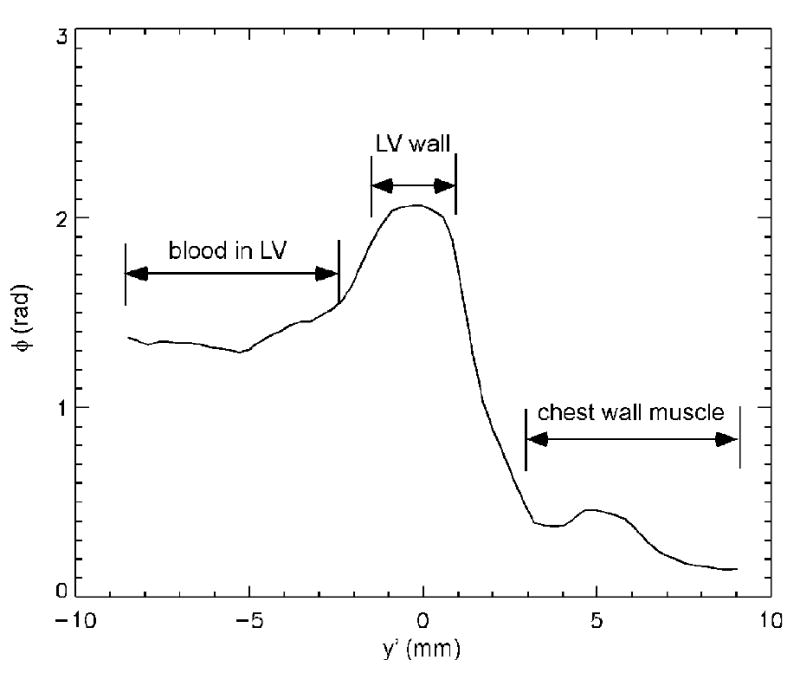
Transverse amplitude image (A), phase image (B) and phase profile (C) in a patient with iron overload. (A): the LV cardiac wall has decreased signal intensity compared with the intercostal muscle on the amplitude image, owing to an increase in R2*. (B): the signal phase of the LV cardiac wall is increased relative to the intercostal muscle, due to an increase of the magnetic susceptibility in the cardiac tissue. The x′ and y′ axes are the same as that referred to in Figure 1. (C): the phase profile along the white bar in y′ direction of the amplitude/phase image with the magnetic field Bo perpendicular to the image plane.
For patients, the subendocardial magnetic susceptibility Δχendo ranged from −0.25·10-6 to 1.28 ·10-6 SI-units, with a standard error ranging from 0.03·10-6 to 0.22 ·10-6 for individual patients. Subepicardial magnetic susceptibility Δχepi ranged from −0.13·10-6 to 2.41·10-6 SI-units, with a standard error of the mean ranging from 0.03·10-6 to 0.21·10-6. Higher susceptibility values were associated with larger error bars.
For control subjects, the subendocardial magnetic susceptibility Δχendo ranged from −0.27·10-6 to 0.04 ·10-6 SI-units and the subepicardial magnetic susceptibility Δχepi ranged from -0.05·10-6 to 0.34·10-6 SI-units. Thus, mean volume susceptibilities (± SD) of Δχendo = (-0.06 ± 0.10)·10-6 and Δχepi = (0.13 ± 0.12)·10-6 SI-units were obtained.
With these data, the iron concentrations in the subepicardial and subendocardial region of the LV wall could be calculated according to Eqs. [2,3] in patients.
3.3 Correlation of cardiac iron concentration by MRI-CS with cardiac R2*
From control subjects, expected R2* values were obtained for the septum (29.2 ± 4.3 s-1) and for the apex of the anterior cardiac wall (32.2 ± 6.9 s-1). The R2* values from the two regions were moderately correlated (r = 0.72, p <0.02). For patients, R2* values of the septum ranged from 21.2 to 194.6 s-1 with a mean value of 92.2 s-1. R2* values of the apex ranged from 15.1 to 227.3 s-1 with a mean value of 118.9 s-1. R2* values in these two regions were strongly correlated in patients (r = 0.94, p < 0.001). Combining control subjects and patients, the regression analysis in Figure 4 yielded R2*apex = (1.17 ± 0.08) · R2*septum + (0.6 ± 6.9) s-1 with a coefficient of determination r2 = 0.93 (p < 0.001).
Figure 4.
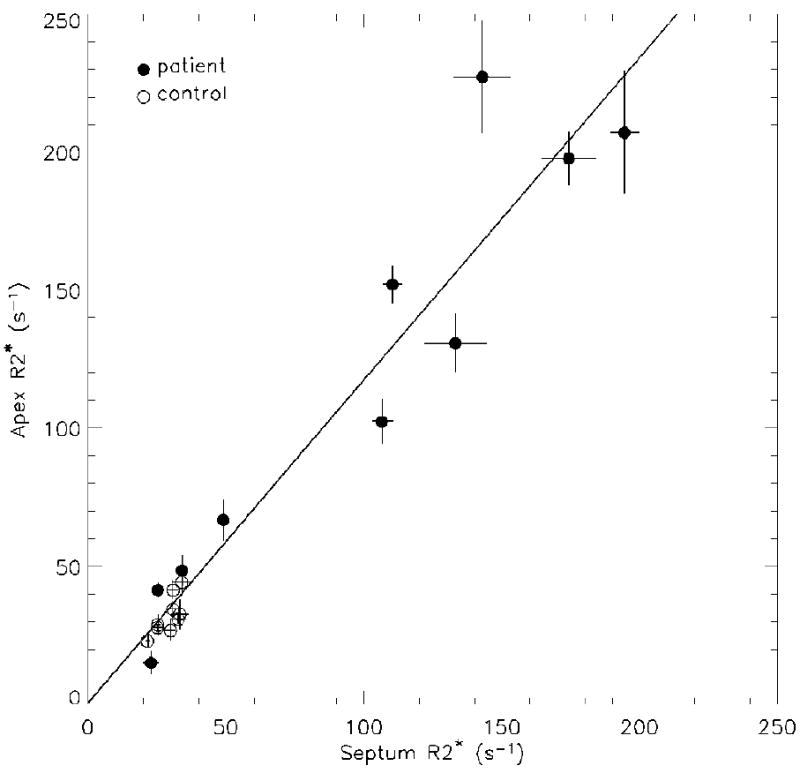
Correlation between septal and apical R2* of left ventricular cardiac wall. The solid line is the result of linear regression when all patients and control subjects are combined (r = 0.96, p < 0.001).
The correlation between apical R2*apex and CICavg is shown in Figure 5A. For control subjects and patients, correlation coefficients of r = - 0.80 (p < 0.01) and r = 0.91 (p=0.001) were found, respectively. The negative slope in the linear relationship for controls was unexpected (dashed line in Figure 5A). Predicting cardiac iron from R2*apex by combining controls and patients resulted in a linear regression of CICavg (μg Fe/gwet tissue) = (5.2 ± 0.5) · R2* apex (s-1) - (100 ± 50) (solid line in Figure 5A) with a coefficient of determination r2 = 0.87 and a standard error of 140 μg Fe/g wet tissue.
Figure 5.
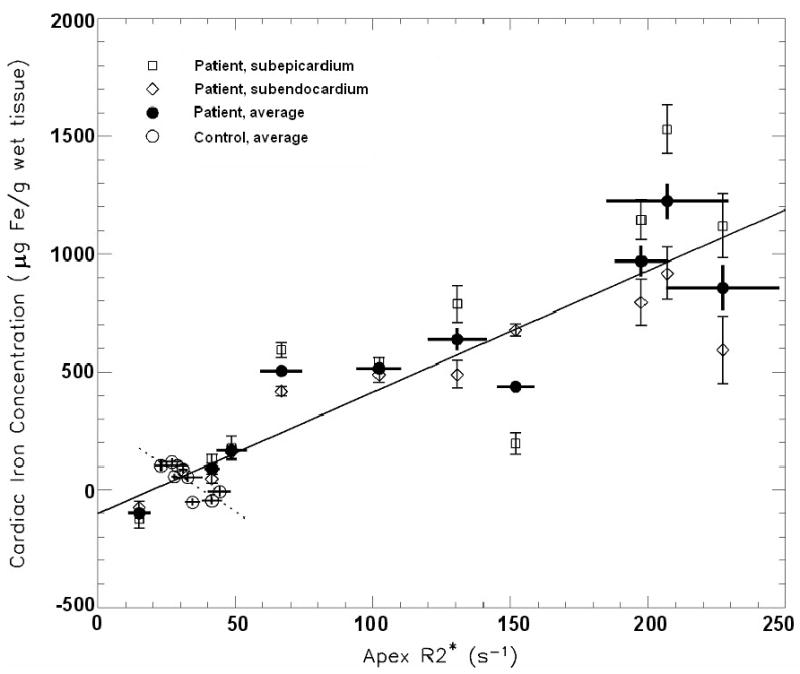
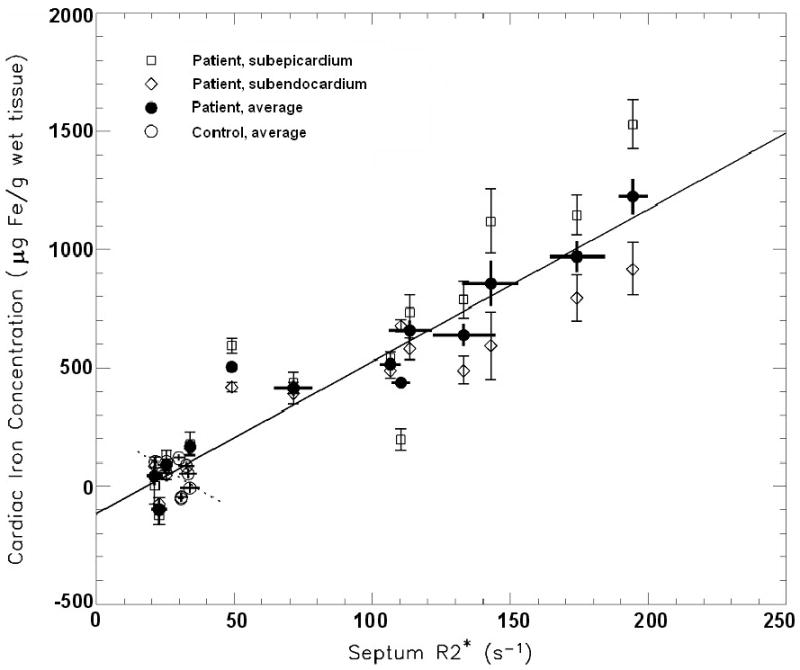
Correlation between R2* and the averaged subendocardial and subepicardial iron concentration (CICavg) from the anterior apical left ventricular cardiac wall. (A) Correlation between apical R2*apex and CICavg for patients and controls (solid line: r = 0.93, p < 0.001) and, separately, for control subjects (dotted line: r = -0.80, p < 0.01). (B) Septal R2*septum correlated with CICavg in patients and controls (solid line: r = 0.96, p < 0.001), but not significantly for control subjects only (dotted line: r = -0.45, p = 0.22)
The correlation between septal R2*septum and CICavg is shown in Figure 5B. For control subjects only, no significant correlation was found (dashed line in Figure 5B: r = -0.45, p = 0.22), again, with a negative slope of the linear relationship. For patients, the correlation was highly significant with a coefficient of r = 0.95 (p < 0.001). For prediction of CICavg from R2*septum by combining controls and patients, the linear regression resulted in CICavg (μg Fe/g wet tissue) = (6.4 ± 0.4) · R2* septum (s-1) - (120 ± 40) (solid line in Figure 5B) with r2 = 0.92 and a standard error of 110 μg Fe/g wet tissue.
4. Discussion
The presence of ferritin and/or hemosiderin tissue iron changes the magnetic susceptibility of the tissue. In addition, iron is inhomogeneously distributed as iron hydroxide clusters, causing microscopic variations of local magnetic fields within a MR image voxel. The change in average magnetic susceptibility is macroscopic, causing changes in the phase of the MR signal in gradient echo images. Our susceptometry technique exploits these phase changes to quantify the tissue susceptibility. On the other hand, the microscopic spatial variation of the magnetic susceptibility within image voxels causes proton spins to dephase and contributes to changes in R2*. Therefore, MRI susceptometry measures the macroscopic change of magnetic susceptibility, and MRI-R2* mainly reflects the microscopic spatial variation of magnetic susceptibility. The two measurements are correlated, and both approaches can be used for tissue iron quantification. However, R2* is also sensitive to susceptibility artifacts related to macroscopic B0 field gradient. These artifacts may arise due to the air space in the lung, and may be more significant with normal or mildly elevated iron. Consequently, MRI-R2* may not be reliable for detecting or quantifying mild iron overload. In contrast, the MRI susceptometry method presented here aims to quantify the field difference across the interface between the cardiac muscle and a reference tissue, and is not sensitive to the field disturbances from sources away from the interface.
For the quantification of the magnetic susceptibility of the cardiac tissue, it is critical that the susceptibility of the reference tissue remains constant and independent of the disease condition. It has been shown that iron does not accumulate in intercostal muscle in thalassemia patients with iron overload (23), and therefore, can be used as reference for measuring the magnetic susceptibility of subepicardium. Furthermore, the susceptibility of the oxygenated blood in the LV also stays in a narrow range. It is possible that some patients may have decreased hematocrit (Hct) levels. Based on Weisskoff et al.(25), and assuming hemoglobin to be responsible for the deviation of the susceptibility of blood from water, we can calculate a susceptibility change of 0.075·10-6 (SI-unit) if Hct changes from 50% to 30%. Based on Eq. [2], this will introduce an error of 47 μg Fe/g wet tissue in the measured CICendo value, and an error of 24 μg Fe/g wet tissue in the CICavg value. The size of this error is acceptable for practical purposes, but could also be corrected using Hct values in patients.
In general, MRI measurements are sensitive to flow. Especially in the phase measurements used in the present study, motions of the heart and blood flow in the ventricle are of concern. Data acquisition was carried out in end-diastole and flow compensation was employed in the TFE pulse sequence, thus minimizing phase errors due to the flow in all three spatial directions, as has been demonstrated in a previous study (20) using similar sequence parameters. Furthermore, phase maps from control subjects confirmed that there were no phase artifacts in both the myocardium and the blood in the left ventricle. Nonetheless, our calibration procedure (Equations [2] and [3]) using data from the control subjects would have largely removed the effects from potential small phase errors in the patient studies.
Based on the good agreement between R2* at the septum and apex (Figure 4), we studied the correlation between apical cardiac iron measured by MRI-CS and by MRI-R2* at both apex and septum. A highly significant relationship between R2* from both cardiac tissue areas and the MRI-CS measurements was observed. The relationship between CIC and R2* was found to be very similar to that of Ghugre et al. (26) from an autopsy study of one newly deceased patient. Although, that study was restricted to a range of 180 < R2* < 290 s-1, their regression coefficient of 5.6 s · μg Fe/g wet tissue was in close agreement with ours (6.4 and 5.2 s · μg Fe/g wet tissue for septum and apex, respectively). The only other human autopsy study (27) measured T2* and iron concentration in heart samples of two transfused patients with sideroblastic anemia and thalassemia major. From the mean T2* value of 5.2 and 45 ms for these two hearts, we can predict CIC to be 900 and 16 μg Fe/gwet tissue based on our calibration for the apex region, which agree well with chemically measured mean iron concentration of 952 and 47 μg Fe/gwet tissue for these two cases. In addition, the initial skepticism of one of the authors (RF) about directly linking MRI-R2* measurements to cardiac iron no longer has any justification because of these results (12).
In control subjects, we unexpectedly observed that R2* at the apex is negatively correlated with CICavg calculated from the susceptibility measurement (Figure 5A). We hypothesize that the negative correlation may be related to the magnetic susceptibility Δχendo of the cardiac muscle being negative relative to the left ventricle blood reference of control subjects. A non-zero Δχendo will contribute to R2* through a macroscopic magnetic field gradient. R2* depends only on the absolute value of the field gradient independent of its direction. Thus, both Δχendo > 0 and Δχendo < 0 would cause the R2* to increase relative to the situation where Δχendo = 0. Because control subjects have on average negative Δχendo values, a decrease in Δχendo might cause the absolute value |Δχendo| and R2* to increase.
Phase maps revealed a non-uniform distribution of the magnetic susceptibility in the iron-loaded myocardium. This is consistent with a large range of R2* in a single autopsy heart. (26) In 8 of 9 patients with septum R2* greater or equal to 50 s-1, the subepicardial iron level was higher than that in the subendocardium. This is consistent with previous autopsy heart studies (26, 28-30). In the oldest patient (40 y), the reverse was found. However, we do not know if these observations will have any clinical implications. We also noticed that the thickness of the LV wall is exaggerated on the gradient echo amplitude images under iron overload conditions relative to that revealed on the phase image. This can be seen on Figure 3A and 3B by comparing the amplitude and phase images. We hypothesize that the large signal phase gradient at the interface between the LV wall and the surroundings caused drastic signal amplitude decrease at the interface areas, making the LV wall to appear thicker, while the phase map may underestimate the cardiac wall thickness due to partial volume effects. We expect that this phenomenon would affect R2* quantification. Our measurement was performed in multiple breathhold mode for different TE's with known image registration problems. Consequently, we were not able to study this question in detail based on our data. However, slightly larger R2* values were obtained if the ROIs were well-confined in the center of the ventricular wall in contrast to delineating the ROIs by the visualized LV wall boundary on the images (Appendix A).
Currently, the MRI-CS method is affected by four limitations. First, this method relies on close contact between the left-ventricular cardiac wall and the intercostal muscle. This requirement is fulfilled in most young patients, similar to the age group of this study. However, in older subjects, a thicker lipid layer (> 2 mm) may compromise the accuracy of the technique. Second, we are currently measuring the magnetic susceptibility of the apex instead of also measuring the septum region. The phase at the septum region is measured less reliably with our technique due to residual motion artifacts despite the use of navigator echoes and the weaker signal at the septum due to the use of surface array coil. The phase contrast between the blood in the LV and septum decreases due to a combination of these two factors. To appreciate this point, notice that although the SNR of the phase map is still robust at the septum, the relative contribution to the signal from motion related ghosting is larger at the septum than at the apical region near the chest wall. Third, the use of respiratory gating with the navigator echo may confine this method to specialized centers equipped with this capability. Using a breathhold technique instead would also avoid the risk of movement artifacts. Further technical developments will be needed to address these issues. Finally, the parameters used in the susceptibility quantification were derived from a gerbil model study, not from the human heart. In the gerbil study, a specific magnetic hemosiderin/ferritin iron susceptibility of ξ = 1.6·10-9 SI-units·(gwet tissue / μg Fe) was found within a standard error of 10 % (ref. 16) in agreement with former liver susceptometry studies. Any deviation from this value for human heart tissue would be proportionally reflected in the CIC quantification (Eqs. [2] and [3]). In addition, we assumed Shf = -0.133 in Eq. [1] based on the gerbil study. Presently we do not have data for Shf of the human heart. This quantity is linked to the properties of ferritin, which is a highly conserved protein through evolution. In our measurement condition, cosθn is close to zero in Eq. [1] and the measured susceptibility difference scales with (1+Shf). In general, we expect |Shf| to be much smaller than 1, and the errors associated with Shf will not be large. For example, if the true value is different by 0.05 (Shf = -0.183 or -0.083), the resulting susceptibility difference will be off by 6%.
More patient studies will be needed, especially for patients with R2* between 50 and 100 s-1 (T2* from 10 to 20 ms), where deviations of 50 % were found between R2* and MRI-CS. In this range, the R2* method has not been firmly established due to difficulties related to susceptibility artifacts and calibration shortcomings. Additionally, analyzing signal decay curves with superimposed background signal offset is problematic in this range. It is critical to determine if the MRI-R2* method is providing accurate iron measurements in this intermediate region of iron overload in the heart in order to more effectively manage patient treatment, especially, in studies monitoring chelation effects in the heart (31). In particular, it will be helpful to accurately measure abnormal cardiac iron accumulation in order to effectively adjust chelation treatment at an early stage of cardiac iron loading.
In summary, we have demonstrated that the magnetic susceptibility of the cardiac tissue can be quantified in vivo with magnetic resonance imaging for a non-invasive, direct quantification of the absolute iron concentration in the heart. In vivo comparison of cardiac R2* relaxation rates with iron concentrations calculated from magnetic susceptibilities may also replace the more difficult and ethically problematic approach of calibrating R2* in iron overloaded autopsy hearts. MRI cardio-susceptometry not only provides an alternative and independent approach to R2* measurements, but also confirms results achieved with MRI-R2* even for non-standard tissue regions.
Acknowledgments
This work is supported by a Cooley's Anemia Foundation translational research grant and NIH grant M01-RR01271.
Appendix A
We compared R2* values with different ROI placements at the septum in patients in order to test to what degree the results may be different due to different signal decay rate at the center versus the edge of the LV wall. First, a large ROI was drawn on each gradient echo image with the boundary along the edge of the septum as visualized on the MR image. Second, a small ROI was obtained by eroding the large ROI with a 5 by 5 pixel kernel. Typically, the small ROI covered half of the width of the LV wall as visualized on the MR images. The average signal intensity within each ROI was calculated and used for determine the R2* value. Using linear regression analysis, we found that the R2* obtained with the large ROIs was well correlated with that from the small ROIs by R2*Small = 2.8 + 1.07 · R2*Large (r = 0.99, p<0.001).
The R2* values reported in section 3.3 were obtained from ROIs between the two extreme cases considered in this appendix.
Footnotes
Conflicts of Interest: None for all authors
Publisher's Disclaimer: This is a PDF file of an unedited manuscript that has been accepted for publication. As a service to our customers we are providing this early version of the manuscript. The manuscript will undergo copyediting, typesetting, and review of the resulting proof before it is published in its final citable form. Please note that during the production process errors may be discovered which could affect the content, and all legal disclaimers that apply to the journal pertain.
References
- 1.Cohen AR, Galanello R, Pennell DJ, Cunningham MJ, Vichinsky E. Thalassemia, in Hematology, the American Society of Hematology Education Program Book. 2004. pp. 14–34. [DOI] [PubMed] [Google Scholar]
- 2.Borgna-Pignatti C, Rugolotto S, De Stefano P, Zhao H, Cappellini MD, Del Vecchio GC, Romeo MA, Forni GL, Gamberini MR, Ghilardi R, Piga A, Cnaan A. Survival and complications in patients with thalassemia major treated with transfusion and deferoxamine. Haematologica. 2004;89:1187–93. [PubMed] [Google Scholar]
- 3.Fischer R, Tiemann C, Engelhardt R, Nielsen P, Durken M, Gabbe E, Janka G. Assessment of iron stores in children with transfusion siderosis by biomagnetic liver susceptometry. Am J Hematol. 1999;60:289–299. doi: 10.1002/(sici)1096-8652(199904)60:4<289::aid-ajh7>3.0.co;2-w. [DOI] [PubMed] [Google Scholar]
- 4.Olivieri NF, Brittenham GM. Iron-chelating therapy and the treatment of thalassemia. Blood. 1997;89:739–761. [PubMed] [Google Scholar]
- 5.Anderson LJ, Holden S, Davis B, Prescott E, Charrier CC, Bunce NH, Firmin DN, Wonke B, Porter J, Walker JM, Pennell DJ. Cardiovascular T2-star (T2*) magnetic resonance for the early diagnosis of myocardial iron overload. Eur Heart J. 2001;22:2171–2179. doi: 10.1053/euhj.2001.2822. [DOI] [PubMed] [Google Scholar]
- 6.Brittenham GM, Badman DG. Noninvasive measurement of iron: report of an NIDDK workshop. Blood. 2003;101:15–19. doi: 10.1182/blood-2002-06-1723. [DOI] [PubMed] [Google Scholar]
- 7.Ghugre NR, Enriquez CM, Coates TD, Nelson MDJ, Wood JC. Improved R2* measurements in myocardial iron overload. J Magn Reson Imaging. 2006;23:9–16. doi: 10.1002/jmri.20467. [DOI] [PMC free article] [PubMed] [Google Scholar]
- 8.Wood JC, Tyszka JM, Carson S, Nelson MD, Coates TD. Myocardial iron loading in transfusion-dependent thalassemia and sickle cell disease. Blood. 2004;103:1934–1936. doi: 10.1182/blood-2003-06-1919. [DOI] [PubMed] [Google Scholar]
- 9.Maris TG, Papakonstantinou O, Chatzimanoli V, Papadakis A, Pagonidis K, Papanikolaou N, Karantanas P, Gourtsoyiannis N. Myocardial and liver iron status using a fast T*2 quantitative MRI (T*2qMRI) technique. Magn Reson Med. 2007;57:742–753. doi: 10.1002/mrm.21204. [DOI] [PubMed] [Google Scholar]
- 10.Di Tucci AA, Matta G, Deplano S, Gabbas A, Depau C, Derudas D, Caocci G, Agus A, Angelucci E. Myocardial iron overload assessment by T2* magnetic resonance imaging in adult transfusion dependent patients with acquired anemias. Haematologica. 2008;93:1385–1388. doi: 10.3324/haematol.12759. [DOI] [PubMed] [Google Scholar]
- 11.Tanner MA, Galanello R, Dessi C, Smith GC, Westwood MA, Agus A, Roughton M, Assomull R, Nair SV, Walker JM, Pennell DJ. A randomized, placebo-controlled, bouble-blind trial of the effect of combined therapy with deferoxamine and deferiprone on myocardial iron in thalassemia major using cardiovascular magnetic resonance. Circulation. 2007;115:1876–1884. doi: 10.1161/CIRCULATIONAHA.106.648790. [DOI] [PubMed] [Google Scholar]
- 12.Fischer R, Engelhardt R. Deferiprone versus desferrioxamine in thalassemia, and T2* validation and utility. Lancet. 2003;361:182–183. doi: 10.1016/S0140-6736(03)12222-2. [DOI] [PubMed] [Google Scholar]
- 13.Bauman JH, Harris JW. Estimation of hepatic iron stores by in vivo measurement of magnetic susceptibility. J Lab Clin Med. 1967;70:246–257. [PubMed] [Google Scholar]
- 14.Brittenham GM, Farrell DE, Harris JW, Feldman ES, Danish EH, Muir WA, Tripp JH, Bellon EM. Magnetic-susceptibility measurement of human iron stores. N Engl J Med. 1982;307:1671–1675. doi: 10.1056/NEJM198212303072703. [DOI] [PubMed] [Google Scholar]
- 15.Fischer R, Piga A, Harmatz P, Nielsen P. Monitoring long-term efficacy of iron chelation treatment with biomagnetic liver susceptometry. Ann NY Acad Sci. 2005;1054:350–357. doi: 10.1196/annals.1345.043. [DOI] [PubMed] [Google Scholar]
- 16.Wang ZJ, Lian L, Chen Q, Zhao H, Asakura T, Cohen AR. 1/T2 and magnetic susceptibility measurements in a gerbil cardiac iron overload model. Radiology. 2005;234:749–755. doi: 10.1148/radiol.2343031084. [DOI] [PubMed] [Google Scholar]
- 17.Bluemke DA, Liddell RP. Science to Practice: Can MR Imaging Provide a Noninvasive “Biopsy” of the Heart to Measure Iron Levels? Radiology. 2005;234:647–648. doi: 10.1148/radiol.2343041670. [DOI] [PubMed] [Google Scholar]
- 18.Ogg R, Langston J, Haacke E, Steen R, Taylor J. The correlation between phase shifts in gradient-echo MR images and regional brain iron concentration. Magn Reson Imaging. 1999;17:1141–1148. doi: 10.1016/s0730-725x(99)00017-x. [DOI] [PubMed] [Google Scholar]
- 19.Haacke EM, Cheng NY, House MJ, Liu Q, Neelavalli J, Ogg RJ, Khan A, Ayaz M, Kirsch W, Obenaus A. Imaging iron stores in the brain using magnetic resonance imaging. Magn Reson Imaging. 2005;23:1–25. doi: 10.1016/j.mri.2004.10.001. [DOI] [PubMed] [Google Scholar]
- 20.Chu Z, Cohen AR, Muthupillai R, Chung T, Wang ZJ. MRI measurement of hepatic magnetic susceptibility-phantom validation and normal subject studies. Magn Reson Med. 2004;52:1318–1327. doi: 10.1002/mrm.20305. [DOI] [PubMed] [Google Scholar]
- 21.de Rochefort L, Brown R, Prince MR, Wang Y. Quantitative MR susceptibility mapping using piece-wise constant regularized inversion of the magnetic field. Magn Reson Med. 2008;60:1003–1009. doi: 10.1002/mrm.21710. [DOI] [PubMed] [Google Scholar]
- 22.Wang ZJ, Li S, Haselgrove JC. Magnetic resonance imaging measurement of volume magnetic susceptibility using a boundary condition. J Magn Reson. 1999;140:477–481. doi: 10.1006/jmre.1999.1873. [DOI] [PubMed] [Google Scholar]
- 23.Dixon RM, Styles P, Al-Refaie FN, Kemp GJ, Donohue SM, Wonke B, Hoffbrand AV, Radda GK, Rajagopalan B. Assessment of hepatic iron overload in thalassemic patients by magnetic resonance spectroscopy. Hepatology. 1994;19:904–910. [PubMed] [Google Scholar]
- 24.Bush VJ, Moyer TP, Batts KP, Parisi JE. Essential and toxic element concentrations in fresh and formalin-fixed human autopsy tissues. Clin Chem. 1995;41:284–294. [PubMed] [Google Scholar]
- 25.Weisskoff RM, Kiihne S. MRI susceptometry: image-based measurement of absolute susceptibility of MR contrast agents and human blood. Magnetic Resonance in Medicine. 1992;24:375–383. doi: 10.1002/mrm.1910240219. [DOI] [PubMed] [Google Scholar]
- 26.Ghugre NR, Enriquez CM, Gonzalez I, Nelson MDJ, Coates TD, Wood JC. MRI detects myocardial iron in the human heart. Magn Reson Med. 2006;56:681–686. doi: 10.1002/mrm.20981. [DOI] [PMC free article] [PubMed] [Google Scholar]
- 27.Pennell DJ, Anderson LJ, Paul K, Forni GL, Ellis G, Walker JM, Porter JB. Calibration of myocardial T2* values in post-mortem hearts. Blood. 2005;106 abstract 3837. [Google Scholar]
- 28.Buja LM, Roberts WC. Iron in the heart. Etiology and clinical significance. Am J Med. 1971;51:209–221. doi: 10.1016/0002-9343(71)90240-3. [DOI] [PubMed] [Google Scholar]
- 29.Sanyal SK, Johnson W, Jayalakshmamma B, Green AA. Fatal “iron heart” in an adolescent: biochemical and ultrastructural aspects of the heart. Pediatrics. 1975;55:336–341. [PubMed] [Google Scholar]
- 30.Olson LJ, Edwards WD, McCall JT, Ilstrup DM, Gersh BJ. Cardiac iron deposition in idiopathic hemochromatosis: histologic and analytic assessment of 14 hearts from autopsy. J Am Coll Cardiol. 1987;10:1239–1243. doi: 10.1016/s0735-1097(87)80124-9. [DOI] [PubMed] [Google Scholar]
- 31.Pennell DJ, Berdoukas V, Karagiorga M, Ladis V, Piga A, Aessopos A, Gotsis ED, Tanner MA, Smith GC, Westwood MA, Wonke B, Galanello R. Randomized controlled trial of deferiprone or deferoxamine in beta-thalassemia major patients with asymptomatic myocardial siderosis. Blood. 2006;107:3738–3744. doi: 10.1182/blood-2005-07-2948. [DOI] [PubMed] [Google Scholar]


