Abstract
This report presents a mathematical tissue-equivalent breast phantom for linear slot-scanning digital mammography. A recently developed prototype linear slot-scanning digital mammography system was used for model validation; image quality metrics such as image contrast and contrast-to-noise ratio were calculated. The results were in good agreement with values measured using a physical breast-equivalent phantom designed for mammography. The estimated pixel intensity of the mathematical phantom, the analogue-to-digital conversion gain, and the detector additive noise showed good agreement with measured values with correlation of nearly 1. An application of the model, to examine the feasibility of using a monochromatic filter for dose reduction and improvement of image quality in slot-scanning digital mammography, is presented.
Keywords: Mathematical breast phantom, digital mammography, modified filter, point spread function, image contrast
1. Introduction
Quantitative image quality parameters such as modulation transfer function (MTF), noise power spectrum (NPS), detective quantum efficiency (DQE), signal to noise ratio (SNR), and figure of merit (FoM) are well known in the assessment of digital mammography detector performance (Siewerdsen and Antonuk, 1998; Siewerdsen et al., 1998; Stierstorfer and Spahn, 1999; Siewerdsen and Jaffray, 2000; Tkaczyk et al., 2001; Cunningham, 1994; Cunningham et al., 2002; Neitzel et al., 2001). Several test phantoms have been developed for performance assessment in digital mammography, such as the ACR (Barnes and Hendrick, 1994), TRO (MAM) (Cowen and Coleman, 1990), and IQI (Hessler et al., 1985) test phantoms. Images produced by these test phantoms are usually subjectively assessed by a human observer. The differences among human observers in the visibility thresholds of structures such as microcalcifications result in variations in perceived system performance. This limitation gives rise to a need for objective assessment. Several objective methods that have been developed to quantify system performance use computational software to emulate human detection, and are comparable with but more consistent than human observers (Chakraborty and Eckert, 1995; Smith et al., 1998; Verdun et al., 1996; Veldkamp and Karssemeijer, 1994; Pachoud et al., 2004). These objective methods mainly use a physical phantom and depend on the sensitivity of the phantom to x-ray exposure, which will affect the quantitative assessment of image quality. This approach requires acquisition of a large number of phantom images, to quantify image quality. These limitations indicate a need for a mathematical phantom with which to simulate phantom images for system design and optimization. Several 2D and 3D mathematical simulations of breast tissues and microcalcifications have been developed. Bakic et al. (2002) presented a model to simulate 2D mammograms based on simulated 3D anatomy. Hunt et al. (2005) and Dance et al. (2005) used a voxelised phantom to estimate mean glandular dose for breast dosimetry. Reiser et al. (2006) developed an analytical phantom for tomosynthesis. Bliznakova et al. (2003) simulated a 3D non-compressed breast containing tissues of different size, shape and composition, in order to generate images resembling real mammograms. They assumed the only source of noise to be the natural fluctuation of the photon flux (quantum mottle).
This report presents a tissue-equivalent mathematical breast phantom, its validation for slot-scanning digital mammography, and an examination of its use to determine the feasibility of using a monochromatic filter in digital mammography. Some structures in the mathematical phantom were simulated similarly to those in the physical tissue-equivalent phantom designed for mammography (Model 011A) manufactured by CIRS (Computerized Imaging Reference Systems, Norfolk, Virginia, USA). The model was validated by comparing images acquired of the physical breast phantom, using a prototype linear slot-scanning digital mammography system, with simulated phantom images. The mathematical phantom was used to examine the feasibility of using a monochromatic filter for dose reduction and improvement of image quality in slot-scanning digital mammography. All programs were coded using Matlab (Matlab™, The MathWorks, Natick, MA).
2. Methods
The linear slot scanning mammography x-ray prototype system used for model validation uses the same linear slot scanning technology as the Lodox Statscan low dose digital x-ray machine (Beningfield et al., 2003). The system consists of an x-ray source which is mounted on a C-arm, utilizing a narrow fan beam that scans the patient by a horizontal movement along the Z-direction in synchronism with a narrow slotted Hamamatsu detector.
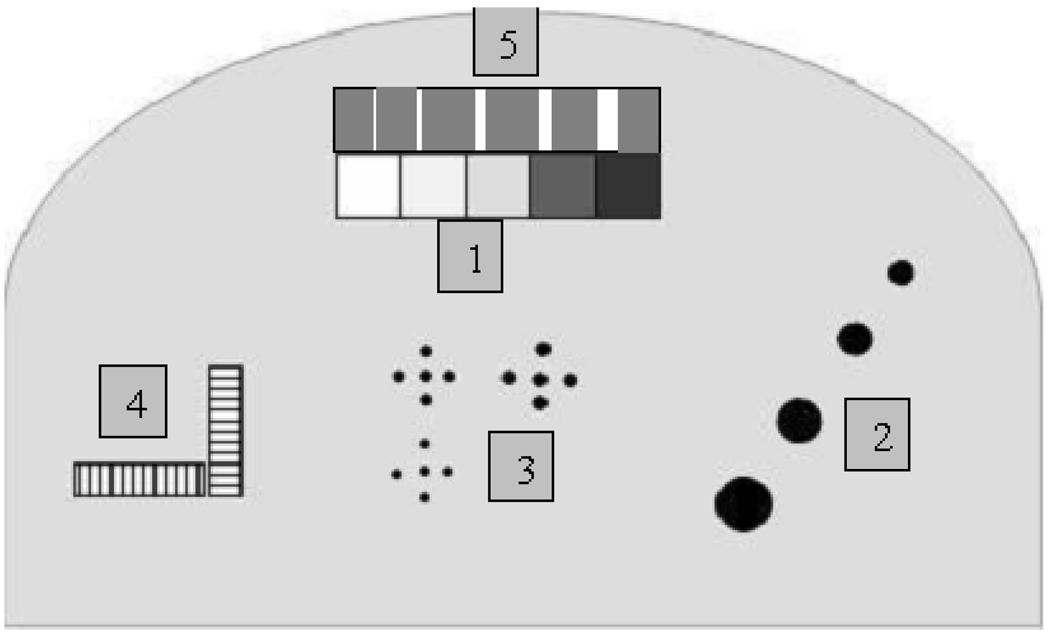
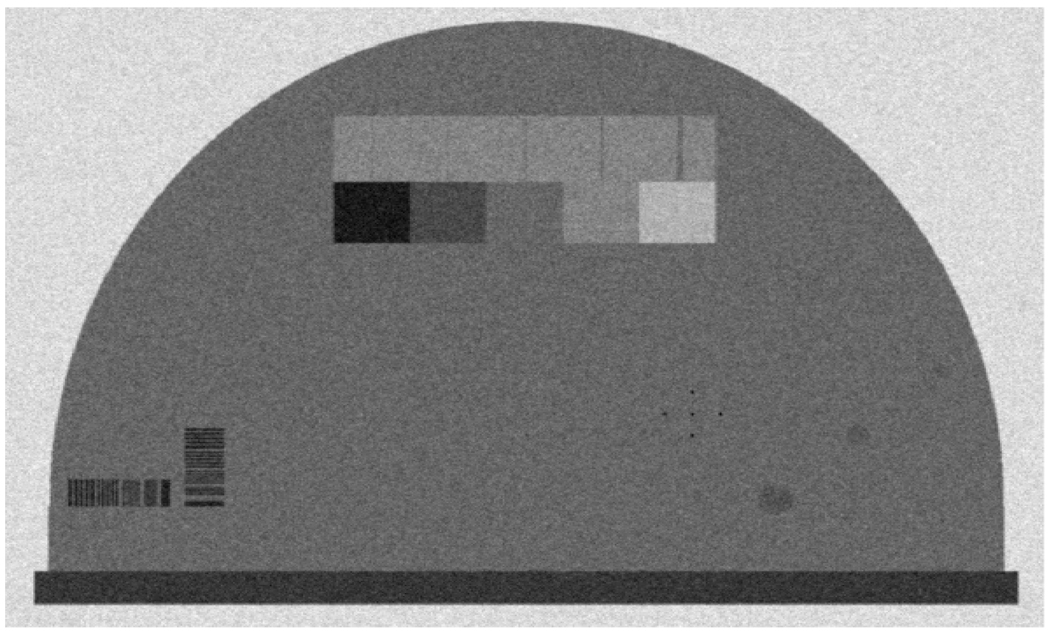
A successful x-ray phantom should mimic the attenuation properties of the tissues it represents. The mathematical breast phantom was simulated using breast tissue equivalent material of 50:50 glandular/adipose tissue. As shown in Figure 1 and Table 1, five areas containing structures simulating the absorption of 100% glandular, 70:30 glandular/adipose, 50:50 glandular/adipose, 30:70 glandular/adipose, and 100% adipose tissues, four hemispheric regions and specks simulating tumour masses and microcalcifications of different sizes were present in the phantom. The sizes were selected to include the minimum and maximum tumour masses and microcalcifications used in the physical tissue-equivalent phantom designed for mammography (Model 011A) manufactured by CIRS (Computerized Imaging Reference Systems, Norfolk, Virginia, USA). The mathematical phantom image was modeled using the following steps: modeling the pixel intensity; estimating the object contrast; modeling the detector noise; and modeling the total system resolution.
Figure 1.
Areas within the phantom simulating (1) 100% glandular, 70:30 glandular/adipose, 50:50 glandular/adipose, 30:70 glandular/adipose and 100% adipose tissues, from left to right; (2) four hemispheric regions; (3) microcalcifications of different size (CaCO3); (4) line pair tools for measuring the system resolution; (5) nylon fibers of different size.
Table 1.
Mathematical phantom specifications
| Structures | Specifications |
|---|---|
| (1) Step wedge | 100% glandular |
| 70% glandular | |
| 50% glandular | |
| 30% glandular | |
| 100% adipose | |
| (2) Hemispheric masses 75% glandular/25% adipose, thickness | 1mm |
| 2mm | |
| 3mm | |
| 4mm | |
| (3) Calcification (CaCO3) grain size | 0.122, 0.170, and 0.4 mm |
| (4) Line pair tools | 7 lp/mm |
| (5) Nylon fibers | 1.2, 0.8, 0.6, 0.4, and 0.3mm |
2.1 Modeling the pixel intensity in digital units
The pixel intensity (STe ) of the mathematical breast phantom in digital units (DU) is proportional to the photoelectron intensity (Se) generated from the x-ray photons incident on the detector and the added signal (dark signal) due to thermal electrons generated in the charge-coupled device (CCD) (Ds). The pixel intensity is corrected by subtracting the dark signal from the total signal. The corrected signal is then proportional to the photoelectron intensity.
| (1) |
The signal (photoelectrons, Se) generated by the x-ray detector from the attenuated x-ray photons depends on:
The efficiency of the detector scintillator, characterized by its quantum efficiency (QES).
The conversion of x-ray energy into light photons, characterized by the scintillator gain (DetGain).
The efficiency of transfer of quanta to the CCD, characterized by the detector coupling efficiency (CE).
The integration of quanta by the CCD, characterized by the active pixel area of the CCD (AP).
Using linear cascaded system analysis and the propagation of signal through the cascaded stages of the imaging system (Cunningham, 1994; Maidment et al., 1993; Siewerdsen and Antonuk, 1998; Siewerdsen et al., 1998; Neitzel et al., 2001), the photoelectrons Se collected by the CCD pixel can be estimated from the incident photon flux on the detector and the total system gain. Se represents the photoelectrons generated by the primary photons incident on the detector. As slot scanning eliminates more than 95% of the scattered photons, the contribution of scattered photons is ignored for this application.
| (2) |
where qSlot(E) is modified energy spectrum for a slot-scanning beam incident on the detector face; μB is the total linear attenuation coefficient of breast tissue; QECCD is the CCD quantum efficiency; Emin and Emax are the minimum and the maximum photon energies in the x-ray spectrum. Finally, the pixel intensity in digital units (DU) can be estimated from the total detector signal and the analogue-to-digital (ADC) conversion gain ADCgain:
| (3) |
where SD is the added signal in DU estimated from the CCD and ADC data sheets or measured using minimum exposure technique settings.
2.1.1 Energy spectrum simulation
The energy spectrum of the slot-scanning beam is characterized by the x-ray tube settings (tube voltage kVp and tube current mA), the effective beam width (BW), and the scanning speed (SSpeed ). The photon fluence in photons/mm2 modified for the slot-scanning beam for a given tube current and effective scanning time (mAs) can be written as:
| (4) |
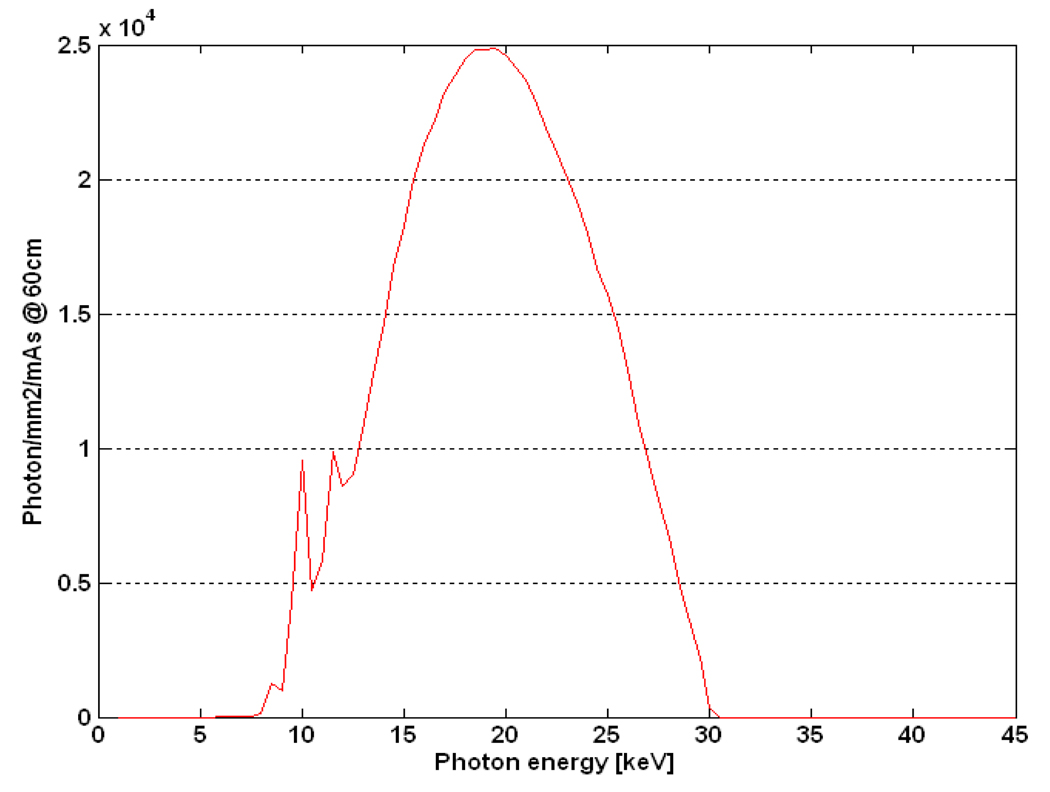
q0(E) is photon fluence, which has units of photons/mm2 per mAs, taken from published data (Boone, 1997) and calibrated for the slot-scanning beam using a measured exposure at distance of 60cm from the source and at known tube voltage, tube current, beam width and scanning speed (30kVp, 100mA, 5mm, and 22.5mm/s). Figure 2 shows the calculated spectrum for the given technique factors.
Figure 2.
The tungsten energy spectrum at a distance of 60cm, tube voltage of 30kVp, tube current of 100mA, and external filtration of 0.5mm Al, calculated using Equation 4.
The exposure in (μGy) at the surface of the phantom can be estimated from the calculated photon fluence in photons/mm2 modified for the slot-scanning beam using the empirically derived equation (Dobbins, 2000):
| (5) |
The factor of 8.76 converts mR to μGy; ξ(E) is conversion factor in units of milli-Rontgen (mR) per photons/mm2 which is estimated using the empirical equation (Dobbins, 2000):
| (6) |
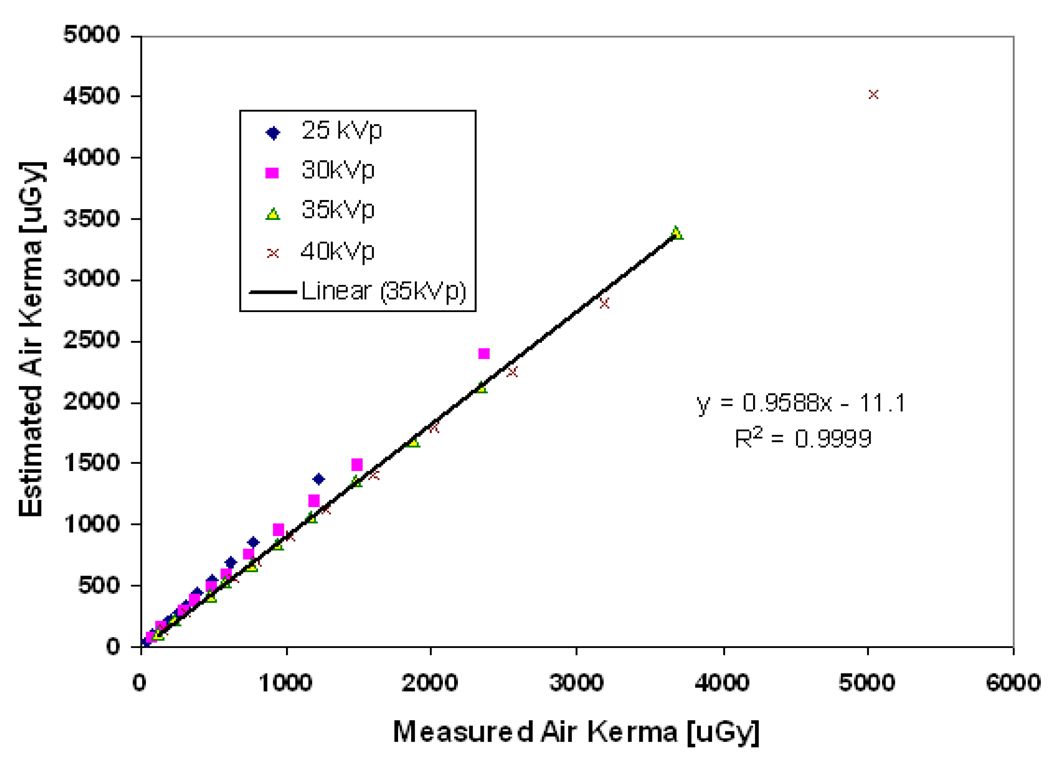
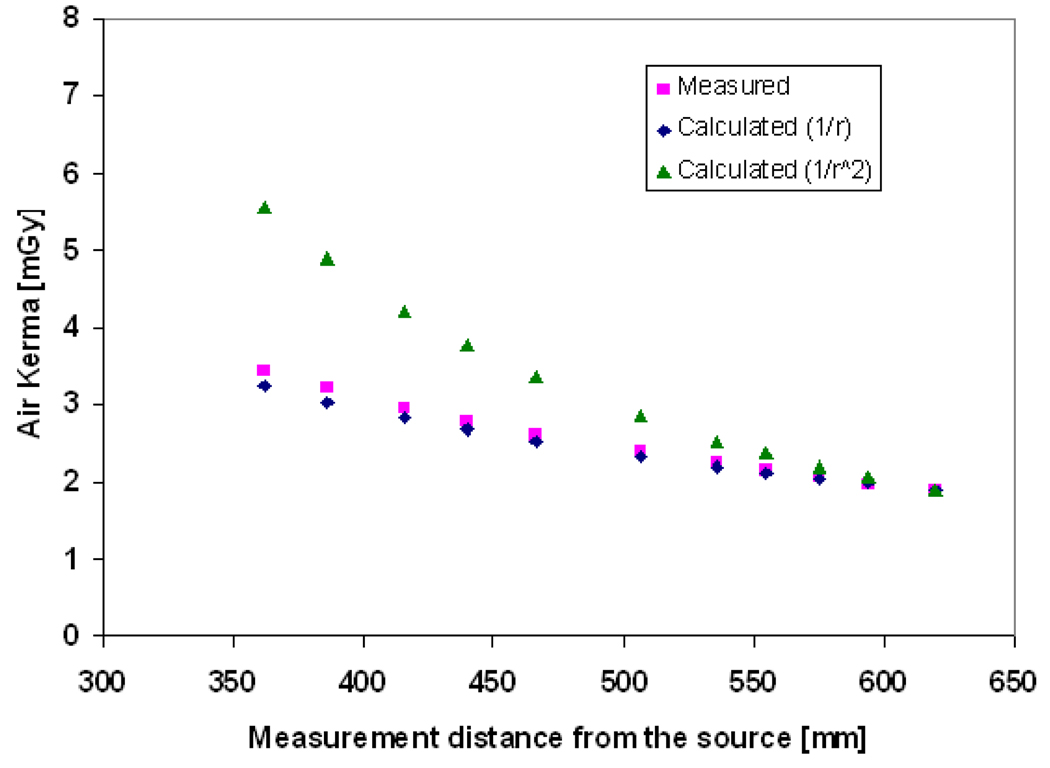
where x, y, and z are constants equal to −5.023290717769674e-06, 1.810595449064631e- 07, and 0.008838658459816926 respectively. Figure 3 shows the estimated air kerma exposure for different tube voltages and tube currents using Equation 5 compared to the values measured using a relatively large (60cm3) flat ionization chamber (Radcal 10X5-60E with Radcal 9010 dosimeter, Radcal Corporation, Monrovia). The ionization chamber was placed at a distance of 60cm from the source. Dose was then corrected for source to detector distance for linear slot scanning, following a 1/r rather than a 1/r2 law: the field area and hence the flux remains constant in the scanning direction, but decreases in the slot direction and hence dose is proportional to 1/r, as explained in detail in (deVilliers and deJager, 2003; Irving et al., 2008). This relation is confirmed experimentally for linear slot-scanning mammography as show in Figure 4. The calculated exposure using the inverse distance shows a good agreement (with < 5% error) for the distance range between 50 to 65cm from the source where the breast is normally placed in mammography.
Figure 3.
The estimated and measured entrance exposure at a distance of 60cm from the source at different tube voltages, with a correlation of 0.9999, and slope of 0.96 for 35 kVp.
Figure 4.
The measured entrance exposure as a function of distance from the x-ray source and the estimated dose using (the inverse distance (1/r) and the inverse square distance (1/r2) law.
The detector exposure, DExpo was estimated using the following equation:
| (7) |
SDD is source-detector distance; SPD is source-phantom distance. The estimated and the measured exposure show a good correlation of 0.9999, and slope of nearly 1 for tube voltage 35 kVp as indicated in Figure 3.
2.2 Estimation of the image contrast
The contrast of an object in a mammography image depends on the density of the object, the total attenuation by the object and the soft tissue in the breast, the x-ray spectrum (photon energy and tube voltage kVp), scattered radiation, and the display conditions. The object contrast can be estimated from the difference in the attenuation coefficients of the object and the surrounding background using Dobbins's relationship (Dobbins, 2000):
| (8) |
where qSlot (E) is photon fluence of the slot beam; η(E) is energy absorption of the scintillator; SPR is scatter-to-primary ratio, which is disregarded here, as slot scanning eliminates more than 95% of the scattered photons; μA is the linear attenuation of target tissue; and μB is the linear attenuation of background tissue; D is the thickness of the background area; and d is the target thickness.
The image contrast of a digital system is defined as the relative difference in intensity between the target tissue (e.g. 100% glandular tissue) and the surrounding region (e.g 50:50 glandular/adipose tissue) as shown in Equation 9. In a digital system the image contrast is equivalent to the object contrast.
| (9) |
Starget is the mean intensity value in the target area; Sbackground is the mean intensity value in the surrounding background.
2.3 Modeling the detector noise
Due to the natural fluctuation of the incident photon flux, the electrons generated by the detector obey Poisson statistics. The self-generated noise (quantum noise) and the added noise can then be estimated by using the Poisson and Gaussian distributions. The pixel intensity of a generated image must correspond to the number of incident photons per pixel and the randomly distributed noise. A noisy phantom image can be modeled as follows, with the standard deviation (σ) representing the total amount of detector noise, while n(x,y) is a matrix of × rows and y columns of random numbers corresponding to image size, which represent a Gaussian distributed with sigma=1:
| (10) |
Phn is the noisy phantom image, while Mval is the mean intensity pixel value corresponding to the electrons generated by the detector. The standard deviation, which represents the fluctuation of pixel intensity due to the quantum and added noise, can be estimated from the measurement of an image without x-rays (shutter closed) or from a sequence of images of added aluminum sheets using the minimum exposure technique settings available in the machine.
There are several sources of noise that affect the contrast of the phantom image. The detector noise can be estimated from the following:
- Quantum noise (σQ) due to a natural fluctuation of the photon flux can be estimated by the square root of the generated detector signal:
(11) - Dark noise (σD) is noise associated with dark current in CCD and is given by:
(12) Electronic noise (σE) is all other electronic noise including the amplifier noise.
- Digitization noise (σDig) depends on the analogue-to-digital converter (ADC) conversion gain; if the gain is greater than unity the digitization noise will be considered as a source of noise. The total detector noise expressed in variance is given by:
(13)
2.4 Modeling the total system resolution
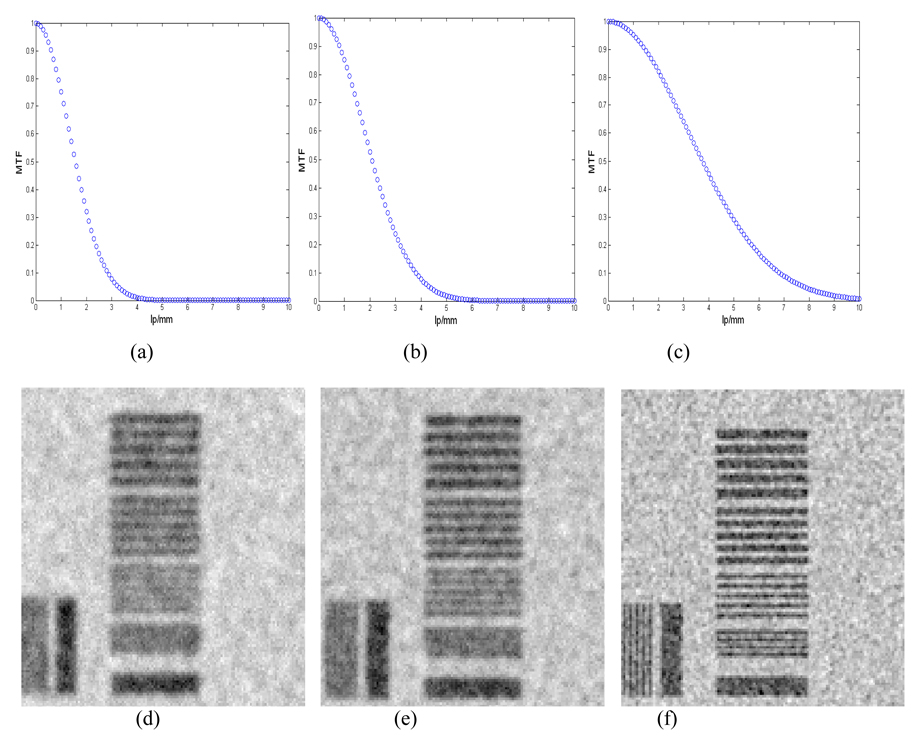
The amount of blurring or degradation of the phantom image is characterized by the distortion operator, known as the point spread function (PSF), which is convolved with an unblurred image to provide a blurred image. The total distortion of x-ray imaging detectors is characterized by the modulation transfer function (MTF) of the system, which is the Fourier transform of the point spread function, and represents the distortion in various parts of the detector such as the focal spot MTF, the scintillator MTF, pixel blurring, and the blurring due to the mismatch between the scanning velocity and the transfer rate of charge in the CCD.
Figure 5 shows the Fourier transforms of applied distortion operators, which represent the estimated MTF of the imaging system, and their effect. The line pair tools are used to visualize the amount of phantom image blurring in response to the application of different distortion operators. The system MTF in the Figure 5 characterizes the total distortion from all the sources mentioned above.
Figure 5.
The effect of phantom image blur simulated for different distortion operators (Gaussian filters) on the line pair tools included in the mathematical phantom; (a), (b), and (c) are the Fourier transforms of the applied distortion operators; (d), (e), and (f) indicate the amount of blurring from each operator.
2.5 Generation of phantom image
A grayscale intensity image is generated which contains the body of the phantom (50:50 glandular/adipose tissue) and areas representing the other structures contained in the phantom as described earlier. The intensity of pixels within the phantom body or in each area is defined by the attenuation of each structure (as a function of its density, the linear attenuation coefficient, and the thickness) or by its contrast against the background.
The phantom image parameters such as pixel intensity value, the location of structures within the phantom image, and the size and dimensions of the phantom are stored in a phantom parameter matrix. The phantom image can be modeled as follows:
An initial phantom image is generated consisting of x rows and y columns with a default pixel intensity value equal to the intensity value corresponding to the digital value of the 50:50 galndular/adiopse tissue signal.
-
The pixel intensity value in digital units (DU) is then modified for each structure according to its contrast.
(14) Phin(x,y) is the initial pixel intensity value; A is added intensity for each structure.
Quantum noise due to the nature of the x-rays is then added to the generated phantom image.
The phantom image is then modulated using the system resolution (MTF) as a distortion factor.
Figure 6 shows a phantom image generated using tube voltage of 30kVp, tube current of 200mA and 4000 electrons of additive noise, which approximately correspond to the measured variance using a dark image (no x-ray) (discussed in section 3.1).
Figure 6.
A phantom image generated using 30kVp, 200mA.
3 Validation of the mathematical phantom
The mathematical breast phantom was validated using a series of digital images of a physical tissue-equivalent phantom designed for mammography and manufactured by Computerized Imagining Reference Systems (CIRS), USA, on which the mathematical phantom was based. Phantom images were acquired using the prototype slot-scanning mammography system developed at MRC/UCT Medical Imaging Research Unit, University of Cape Town. The physical phantom was used to measure the pixel intensity, subject contrast, contrast-to-noise ratio (CNR), analogue-to-digital convertor (ADC) conversion gain, and detector additive noise. These measured values were used to validate the simulation of mathematical phantom images and the estimation of the detector noise and the conversion gain.
3.1 Estimation of digital pixel intensity and ADC conversion gain
The number of photoelectrons per pixel generated on the detector was estimated for different technique factors (tube voltage: 25, 30, 35 and 40 kVp; tube current: 16 – 200mA) using Equation 2. A series of digital images of the physical phantom were acquired at different technique factors as shown in Table 2.
Table 2.
Parameters used in obtaining digital images of the physical phantom
| Parameters | |
|---|---|
| Tube voltage | 25, 30, 35, and 40 kVp |
| Tube current | 16–200 mA |
| Scanning speed | 22.5 mm/s |
| CCD Pixel binning | 1×1 |
| Source-to-phantom distance | 60 cm |
| Collimator gap | 0.8 mm |
| Pixel size | 0.048 mm |
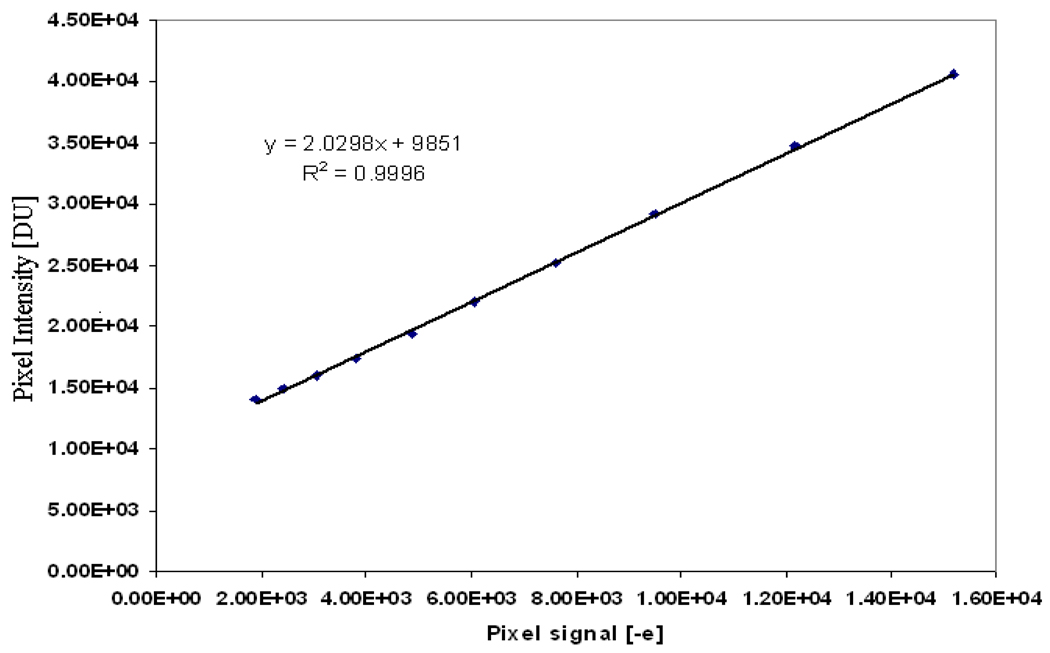
The mean pixel value in 50:50 glandular/adipose tissue in the phantom was measured for each digital image in a region of interest comprising a 100×100 pixel area. The pixel values for a tube voltage of 30kVp at different tube currents were plotted against the number of estimated photoelectrons for each detector exposure (different mA) as shown in Figure 7.
Figure 7.
Least squares fit of the measured pixel intensity and the estimated pixel signal in electrons calculated from the measured detector exposures of 30 kVp.
Using a least squares fit of the measured pixel intensities in digital unit (DU) and the estimated detector signal in (e−), the digital pixel values at different exposures can be estimated using the following equation:
| (15) |
The sensitivity of the detector is given by the slope (2.0298 DU/e−) of the fitted line in Figure 7, which is slightly less than the value (2.0 e−/DU) set manually by the operator. The conversion gain is given by the reciprocal of the slope and was found to be approximately equal to 0.5 e−/DU.
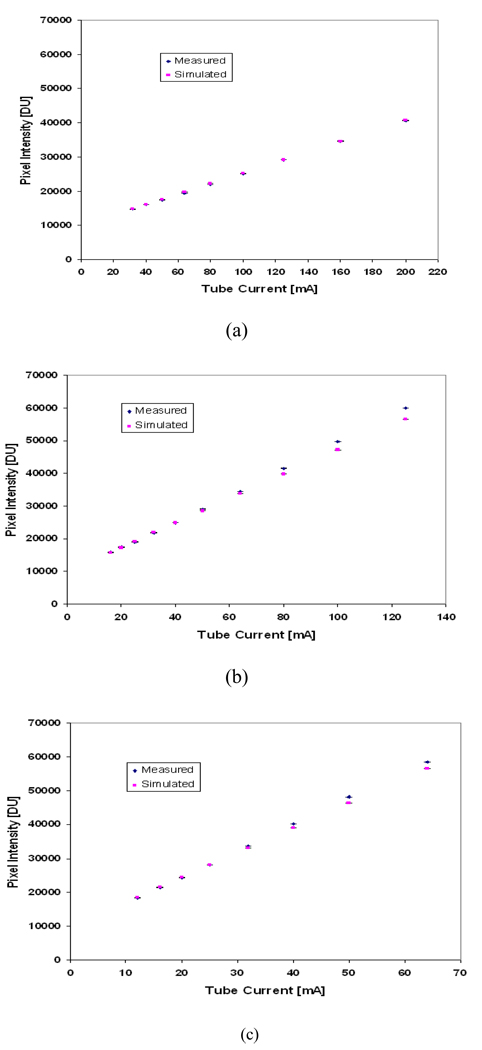
The additive detector signal (dark signal) can also be estimated for the fitted line and was found to be 9851 digital units (DU), which is approximately equivalent to 4000 electrons. This value agreed (within 95%) with the measured pixel intensity for an image taken without x-ray exposure. Figure 8 shows the pixel intensity estimated, using Equation 15, for tube voltages 30, 35 and 40 kVp, compared to the measured values. The error bars in Figure 8 indicate the range of the measured and simulated pixel intensity for a selected region of interest (i.e. the measured pixel intensity for each selected region is averaged over three readings and the simulated intensity is averaged over three simulations).
Figure 8.
The estimated and measured digital pixel intensity at (a) 30kVp (b) 35kVp (c) 40kVp.
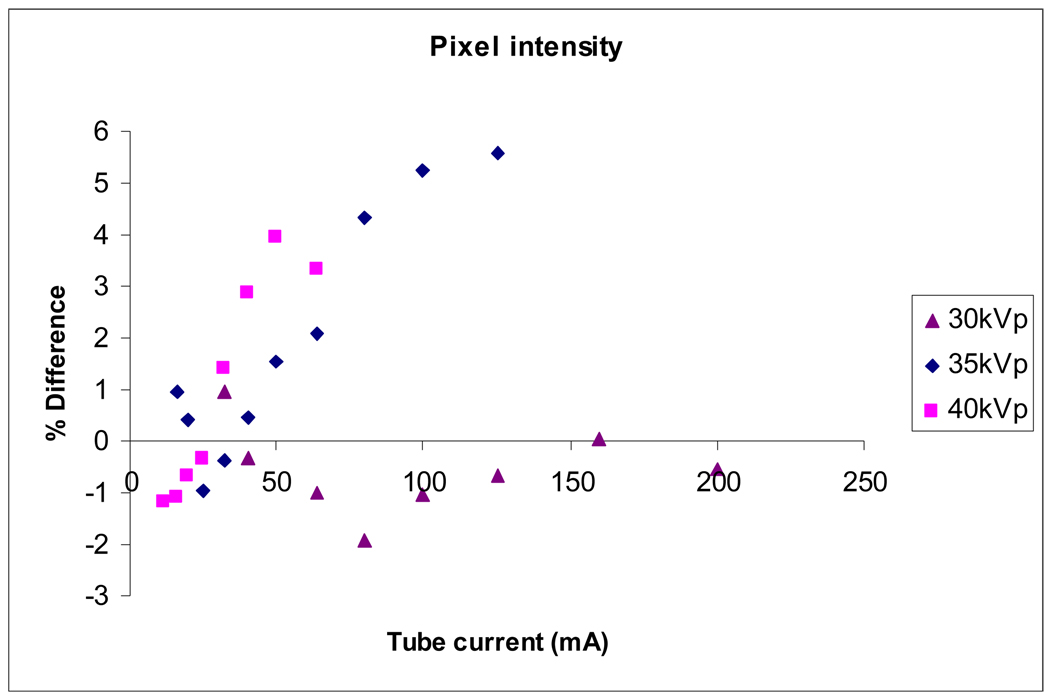
Figure 9 shows the difference between measured and simulated pixel intensity values as a function of their mean, as suggested by Bland and Altman (1986). Simulated pixel intensity values are calibrated using the measured values at 30 kVp; this is reflected in the graph, which shows small differences at 30 kVp, but differences up to 4% and 6% for 35 kVp and 40 kVp, respectively.
Figure 9.
Difference between measured and simulated pixel intensity values as a percentage of their mean.
3.2 Estimation of the image contrast
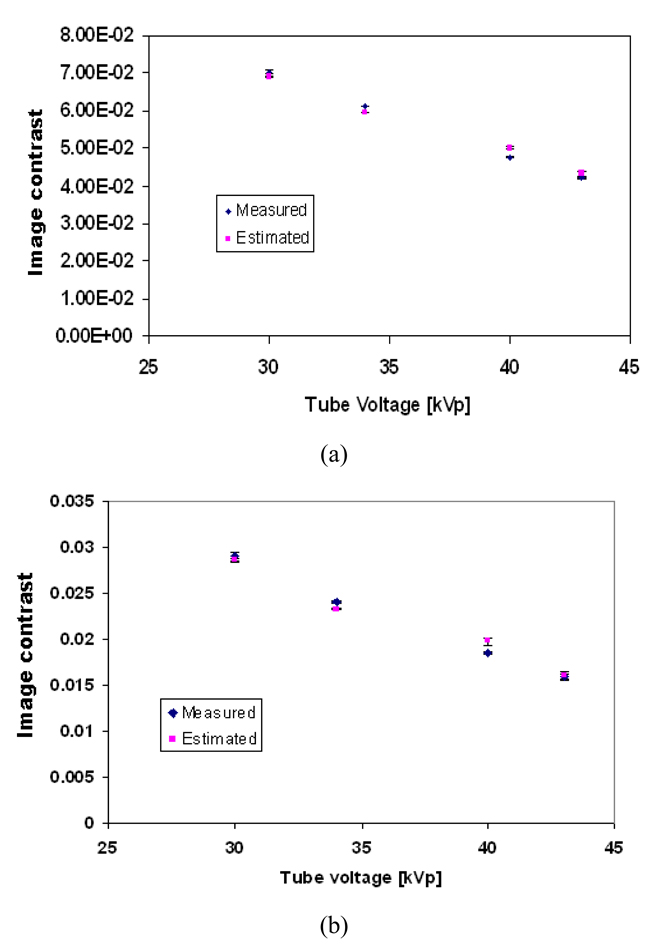
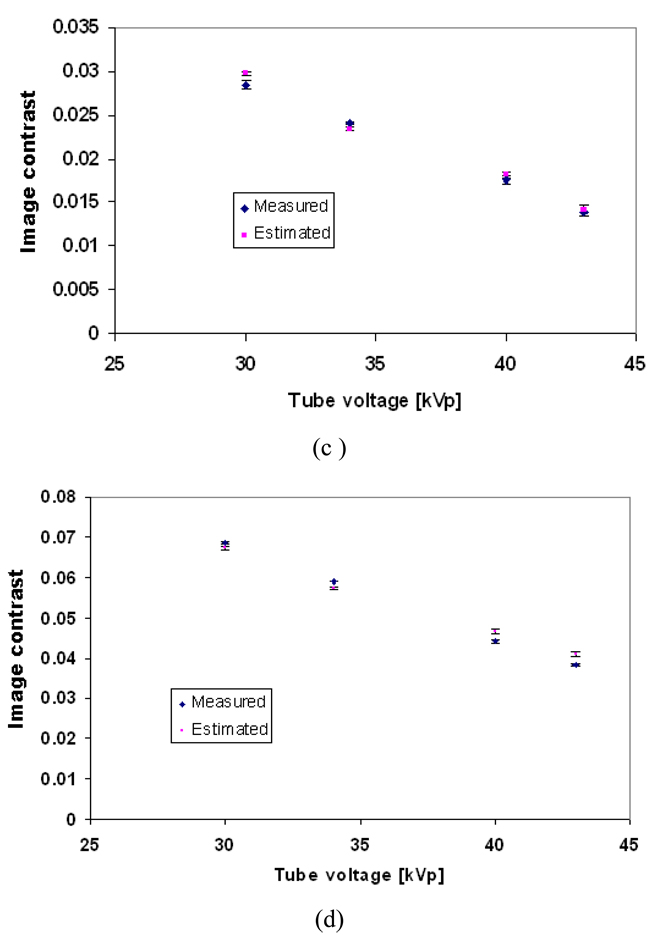
Figure 10 shows the estimated and the measured contrast for different glandular tissues in the phantom as a function of tube voltage (kVp) using Equations 8 and 9.
Figure 10.
The mean estimated and measured image contrast of different structures in the phantom as a function of tube voltage (a) 100% glandular tissue; (b) 30:70 glandular/adipose; (c) 70:30 glandular/adipose; (d) 100% adipose tissue. The error bars indicate the range in the image contrast, as three image contrast readings were taken at each setting.
A t-test was performed to compare the measured and simulated contrast values, and no statistically significant difference was found (p>0.05 in all cases).
3.3 Estimation of contrast-to-noise ratio
The contrast-to-noise ratio is the relative difference in signal between a target and the surrounding background divided by the inherent noise in the image (Equation 16). Noise usually is the measured standard deviation σ of a region of interest in the background.
| (16) |
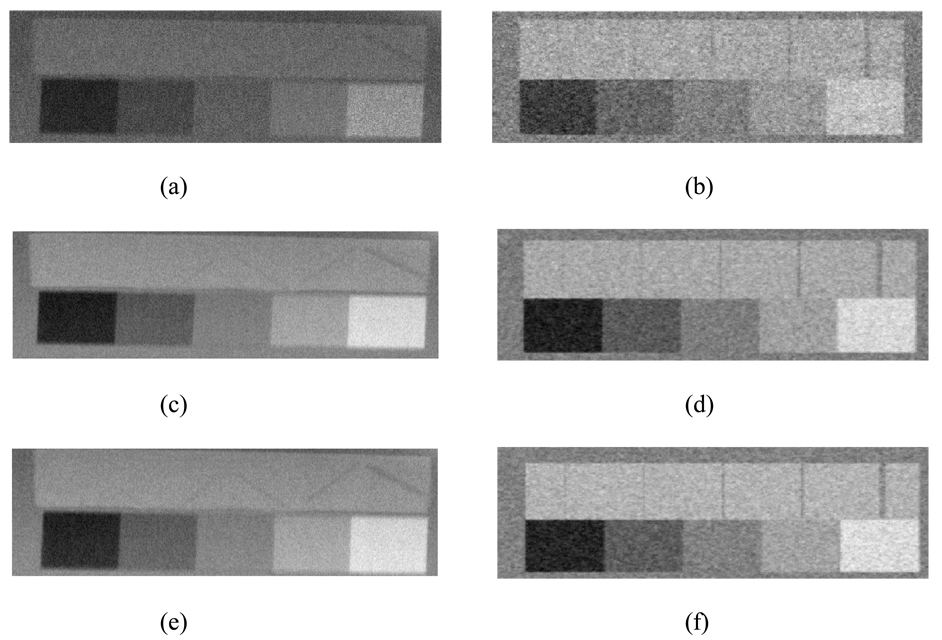
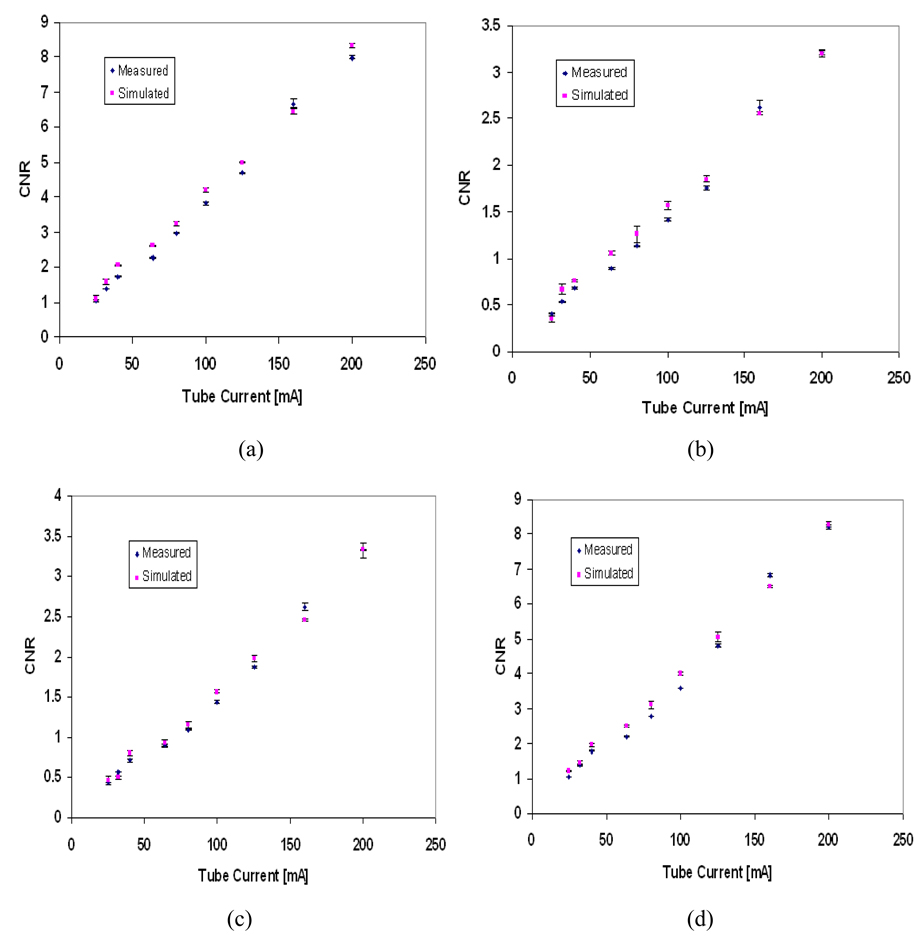
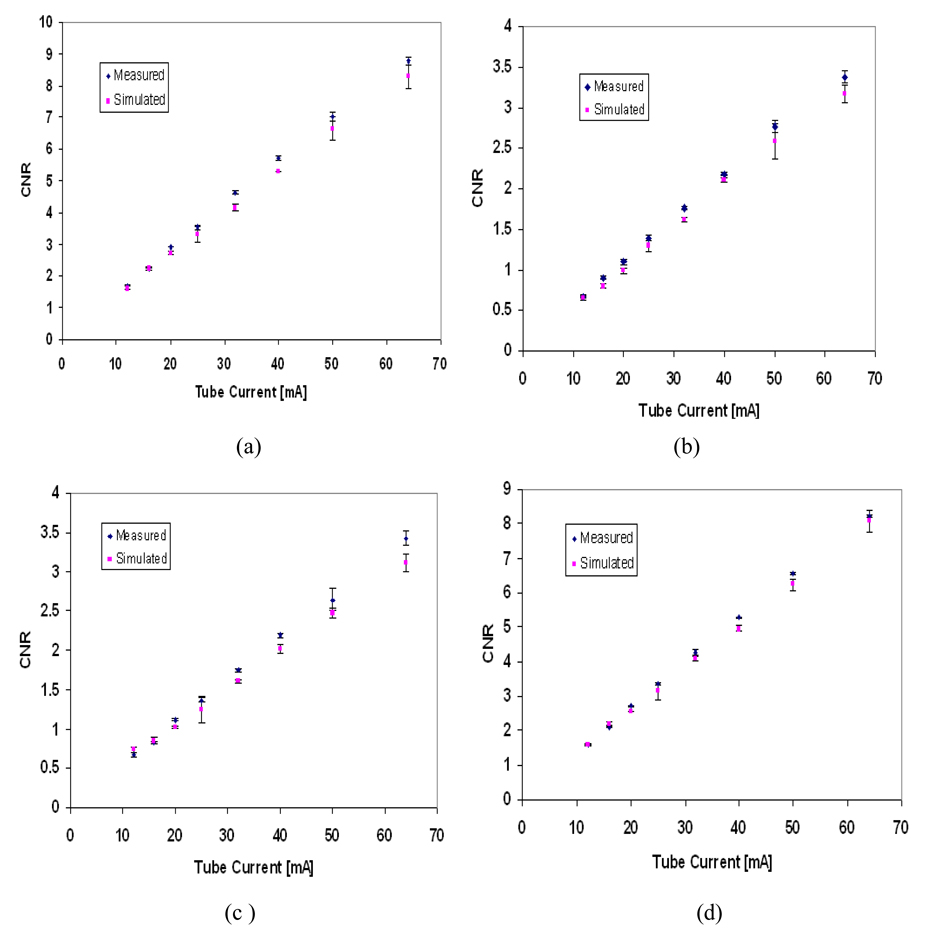
Figure 11 shows a visual comparison between the estimated and the measured image contrast for different tissue-equivalent regions included in the mathematical phantom at different tube voltages and tube currents. Figure 12 and Figure 13 show the simulated contrast-to-noise ratio (CNR) for tube voltages 30 and 40 kVp compared to the measured CNR from the digital images of the physical phantom. The error bars in Figure 11 and Figure 12 indicate the range in CNR in each region of interest (three readings were taken).
Figure 11.
The physical and the mathematical phantom images: (a) measured 30kVp, 80mA; (b) simulated 30kVp, 80mA; (c) measured 35kVp, 100mA; (d) simulated 35kVp, 100mA; (e) measured 40kVp, 64mA; (f) simulated 40kVp, 64mA. The nylon fibres in the mathematical phantom were simulated having the same diameters as those in the physical phantom, but in a vertical rather than diagonal direction for ease of implementation.
Figure 12.
Measured and simulated contrast-to-noise ratio (CNR) for different tissues within the phantom image at 30kVp tube voltage; (a) 100% glandular tissue; (b) 70% glandular tissue; (c) 30% glandular tissue; (d) 100% adipose tissue. The error bars indicate the range in CNR in each region of interest.
Figure 13.
Measured and simulated contrast-to-noise ratio (CNR) for different tissues in the phantom image at 40 kVp tube voltage, (a) 100% Glandular tissue. (b) 70% Glandular tissue. (c) 30% Glandular tissue (d) 100% Adipose tissue. The error bars indicate the range in CNR in each region of interest.
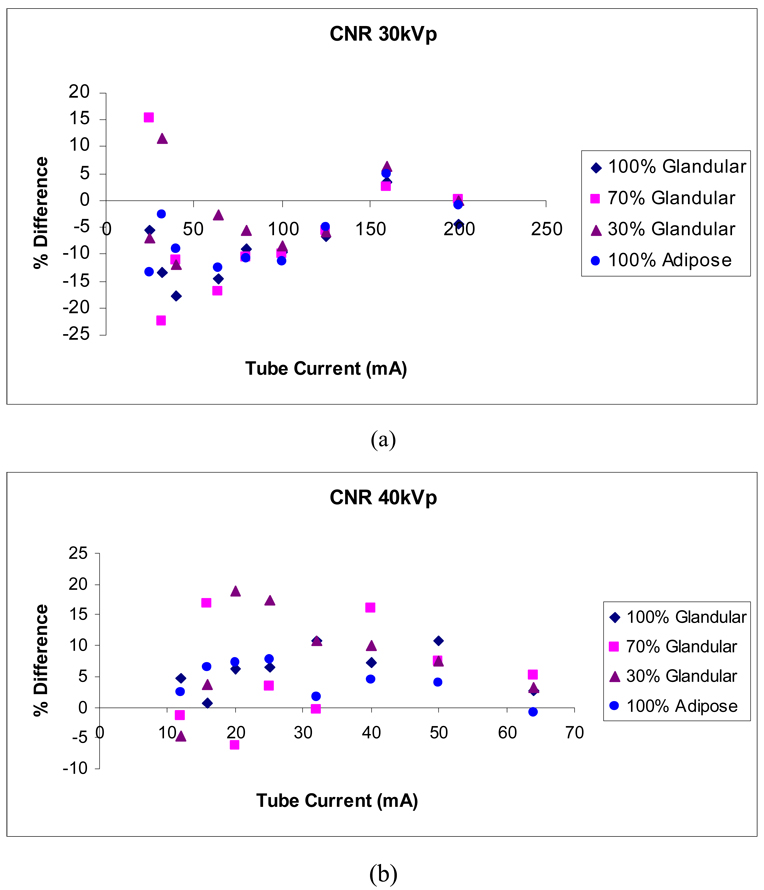
Figure 14 shows the difference between measured and simulated CNR as a percentage of their mean. Estimated CNR values depend on the estimation of pixel intensity and noise, hence higher differences are expected. Differences up to 22% are shown. The actual density and composition of the component regions of the physical phantom may play a role in producing larger differences, if the theoretical values used in the simulations misrepresent the physical values. The differences between measured and simulated CNR are more pronounced in the 30% and 70% glandular tissue, which may indicate disagreement between the theoretical and physical composition of these regions. Our larger differences occur at lower tube current, similarly to those of Doyle et al. (2006), who reported differences in measured and estimated CNR for chest radiography of up to approximately 20% as acceptable.
Figure 14.
Differences between measured and simulated CNR for 30 kVp and 40 kVp as a percentage of their mean.
The noise texture is different in the physical and simulated images; the simulated images show higher apparent granularity, which may affect lesion detectability in them.
4 Phantom application: beam optimization
There are limitations to using a polychromatic x-ray spectrum, i.e. the presence of a wide range of x-ray energies, in mammography. Firstly, the low energy photons are mainly absorbed by the breast tissue and serve to increase the absorbed dose to the patient. Secondly, the higher energy photons increase the contribution of Compton scatter, which degrades the image quality. A narrow energy spectrum can provide better contrast and significant dose reduction (Burattini et al., 1995; Boone and Siebert, 1994; Lawaczeck et al., 2005). The initial evaluation of a prototype digital mammography unit operating with a nearly monochromatic x-ray beam showed that the use of monochromatic slot-scan mammography resulted in correct identification of 93% of calcifications within a contrast-detail phantom (Diekmann et al., 2004). Clinical installation of monochromatic x-ray sources for mammography would require high-power x-ray tubes and imaging with the slot-scanning technique (Lawaczeck et al., 2005).
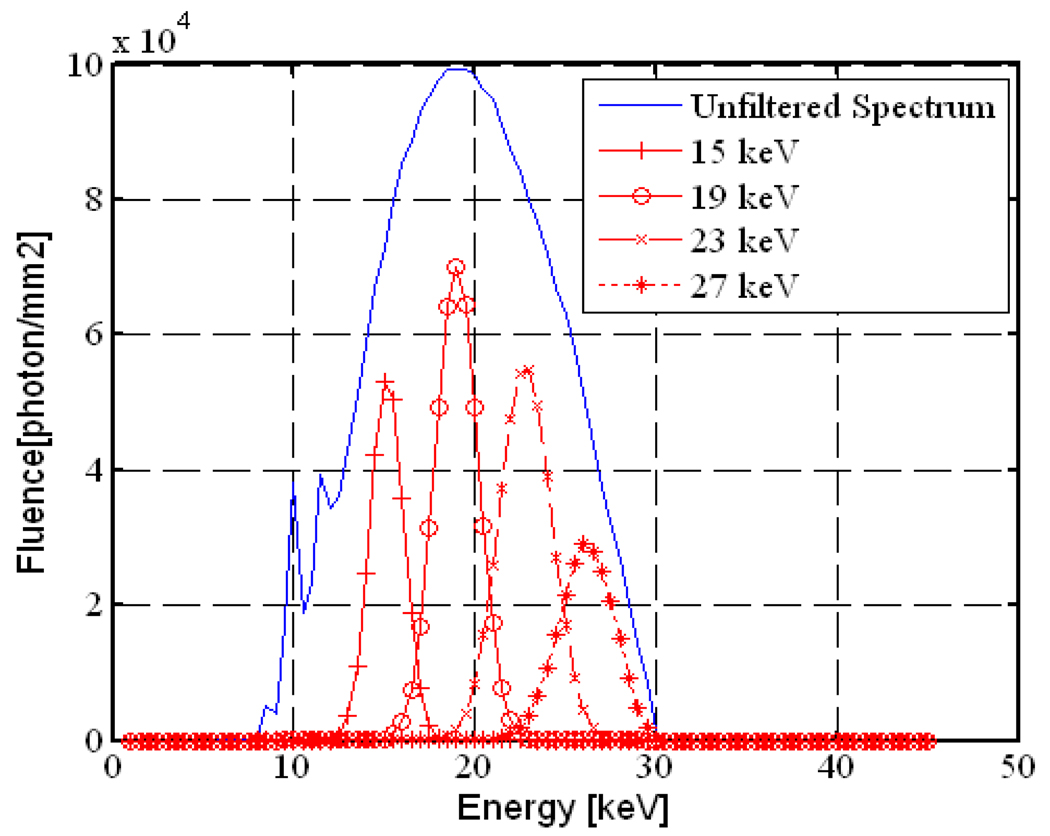
The mathematical breast phantom was used to study the feasibility of using a monochromatic filter MXF (MXF, 2006) for spectrum optimization in slot-scanning mammography. This filter produces a narrow monochromatic beam from a polychromatic x-ray beam using Bragg’s law. The monochromatic beam was simulated using a Gaussian distribution according to the data provided by the MXF manufacturer (MXF, 2006). Figure 13 shows the calculated monochromatic beams for different tuned energies. The detective quantum efficiency (DQE) was estimated using cascaded linear analysis (Siewerdsen and Jaffray, 2000). Mean glandular dose (MGD) was calculated using Boone’s fit equations (Boone, 2002).
Figure 13.
The estimated MXF monochromatic beams for different tuned energy levels and the unfiltered spectrum.
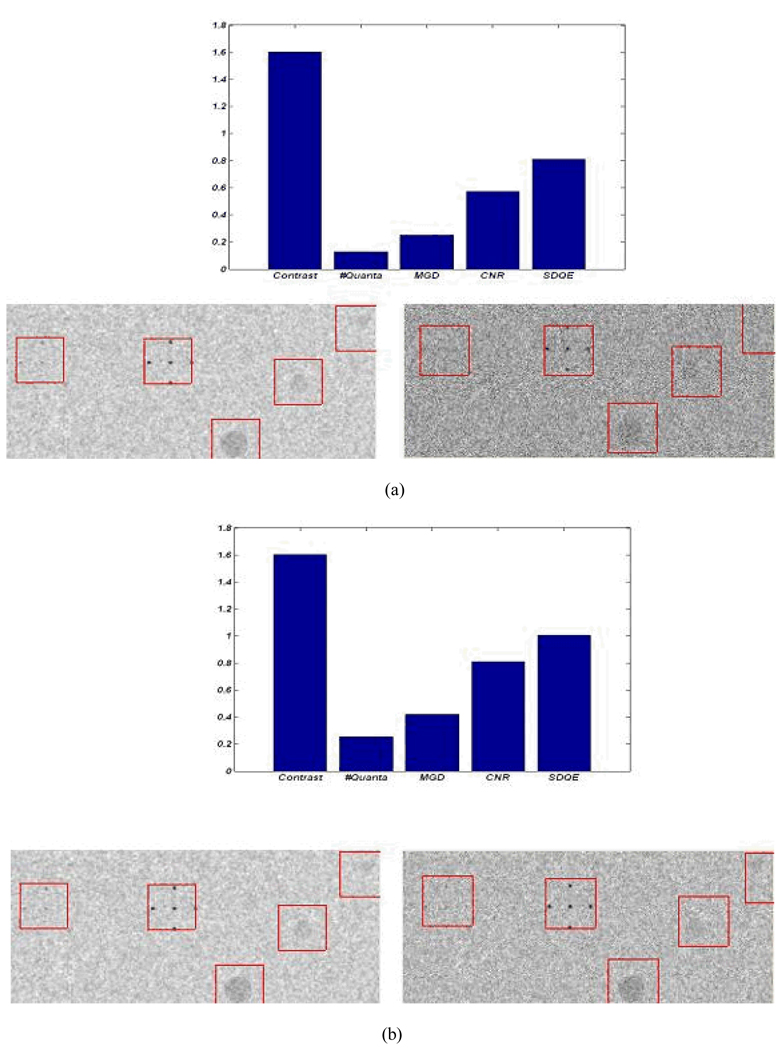
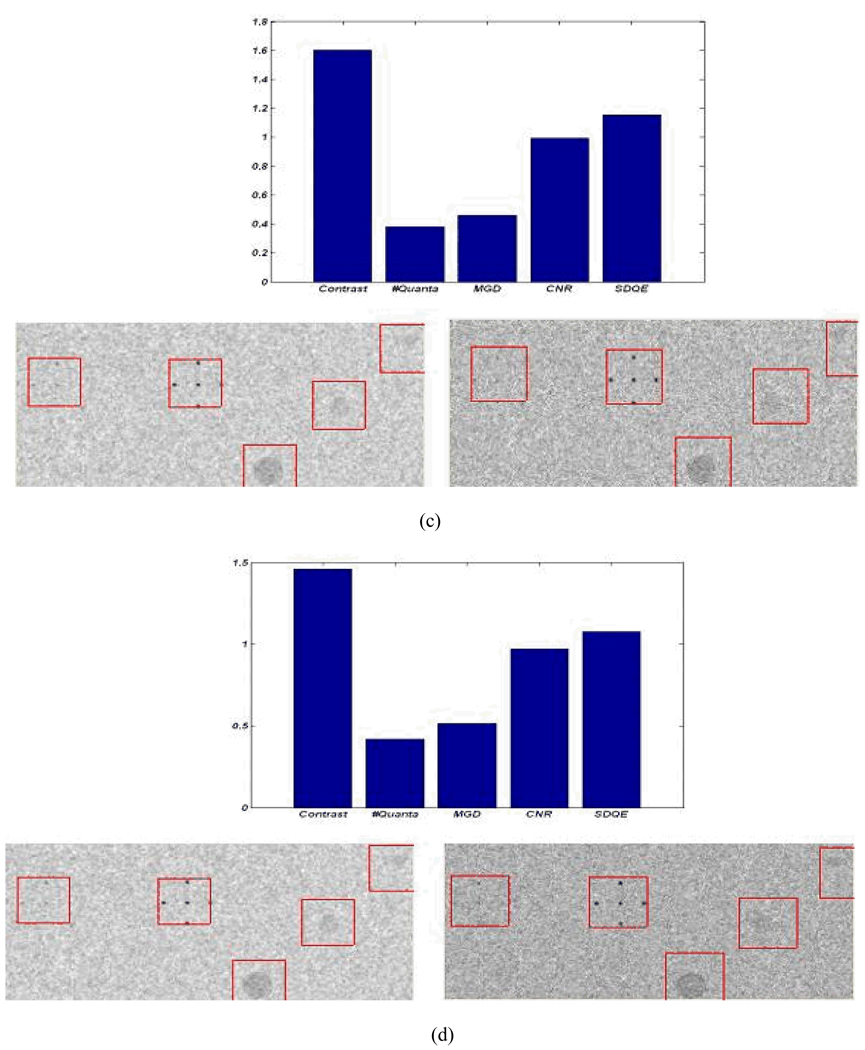
Figure 14 shows the effect of using the MXF monochromatic beam on detector performance in terms of image contrast and dose reduction. The bar plots in Figure 14 above each pair of images show the ratios of monochromatic to polychromatic performance (image contrast, mean glandular dose (MGD), contrast-to-noise ratio (CNR), and system detection efficiency (DQE)), values above unity represent an improvement in the image quality parameters and increases in the mean glandular dose. A monochromatic x-ray beam with monochromatic filter tuned to 19keV will result in a 60% improvement in contrast as shown in the bar plots in Figure 14 (a), (b), and (c). Using the narrow spectrum will also result in dose reduction and a consequent reduction in photon flux. To achieve the same contrast-to-noise ratio using the two types of beams, an increase in scanning time or tube loading is required for the monochromatic beam. For the 19keV monochromatic beam (10% FWHM) tripling the scanning time will result in same contrast-to-noise ratio with a 50% dose reduction with respect to the polychromatic beam as shown in Figure 14 (c). Using a wider monochromatic beam (e.g. 25% FWHM) produces similar improvements as tripling the scanning time of the 10 FWHM monochromatic beam, as shown in Figure 14 (d).
Figure 14.
The image performance of the polychromatic (left) and the monochromatic (right) beams at tube voltage (30kVp) and tube current (100mA) - the polychromatic beam is the unfiltered spectrum shown in Figure 13 and the monochromatic beam is tuned to 19 keV; (a) performance using the same technique factors; (b) doubling the scanning time of the monochromatic beam; (c) tripling the scanning time of the monochromatic beam; (d) doubling the scanning time and using FWHM of 25% rather than 10% for the monochromatic beam.
5 Discussion
A breast tissue-equivalent mathematical phantom was simulated for digital mammography to resemble a physical tissue-equivalent phantom designed for mammography. The exposures estimated for different tube voltages and tube currents showed good agreement with the measured values (with a good correlation and slope of nearly one, as indicated in Figure 3). The estimated exposure using the inverse distance (1/r) rather than inverse square distance (1/r2) shows a good agreement (with < 5% error) for the distance range between 50 and 65cm from the source where the breast is normally placed in mammography. These estimated exposures were used for calibration of the incident energy spectrum for a given technique factor. The estimated analogue-to-digital conversion gain shows good agreement with values set manually. The additive noise due to dark signal and electronics was measured using digital images acquired with x-ray radiation off. The image contrast and the contrast to noise ratio (CNR) for different regions simulating the glandular and the adipose tissue showed a good agreement with the measured values.
The agreement between the measured physical images and the measured image quality parameters (image contrast and contrast-to-noise ratio) with the estimated values allows the use of this mathematical phantom for parameter optimization in slot-scanning mammography. Caution should be exercised at low tube currents as these produce higher simulation errors. In addition, the composition of the physical phantom as a source of difference between measured and simulated values should be investigated.
The optimization of the x-ray spectrum using a monochromatic filter results in better contrast and the same image quality (CNR and DQE), with a significant dose reduction. The performance of the monochromatic filter depends on selection of spectrum tuned energy and the beam width (FWHM).
It should be noted that the simulated phantom presents a uniform background rather than the randomly structured background of breast tissue, that the sizes of the objects simulating lesions may be insufficient for the task, and that sub-pixel alignment has not been addressed. For these reasons, the simulation model may not be sufficient for the evaluation of lesion detectability.
The scope of the model presented is limited to the simulation of the CIRS-based phantom imaged with a slot-scanning system. Therefore, the model, and the results of simulating a monochromatic beam, may not be generalizable beyond the specified system.
For slot-scanning digital mammography, the model estimates both qualitative and quantitative image quality parameters for detector design and optimization, and provides both quantitative and visual assessment of system performance. Simulation of structures in the mathematical phantom that exist in a physical phantom designed for mammography, allows direct comparison between simulated and acquired images for a given system and allows calibration of the mathematical phantom. The model also provides visual tools for the estimation of system resolution, which is limited by the image matrix size (maximum of 7 lp per mm for 12 bit image 4069 × 4069 pixels).
The model provides simulation tools which can be easily calibrated for different x-ray tubes and detectors. Most of the available simulated breast phantoms (Bakic et al., 2002; Bliznakova et al., 2003; Hunt et al., 2005; Dance et al., 2005; Reiser et al., 2006) are modeled to resemble anatomical structures and breast composition realistically, and to allow for the simulation of anatomical variations. These phantoms cannot be easily used for mammography signal calibration and quality control. Most of the quality control phantoms are physical phantoms, which need physical measurement for system calibration and optimization. An easily calibrated software quality control phantom will be useful in detector design and optimization.
Acknowledgements
The study was funded by the National Institutes of Health (R21CA101705-01A2), Lodox Systems, and the Technology and Human Resources for Industry Programme of the National Research Foundation (South Africa).
References
- Bakic PR, Albert M, Brzakovic D, Maidment ADA. Mammogram synthesis using a 3d simulation. i. breast tissue model and image acquisition simulation. Medical Physics. 2002;29(9):2131–2139. doi: 10.1118/1.1501143. [DOI] [PubMed] [Google Scholar]
- Barnes GT, Hendrick RE. Mammography accreditation and equipment performance. Radiographics. 1994;14:129–138. doi: 10.1148/radiographics.14.1.8128045. [DOI] [PubMed] [Google Scholar]
- Beningfield S, Potgieter H, Nicol A, van As S, Bowie G, Hering E, Latti E. Report on a new type of trauma full-body digital x-ray machine. Emergency Radiology. 2003;10:23–29. doi: 10.1007/s10140-003-0271-x. [DOI] [PubMed] [Google Scholar]
- Bland J, Altman D. Statistical methods for assessing agreement between two methods of clinical measurement. Lancet. 1986;1:307–310. [PubMed] [Google Scholar]
- Bliznakova K, Bliznakov Z, Bravou V, Kolitsi Z, Pallikarakis N. A three-dimensional breast software phantom for mammography simulation. Physics in medicine and biology. 2003;21(22):3699–3719. doi: 10.1088/0031-9155/48/22/006. [DOI] [PubMed] [Google Scholar]
- Boone JM. Molybdenum, rhodium, and tungsten anode spectral models using interpolating polynomials with application to mammography. Medical Physics. 1997;24(12):1863–1874. doi: 10.1118/1.598100. [DOI] [PubMed] [Google Scholar]
- Boone JM. Normalized glandular dose .dgn. coefficients for arbitrary x-ray spectra in mammography: Computer-fit values of monte carlo derived data. Medical Physics. 2002;29(5):869–875. doi: 10.1118/1.1472499. [DOI] [PubMed] [Google Scholar]
- Boone JM, Siebert JA. A comparison of mono- and polyenergetic x-ray beam performance for radiographic and fluoroscopic images. Medical Physics. 1994;21:1853–1863. doi: 10.1118/1.597185. [DOI] [PubMed] [Google Scholar]
- Burattini E, Cossu E, Maggio CD, Gambaccini M, Indovina PL, Marziani M, Poce KM, Simeoni S, Simonetti G. Mammography with synchrotron radiation. Radiology. 1995;159:239–244. doi: 10.1148/radiology.195.1.7892478. [DOI] [PubMed] [Google Scholar]
- Chakraborty DP, Eckert MP. Quantitative versus subjective evaluation of mammography accreditation phantom images. Medical Physics. 1995;22:133–143. doi: 10.1118/1.597463. [DOI] [PubMed] [Google Scholar]
- Cowen AR, Coleman NJ. Design of test objects and phantoms for quality control in mammography physics of diagnostic radiology. IPSM Report. 1990;61:30–36. [Google Scholar]
- Cunningham IA. A spatial-frequency dependent quantum accounting diagram and detective quantum efficiency model of signal and noise propagation in cascaded imaging systems. Medical Physics. 1994;21(3):417–427. doi: 10.1118/1.597401. [DOI] [PubMed] [Google Scholar]
- Cunningham IA, Yao J, Subotic V. Cascaded linear-systems models and the dqe of flat-panels imagers: Noise aliasing, secondary quantum noise and reabsorbtion. Proceedings of SPIE. 2002;4682:246–249. [Google Scholar]
- Dance DR, Hunt RA, Bakic PR, Maidment ADA, Sandborg M, Ullman G, Carlsson GA. Breast dosimetry using high-resolution voxel phantoms. Radiation Protection Dosimetry. 2005;114(1–3):359–363. doi: 10.1093/rpd/nch510. [DOI] [PubMed] [Google Scholar]
- deVilliers M, deJager G. Detective quantum efficiency of the lodox system. Proceedings of SPIE. 2003;2708 [Google Scholar]
- Diekmann F, Diekmann S, Richter K, Bick U, Fischer T, Lawaczeck R, Press W-R, Schn K, Weinmann H-J, Arkadiev V, Bjeoumikhov A, Langhoff N, Rabe J, Roth P, Tilgner J, Wedell R, Krumrey M, Linke U, Ulm G, Hamm B. Near monochromatic x-rays for digital slot-scan mammography: initial findings. European Radiology. 2004;14:1641–1646. doi: 10.1007/s00330-004-2378-1. [DOI] [PubMed] [Google Scholar]
- Dobbins JT. Handbook of Medical Imaging. Bellingham, Washington 98227-0010, USA: SPIE, The International Society for Optical Engineering; 2000. [Google Scholar]
- Doyle P, Martin CJ, Gentle D. Application of contrast-to-noise ratio in optimizing beam quality for digital chest radiography: comparison of experimental measurements and theoretical simulations. Physics in Medicine and Biology. 2006;51:2953–2970. doi: 10.1088/0031-9155/51/11/018. [DOI] [PubMed] [Google Scholar]
- Hessler C, Depeursinge C, Grecescu M, Pochon Y, Raimondi S, Valley JF. Objective assessment of mammography systems. Radiology. 1985;156:215–219. 221–225. doi: 10.1148/radiology.156.1.4001409. [DOI] [PubMed] [Google Scholar]
- Hunt RA, Dance DR, Bakic PR, Maidment ADA, Sandborg M, Ullman G, Carlsson GA. Calculation of the properties of digital mammograms using a computer simulation. Radiation Protection Dosimetry. 2005;114(1–3):395–363. doi: 10.1093/rpd/nch519. [DOI] [PubMed] [Google Scholar]
- Irving BJ, Maree GJ, Hering ER, Douglas TS. Radiation dose from a linear slit scanning X-ray machine with full body imaging capabilities. Radiation Protection Dosimetry. 2008 doi: 10.1093/rpd/ncn073. doi: 10.1093/rpd/ncn073. [DOI] [PubMed] [Google Scholar]
- Lawaczeck R, Rein V, Deeg W. Dedicated mammography: Imaging with monochromatic X-rays and a clinical mammography unit. Nuclear Instruments & Methods in Physics Research Section A-Accelerators Spectrometers Detectors and Associated Equipment. 2005;548(1–2):147–154. [Google Scholar]
- Maidment ADA, Fahrig R, Yaffe MJ. Dynamic range requirements in digital mammography. Medical Physics. 1993;20(6):1621–1633. doi: 10.1118/1.596949. [DOI] [PubMed] [Google Scholar]
- MXF. Tunable monochromatic x-ray filter. Univ of Maryland park, USA: Monochromatic X-ray Filter Technologies Inc; 2006. [Google Scholar]
- Neitzel U, Gunther-Kohfahl S, Borasi G, Samei E. Determination of the detective quantum efficiency of a digital x-ray detector: Comaprison of three evaluations using a common image data set. Medical Physics. 2001;31(8):2205–2211. doi: 10.1118/1.1766421. [DOI] [PubMed] [Google Scholar]
- Pachoud M, Lepori D, Valley JF, Verdun FR. A new test phantom with different breast tissue compositions for image quality assessment in conventional and digital mammography. Physics in Medicine and Biology. 2004;49:5267–5281. doi: 10.1088/0031-9155/49/23/005. [DOI] [PubMed] [Google Scholar]
- Reiser I, Sidky EY, Nishikawa RM. Development of an analytic breast phantom for quantitative comparison of reconstruction algorithms for digital breast tomosynthesis. Lecture notes in computer science. 2006;4046:190–196. [Google Scholar]
- Siewerdsen JH, Antonuk L. DQE and system optimisation for indirectdetection flat-panel imagers in diagnostic radiology. Proceedings of SPIE. 1998;3336:546–555. [Google Scholar]
- Siewerdsen JH, Antonuk LE, El-Mohri Y, Yorkston J, Huang W, Cunningham IA. Signal, noise power spectrum, and detective quantum efficiency of indirect detection flat-panel imagers for diagnostic radiology. Medical Physics. 1998;24:614–628. doi: 10.1118/1.598243. [DOI] [PubMed] [Google Scholar]
- Siewerdsen JH, Jaffray DA. Optimisation of x-ray imaging geometry (with specific application to flat-panel cone-beam computed tomography. Medical Physics. 2000;27:1903–1914. doi: 10.1118/1.1286590. [DOI] [PubMed] [Google Scholar]
- Smith ADC, Smith IAC, Dance DR. Objective assessment of phantom image quality in mammography: a feasibility study. British Journal of Radiology. 1998;71:48–58. doi: 10.1259/bjr.71.841.9534699. [DOI] [PubMed] [Google Scholar]
- Stierstorfer K, Spahn M. Self-normalising method to measure the detective quantum efficiency of a wide range of x-ray detectors. Medical Physics. 1999;26(7):1312–1319. doi: 10.1118/1.598626. [DOI] [PubMed] [Google Scholar]
- Tkaczyk JE, LeBLanc J, Nevin R, Kautz G, Albagli D, Sandrik J, Granfors PR. Modelling the x-ray energy characteristics of dqe for full-field digital mammography. AProceedings of SPIE. 2001;Vol 4320:570–581. [Google Scholar]
- Veldkamp WJ, Karssemeijer N. Accurate segmentation and contrast measurement of microcalcifications in mammograms: a phantom study. Medical Physics. 1994;25:1102–1110. doi: 10.1118/1.598302. [DOI] [PubMed] [Google Scholar]
- Verdun FR, Moeckli R, Valley JF, Bochud F, Hessler C. Survey on image quality and dose levels used in Europe for mammography. British Journal of Radiology. 1996;69:762–768. doi: 10.1259/0007-1285-69-824-762. [DOI] [PubMed] [Google Scholar]


