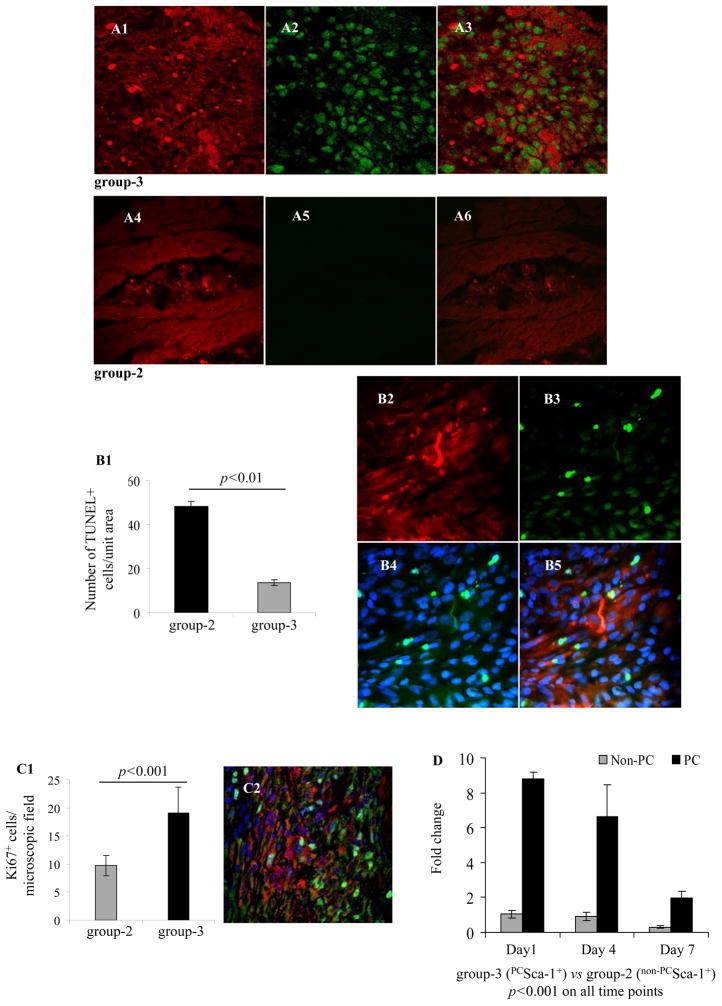
Figure 5.
Confocal microscopy images of rat heart tissue sections on 1-day after transplantation of PKH 26 labeled (A1-A3) PCSca-1+ and (A4-A6) non-PCSca-1+(red fluorescence). (A3) Merged image showing higher pAkt levels (green) in group-3 animal hart as compared to (A6) group-2. (B1–B5) TUNEL staining on histological sections from various treatment groups on day-7 showed that the number of TUNEL+ cells was lower in group-3 as compared to group-2. B2–B5 are representative Figures of the TUNEL stained histological sections on day-7 after cell engraftment in group-3 (B2 red= PKH26; B3 green=TUNEL staining; B4 merged image of TUNEL staining (green) with DAPI (blue) to visualize all the cell nuclei; B5= B2–B4 merged image. (C1) Graph showing higher number of Ki67+ cells in group-3 as compared to group-2 on 7-day after cell engraftment as determined by Ki67 specific immunostaining. (C2) Representative confocal images of Ki67+ cells (green) in infarction area 7-days after PKH26 labeled PCSca-1+ engraftment (red). DAPI was used for visualization of the nuclei (blue). (D) Real-time PCR for mouce sry-gene to determine donor cell survival in the female recipient heart. PCSca-1+ survival was significantly higher as compared to non-PCSca-1+ on all time-points of engraftment.

