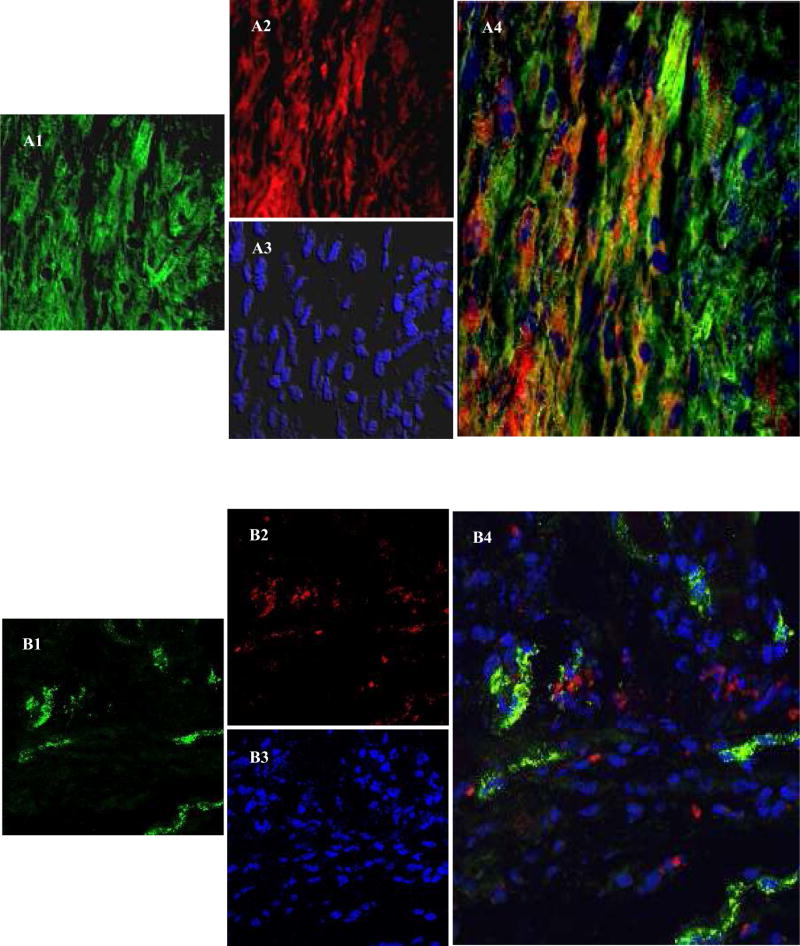
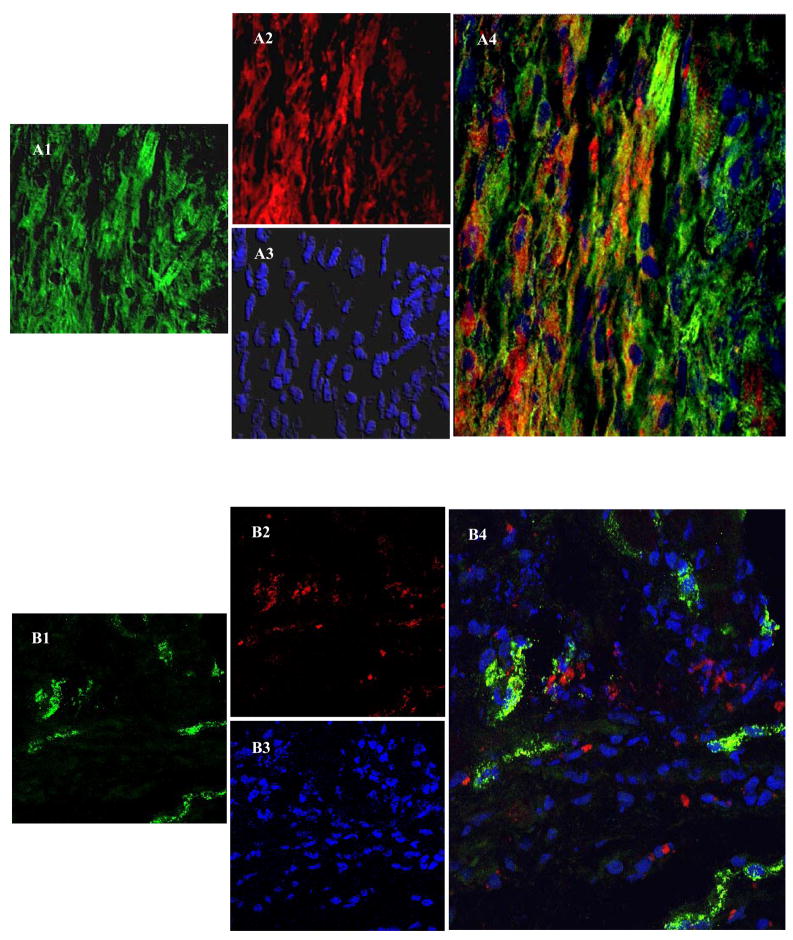
Figure 6.
Confocal images of histological sections immunostained for α-sarcomeric actinin on 7-day after cell engraftment; (Figure A1–A4) group-3 and (Figure B1–B4) group-2. C1–C4 shows immunostaining of the histological sections for myosin heavy chain (MHC) at 6-weeks after PCSca-1+ transplantation. Primary antigen-antibody reaction in all the panels was detected by secondary antibody conjugated with Alexa Flour-488 (green A1, B1 & C1). The cells were labeled with PKH-26 (red; A2, B2 & C2). The nuclei were visualized with DAPI (blue; A3, B3 & C3). C3 is a merged image of MHC (green) counterstained for Cx-43 expression (cyan) and DAPI (blue). Merged images (A4 & C3–C4) showed extensive myogenesis in group-3 animal hearts as compared to (B4) group-2 in the center of the infarct region. Figure C4 shows co-localization of MHC (green) and Cx-43 (cyan) in the newly formed myofibers in the cell engrafted region (red). Large yellow and red boxes are magnified in Figure C4 to show co-localization of Cx-43 (cyan), MHC (green) and PKH26 (red). (D1–D4) Ultra-structure studies of the rat heart tissue at 6-weeks in group-3. D1 shows tight junctions between two adjacent differentiating cells (Yellow box). D3 shows typical newly differentiating myofibers with visible filaments (red box). D2 and D4 represent magnified images of D1 and D3 respectively.


