

Abstract
Background:
In patients with multiple sclerosis (MS), contrast-enhancing lesions (CELs) on postcontrast MRI are considered markers of the inflammatory responses associated with blood-brain barrier breakdown. Based upon shape, CELs may be defined as nodular (nCEL) or ring (rCEL) lesions. Several short-term studies pointed towards the assumption that rCELs represent areas of a more aggressive inflammatory process.
Methods:
In the present long-term (i.e., 2 years) retrospective natural history study, we used monthly imaging to follow rCEL and nCELs evolution in 16 patients with MS during the natural history. New CELs were identified monthly on month 4–9 MRIs, using month 1–3 MRIs to ensure that all CELs were not previously enhancing. Chronic black holes (cBHs) were counted monthly upon CEL disappearance up to the 24th MRI. Generalized estimating equation methods investigated within-patient differences between rCELs and nCELs in volume and likelihood to convert into cBHs. Kaplan-Meier survival curves estimated differences in the length of persistence between cBHs originating from nCELs and cBHs deriving from rCELs.
Results:
Fifty-two new rCELs and 281 nCELs were identified. rCELs had larger mean (z = 5.06, p ≤ 0.0001) volumes than nCELs. The proportion of cBHs from rCELs was similar (z = 1.81, p = 0.0710) to the proportion of cBHs from nCELs. Likewise, the length of persistence of cBHs deriving from rCELs was similar (χ12 = 2.339, p = 0.1262) to the duration of cBHs from nCELs.
Conclusions:
Our data suggest that worse radiologic characteristics associated with the acute phase of ring contrast-enhancing lesions and nodular contrast-enhancing lesions do not necessarily reflect a poorer lesion outcome over time.
GLOSSARY
- cBH
= chronic black hole;
- CEL
= contrast-enhancing lesion;
- EDSS
= Expanded Disability Status Scale;
- MP
= methylprednisolone;
- MS
= multiple sclerosis;
- nCEL
= nodular contrast-enhancing lesion;
- NIB
= Neuroimmunology Branch;
- rCEL
= ring contrast-enhancing lesion;
- RR
= relapsing remitting;
- SP
= secondary progressive.
In patients with multiple sclerosis (MS), contrast-enhancing lesions (CELs) on postcontrast T1-weighted MRIs are accepted as surrogate markers of blood-brain barrier (BBB) breakdown and inflammation.1–8 Nevertheless, the underlying pathology of CELs may be sustained by a heterogenic immune cascade.9,10 It remains unknown whether different immunologic features may be reflected by differences in MRI CEL appearances.
Motivated by this notion, several MRI CEL characteristics that might be related to different degrees of disease severity were studied. One example is the CEL shape; that is, ring CELs (rCELs) and nodular CELs (nCELs). On the basis of results from cross-sectional and short-term monthly longitudinal imaging studies, it has been hypothesized that rCELs undergo a more aggressive type of inflammation.11–18
However, previous studies grouped lesions across different patients, potentially introducing interpatient biologic variability as a confounding factor. Secondly, due to the limited observation window, little information about the evolution of rCELs over the long term is provided.
To better understand the clinical significance of rCELs and nCELs, we analyzed differences between rCEL and nCEL characteristics and evolution over a long period of time (i.e., 2 years) using monthly MRIs. We investigated differences between rCELs and nCELs in the 1) mean, total, starting, and maximum volume; 2) likelihood to convert into a cBH; and 3) duration of corresponding cBHs. Additionally, for lesions that fluctuated between rCEL and nCEL shape during their monthly MRIs (i.e., fluctuating lesions), the differences in volume during the rCEL and separately the nCEL phase were investigated.
METHODS
Patient selection and study design.
The present study was performed at the NIH in Bethesda, MD. Retrospective MRI data from 16 patients were analyzed. Patients were previously diagnosed with either relapsing remitting (RR) or secondary progressive (SP) MS according to Poser criteria.19 Data from all patients previously enrolled in a natural history protocol at the Neuroimmunology Branch (NIB) were screened. To be eligible for this retrospective natural history study, patients were then required to 1) be in the natural history phase; 2) have never been treated with immunomodulatory or immunosuppressive drugs, with the exception of IV methylprednisolone (MP) at 1 g/day for 3–5 days, or oral prednisone taper for a clinical relapse, either before or during the entire duration of the study; 3) be steroid-free for at least 1 month prior to their first MRI scan; and 4) have at least 24 monthly MRI and clinical examinations. Seventeen patients met these criteria, but since one presented with no CELs during the entire study, 16 patients were included.
The majority of the data were from patients included in the study when no immunomodulatory treatments were available (i.e., from 1985 until 1994). In very few cases, data belonged to patients who were enrolled when immunomodulatory treatments were available (i.e., from 1995 until 1997) but refused to undergo chronic therapy with approved medications.
Standard protocol approvals.
The approval from the Intramural Research Board of the National Institute of Neurological Disorders and Stroke was given for the study. All patients involved in the study submitted informed written consent to participate.
Clinical examination.
Data on clinical disability for each patient were determined using the Expanded Disability Status Scale (EDSS)20 by an MS-specialized clinician.
We defined any EDSS change ≥1 in EDSS scores ≤5.0 and ≥0.5 on scores ≥5.5,21,22 confirmed in 3 consecutive monthly visits, to be significant.
MRI protocol.
Each patient had 24 consecutive monthly MRIs for a collected total of 384 MRI scans. Details regarding pulse parameters have been previously described.23 All MRIs were performed at 1.5 Tesla (General Electric Medical Systems, Milwaukee, WI) using a standard head coil. Twenty-seven contiguous 5-mm-thick axial images with 24-cm field views were obtained in 11 patients (i.e., patients 1–3, 5–9, and 14–16). In 4 patients (i.e., patients 4 and 11–13), 42 contiguous 3-mm-thick axial images were instead consistently obtained over the study duration. In a single case (i.e., patient 10), a change in the MRI thickness occurred during the study and resulted in images unsuitable for precise registration. In this patient, only CELs during the first 9 months were counted, while cBHs were not identified.
Image postprocessing.
Image registration.
For each patient, all T1-weighted precontrast and postcontrast images were registered upon the baseline image using a Rigid Body Transformation registration tool with 6 degrees of freedom as available in the FSL (http://www.fmrib.ox.ac.uk/).
CEL analysis.
First, all CELs were identified on hard copies by consensus of 2 investigators (M.D. and F.B.) and agreement with a senior third experienced radiologist (N.R.). In each patient, CELs were identified on 6 monthly MRIs obtained during months 4–9 of the study period. The latter was done to ensure 3 months of observations preceding the appearance of each CEL, verifying that each CEL observed on months 4–9 was not previously enhancing. Once the new CELs were identified, one investigator (M.D.) manually traced CELs and computed the number and volume of all CELs. The generated masks were then carefully inspected by a senior investigator (F.B.).
CELs were categorized as rCELs or nCELs. rCELs were visually defined as CELs consisting of a partially, or entirely, peripheral hyperintensity surrounding a region of hypointensity on a T1-weighted image with Gd-DTPA enhancement. All other hyperintense lesions were defined as nCELs. Figure e-1, A and B, on the Neurology® Web site at www.neurology.org shows examples of both an rCEL and nCEL.
Once identified, the number, volume, and duration of rCEL and nCEL were recorded. A computer-based program, MEDx 3.44 visualization and analysis software (Medical Numerics, Inc., Sterling, VA; www.medicalnumerics.com), was used to trace and measure CELs and cBHs on the coregistered MRI as previously described.24 For rCELs, only the hyperintense portion was counted to determine the lesion's size.
Upon examination of CELs, 8 patients (patients 2, 5, 7, 10, 11, and 14–16 in table 1) occasionally had the central hypointense regions of rCELs re-enhance as nCELs during the 6-month baseline period. The contrary was also observed; the CELs originated as nCELs and progressed into rCELs. Figure e-1, C and D, shows examples of fluctuating nCEL and rCELs on consecutive monthly MRIs. To account for the subset group of fluctuating lesions, each CEL was followed on a monthly basis and identified as either an nCEL or rCEL for each month within its duration. The mean volumes for duration of time spent as rCEL and separately as nCEL were than determined and recorded on a patient-to-patient basis. However, for the subsequent statistical group analyses, fluctuating CELs were counted as rCELs.
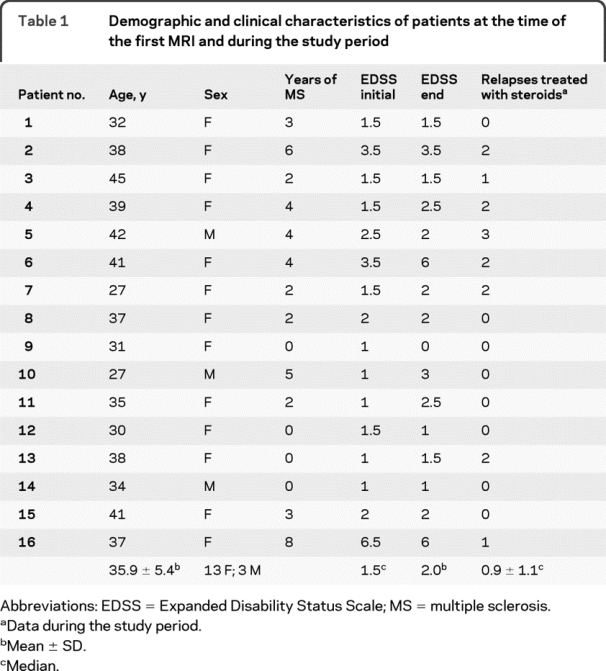
Table 1 Demographic and clinical characteristics of patients at the time of the first MRI and during the study period
cBH analysis.
cBHs were followed from the time of their initial appearance as cBHs (i.e., as soon as the enhancement disappeared) through month 24. As previously reported,25 cBHs were defined as any hypointense lesion with respect to the surrounding normal-appearing white matter on a T1-weighted image with a corresponding hyperintensity on the T2-weighted image and not coincident with a CEL. Only cBHs originating from CELs identified in this study were followed.
Similar to the procedure used for CELs, all cBHs were identified on hard copies with consensus of 2 investigators (M.R. and F.B.). Then, using MEDx, one observer (M.R.) upon confirmation by a second observer (F.B.) manually traced and computed the number of cBHs.26 The generated masks were then carefully inspected by a senior investigator (F.B.).
Statistical analysis.
Details of the statistical analyses are reported in appendix e-1.
RESULTS
Clinical outcome of patients during the study period.
Table 1 summarizes demographics and clinical characteristics at the time of the first study MRI as well as the clinical outcome of the patients during the study period. As described, 4 (25.0%) patients had increased EDSS changes ≥1.0 and 1 (6.3%) patient had decreased EDSS changes ≥1.0 during the study period. Eight (i.e., 50.0%) patients had at least one clinical exacerbation and were treated with steroid pulses. At the enrolment time, all of the patients but one (patient 16 in table 1 with SPMS) were in the RR stage of MS. None of the patients had changes in their MS stage by the end of the study.
CELs occurrence and characteristics.
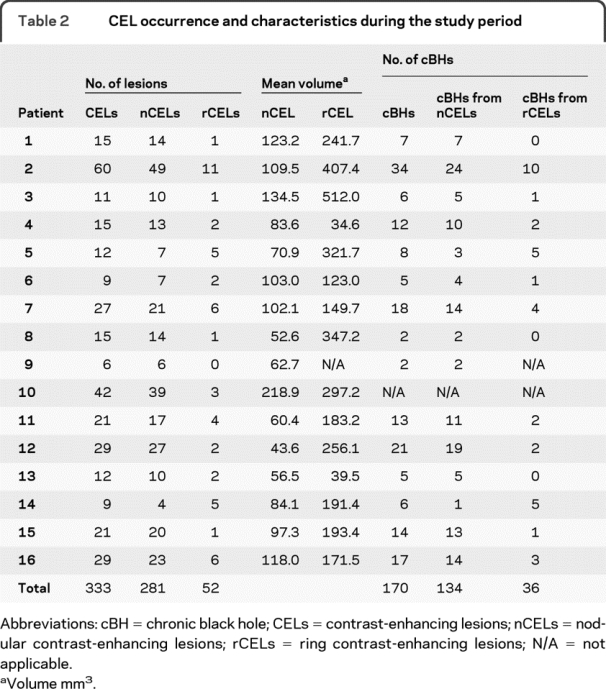
Overall, CELs were identified on 88 (91.7%) of the 96 monthly MRIs evaluated for CELs within the 16 patients. Eleven (68.8%) patients (patients 1–3, 5, 7–8, 10–11, 13–14, and 16) had active CELs on all 6 months of images used for CEL analysis, 2 (12.5%) patients (patients 12 and 15) had active CELs on 5 months, and 3 (18.7%) patients (patients 4, 6, and 9) had active CELs on 4 months. Table 2 summarizes CEL occurrences and characteristics for each patient. We identified 333 new CELs. Fifty-two CELs (15.6%) were rCELs and 281 CELs (84.4%) were nCELs. Thirteen (81.3%) of the 16 patients exhibited larger rCEL than nCEL (patients 1–3, 5–8, 10–12, 14–16), 2 patients exhibited larger nCEL than rCEL (patients 4 and 13), and 1 patient did not present with any rCELs (patient 9). On average, rCELs had larger mean (z = 5.06, p < 0.0001, figure e-2, A and B), total (z = 4.08, p < 0.0001, figure e-2, C and D), maximum (z = 4.74, p < 0.0001, figure e-2, E and F), and initial (z = 4.38, p < 0.0001, figure e-2, G and H) volumes compared to nCELs.
Table 2 CEL occurrence and characteristics during the study period
Fluctuation in shape of CELs.
Fifteen (4.5%) of the 333 CELs experienced fluctuations between rCEL and nCEL shape. This phenomenon was observed in 8 patients (patients 2, 5, 7, 10, 11, and 14–16). Nine lesions originated as nCELs and fluctuated into rCELs. Four of these 9 then reverted back to nCEL shape. Conversely, 6 CELs started as rCELs and terminated as nCELs. Generally, for the rCELs which fluctuated into nCELs, only parts of the ring border persisted as CEL over time, leaving the classic nodular shape to the lesion. The average duration of fluctuating lesions was 3.1 months. Log-transformed lesion volume was significantly larger during the rCEL phase (z = 6.10, p < 0.0001) than during the nCEL phase. Geometric mean of lesion volume with rCELs was 426.0 mm3 (90% confidence interval [147.32–1232.05]) compared to 115.6 mm3 (90% confidence interval [30.53–437.93]) in nCELs.
Occurrence and duration of cBHs.
Owing to technical reasons (see Methods), one patient was excluded from the cBH analyses, leaving 291 CELs and 15 patients. A total of 170 (58.4%) progressed into cBHs during the follow-up period. Specifically, 36 out of 49 (73.5%) rCELs progressed to cBHs while 134 of 242 (55.4%) nCELs progressed. The proportion of cBHs from rCELs (estimated proportion = 0.7318) was similar (z = 1.81, p = 0.0710) to the proportion of cBHs from nCELs (estimated proportion = 0.6464).
The mean (median, minimum–maximum value) duration of cBHs originating from rCELs was 11.4 (14.5, 1–20) months and was similar to that of 9.4 (11, 1–20) months for those originating from nCELs (χ12 = 2.339, p = 0.1262). To rule out the possible effect of differences in duration of enhancement associated to different CEL types, the length of enhancement was used as a covariate in the proportional hazard model and was found to be not significant (χ12 = 0.276, p = 0.5132). Thus, the subsequent model was fit without the length of enhancement as covariate. It is upon such an analysis that no difference in the duration in time of cBHs originating from rCELs compared to those originating from nCELs was seen.
Correlations between clinical and MRI data.
Within the entire cohort, the percentage of rCELs over the total number of CELs did not correlate with either the number of relapses (z = 1.4, p = 0.1617) or the change in EDSS score (z = 0.4, p = 0.6692) during the study period.
DISCUSSION
A number of scientific concerns make it important to characterize CELs. CELs are a key radiologic MS-induced abnormality,1 indicative of ongoing inflammatory activity. Characterizing the severity of CELs would help clinicians understand the features of the disease within each patient and to individualize therapeutic approaches aimed at preventing or minimizing inflammation-related biologic sequela. CEL quality could also be used as an outcome measure in clinical trials.
In the present study, we compared rCELs and nCELs in a cohort of patients followed for a relatively long time period (i.e., 2 years) with monthly MRIs. In contrast to previous reports, lesions were not pooled across subjects. Conversely, comparisons between rCELs and nCELs were obtained within the same subject, nullifying the confounding effect possibly exerted by interpatient biologic variability.
Of the 16 examined patients, 15 (93.8%) presented with rCELs. The frequency of rCEL occurrence is within the range of previous studies,16,17,27 in which rCELs occurred in 20%–93% of the patients. Two reasons why our proportions are skewed toward higher values are 1) in our study, multiple MRIs were analyzed within the same patient, increasing the likelihood to find active lesions; 2) our cohort of patients with MS was on average very active (only 8.3% of scans presented with no CELs), which increased the chance of finding different lesion types.
Additionally, we found that for a small proportion of CELs, rCELs and nCELs had different phases associated with the same lesion. The latter, which has rarely been described in previous studies, may be an additional source of variability between previous results and ours.
When examining rCELs' and nCELs' associated characteristics predictive of worse prognosis, we considered markers of acute and chronic phase. For the acute phase, we considered the CELs' size. For the chronic phase, we considered the rCELs' likelihood to evolve into a cBH as well as the duration of the newly formed cBH. Finally, the relationship between the percentage of rCELs and the clinical outcome was investigated.
In accordance with previous research,11 rCELs were on average larger than nCELs. Interestingly, rCELs were found to be significantly larger than nCELs, even when representing different phases of the same CEL within the same subject. Undoubtedly, rCELs correspond to areas where enhancement is largely expanded. Whether the larger size is a sign of a more destructive inflammatory process remains to be elucidated. These differences might be due to larger but transient areas of edema and water extravasations linked to the BBB breakdown.
To provide additional insights into this topic, we examined a second marker classically considered as a sign of more severe underlying lesion inflammation, the likelihood to convert into a cBH.
Our cohort of patients had a higher proportion of rCELs progress into cBHs compared to nCELs but there was no significant difference between cBHs from preexisting rCELs compared to nCELs.
The duration in time is an additional marker of disease severity of a cBHs and was considered a third possible indicator of worse CEL evolution. As the figure shows, cBHs from rCELs had a similar duration compared to cBHs from nCELs, signifying that rCELs are not necessarily associated with a more severe immune response and are rather prone to undergo repair mechanisms similar to nCELs.

Figure Kaplan-Meier curve of chronic black hole (cBH) persistence
Kaplan-Meier survival analysis of cBHs based on preexisting contrast-enhancing lesion (CEL) type, i.e., ring contrast-enhancing lesion (rCEL) vs nodular contrast-enhancing lesion (nCEL). The dashed line with closed symbols represents cBHs originating from nCELs. The solid black line with open symbols represents cBHs deriving from rCELs. In both curves, the circles stay for censored data. The censored data indicate that cBHs were still present but not followed at the conclusion of the study (i.e., month 24). As the curves show, there is a noticeable, but not significant, trend toward cBHs from preexisting rCELs lasting longer than cBHs from preexisting nCELs. The duration of a total of 170 cBHs was analyzed. Thirty-four cBHs derived from rCELs, 136 from nCELs.
Cumulatively, our data suggest that CEL radiologic characteristics associated with the acute phase are not necessarily a sign of worse lesion evolution over time. Specifically, in the acute phase, the lesion size suggests that rCELs are apparently more severe than nCELs but the long-term chronic phase indicates that the differences are not retained.
In this regard, our results are in agreement with previous literature that showed that rCELs initially have lower MTR values compared to nCELs but after 12 months of follow-up, the rCEL MTR values return to nCEL equivalent MTR values.14 The latter suggests that a large amount of edema and water may be present in rCELs, initially lowering the MTR values. However, as time progresses, the enhancement resolves, and the MTR values increase and revert to values similar to nCELs. Biologically, the radiologic observations signify a similar extent of demyelination and/or remyelination.
Undoubtedly, from our evidence, we reach conclusions that seem not to entirely overlap with some previously reported studies, although likely expanding those.12,13,15–18,27 Several reasons may account for these discrepancies. First, we performed within-patient comparisons and lesions were not pooled across patients. This approach was chosen in order to prevent biased results by excluding the possibility of different biologic behavior linked to patient variability. Secondly, due to the large monthly dataset, for the first time we could use outcome variables such as cBH duration, which had not been used before and forms the basis of the main discrepancy with existing literature.
In drawing definite conclusions from our data, however, one should consider the possibility of important biases, which our dataset and study design did not control for. That is to say, it might be possible that lesion differences related to their shape vary across patients and may be associated with different biologic substrates dependent on the individual. It is also likely that heterogeneity exists within the rCELs. While for some of the rCELs seen in some patients, the central pallor might represent an area of minimal BBB leakage which would show as hyperintense in delayed acquisitions, for some others it may indeed be an area of underlying early axonal damage.
Additionally, although the current study reviewed numerous scans, the cohort of patients was relatively small (i.e., only 16 individuals), thus rendering the results prone to biases. The majority of the scans were performed in an era when no immunomodulatory drugs were available. Some patients, however, were imaged slightly later than this era and were the ones who voluntarily preferred not to be treated. Inevitably, this results in a poor clinical characterization of the study cohort and further contributes to weaken the generalization power of our study.
All the above-mentioned factors warrant further investigations in larger cohorts of patients with MS imaged with postcontrast MRI acquired at different time points and with different sequence types to confirm our findings and to rule out the possibility that rCELs have a worse outcome over time.
AUTHOR CONTRIBUTIONS
Statistical analysis was conducted by Dr. Sungyoung Auh.
ACKNOWLEDGMENT
The authors thank Mary Ehrmantraut and Roger Stone for database maintenance and the patients for the time and cooperation required to participate in the study.
DISCLOSURE
Mr. Davis, Dr. Auh, Dr. Riva, Dr. Richert, and Dr. Frank report no disclosures. Dr. McFarland serves on a scientific advisory board for the Cumming Foundation; holds and receives royalties from the NIH for Patent 11/578,207 issued 2009: Daclizumab; has received honoraria from Teva Pharmaceutical Industries Ltd.; and receives research support from the NIH (intramural program). Dr. Bagnato reports no disclosures.
Supplementary Material
Address correspondence and reprint requests to Dr. Francesca Bagnato, NIB–National Institute of Neurological Disorders and Stroke–NIH Building 10, Room 5C103, 10 Center Drive, Bethesda, MD, 20892-1400 bagnatof@ninds.nih.gov
Supplemental data at www.neurology.org
Study funding: Supported by the Intramural Research Program of the NINDS, NIH.
Disclosure: Author disclosures are provided at the end of the article.
Received July 16, 2009. Accepted in final form November 24, 2009.
REFERENCES
- 1.Grossman RI, Gonzalez-Scarano F, Atlas SW, Galetta S, Silberberg DH. Multiple sclerosis: gadolinium enhancement in MR imaging. Radiology 1986;161:721–725. [DOI] [PubMed] [Google Scholar]
- 2.Bastianello S, Pozzilli C, Bernardi S, et al. Serial study of gadolinium-DTPA MRI enhancement in multiple sclerosis. Neurology 1990;40:591–595. [DOI] [PubMed] [Google Scholar]
- 3.Hawkins CP, Munro PM, MacKenzie F, et al. Duration and selectivity of blood-brain barrier breakdown in chronic relapsing experimental allergic encephalomyelitis studied by gadolinium-DTPA and protein markers. Brain 1990;113:365–378. [DOI] [PubMed] [Google Scholar]
- 4.Kermode AG, Thompson AJ, Tofts P, et al. Breakdown of the blood-brain barrier precedes symptoms and other MRI signs of new lesions in multiple sclerosis. Pathogenetic and clinical implications Brain 1990;113:1477–1489. [DOI] [PubMed] [Google Scholar]
- 5.Harris JO, Frank JA, Patronas N, McFarlin DE, McFarland HF. Serial gadolinium-enhanced magnetic resonance imaging scans in patients with early, relapsing-remitting multiple sclerosis: implications for clinical trials and natural history. Ann Neurol 1991;29:548–555. [DOI] [PubMed] [Google Scholar]
- 6.Miller DH, Barkhof F, Nauta JJ. Gadolinium enhancement increases the sensitivity of MRI in detecting disease activity in multiple sclerosis. Brain 1993;116:1077–1094. [DOI] [PubMed] [Google Scholar]
- 7.Stone LA, Frank JA, Albert PS, et al. The effect of interferon-beta on blood-brain barrier disruptions demonstrated by contrast-enhanced magnetic resonance imaging in relapsing-remitting multiple sclerosis. Ann Neurol 1995;37:611–619. [DOI] [PubMed] [Google Scholar]
- 8.Bruck W, Bitsch A, Kolenda H, Bruck Y, Stiefel M, Lassmann H. Inflammatory central nervous system demyelination: correlation of magnetic resonance imaging findings with lesion pathology. Ann Neurol 1997;42:783–793. [DOI] [PubMed] [Google Scholar]
- 9.Lucchinetti C, Bruck W, Parisi J, Scheithauer B, Rodriguez M, Lassmann H. Heterogeneity of multiple sclerosis lesions: implications for the pathogenesis of demyelination. Ann Neurol 2000;47:707–717. [DOI] [PubMed] [Google Scholar]
- 10.Lassmann H. The pathologic substrate of magnetic resonance alterations in multiple sclerosis. Neuroimaging Clin N Am 2008;18:563–576. [DOI] [PubMed] [Google Scholar]
- 11.Guttmann CR, Ahn SS, Hsu L, Kikinis R, Jolesz FA. The evolution of multiple sclerosis lesions on serial MR. AJNR Am J Neuroradiol 1995;16:1481–1491. [PMC free article] [PubMed] [Google Scholar]
- 12.Hiehle JF, Grossman RI, Ramer KN, Gonzalez-Scarano F, Cohen JA. Magnetization transfer effects in MR-detected multiple sclerosis lesions: comparison with gadolinium-enhanced spin-echo images and nonenhanced T1-weighted images. AJNR Am J Neuroradiol 1995;16:69–77. [PMC free article] [PubMed] [Google Scholar]
- 13.Petrella JR, Grossman RI, McGowan JC, Campbell G, Cohen JA. Multiple sclerosis lesions: relationship between MR enhancement pattern and magnetization transfer effect. AJNR Am J Neuroradiol 1996;17:1041–1049. [PMC free article] [PubMed] [Google Scholar]
- 14.Rovira A, Alonso J, Cucurella G, et al. Evolution of multiple sclerosis lesions on serial contrast-enhancing T1-weighted and magnetization-transfer MR images. AJNR Am J Neuroradiol 1999;20:1939–1945. [PMC free article] [PubMed] [Google Scholar]
- 15.van Waesberghe JH, van Walderveen MA, Castelijns JA, et al. Patterns of lesion development in multiple sclerosis: longitudinal observations with T1-weighted spin-echo and magnetization transfer MR. AJNR Am J Neuroradiol 1998;19:675–683. [PMC free article] [PubMed] [Google Scholar]
- 16.Morgen K, Jeffries NO, Stone R, et al. Ring-enhancement in multiple sclerosis: marker of disease severity. Mult Scler 2001;7:167–171. [DOI] [PubMed] [Google Scholar]
- 17.Zivadinov R, Bagnato F, Nasuelli D, et al. Short-term brain atrophy changes in relapsing-remitting multiple sclerosis. J Neurol Sci 2004;223:185–193. [DOI] [PubMed] [Google Scholar]
- 18.Leist TP, Gobbini MI, Frank JA, McFarland HF. Enhancing magnetic resonance imaging lesions and cerebral atrophy in patients with relapsing multiple sclerosis. Arch Neurol 2001;58:57–60. [DOI] [PubMed] [Google Scholar]
- 19.Poser CM, Paty DW, Scheinberg L, et al. New diagnostic criteria for multiple sclerosis: guidelines for research protocols. Ann Neurol 1983;13:227–231. [DOI] [PubMed] [Google Scholar]
- 20.Kurtzke JF. Rating neurologic impairment in multiple sclerosis: an expanded disability status scale (EDSS). Neurology 1983;33:1444–1452. [DOI] [PubMed] [Google Scholar]
- 21.Panitch H, Goodin DS, Francis G, et al. Randomized, comparative study of interferon beta-1a treatment regimes in MS: The Evidence Trial. Neurology 2002;59:1496–1506. [DOI] [PubMed] [Google Scholar]
- 22.Leary SM, Miller DH, Stevenson VL, Brex PA, Chard DT, Thompson AJ. Interferon beta-1a in a primary progressive MS: an explanatory, randomized, controlled trial. Neurology 2003;60:44–51. [DOI] [PubMed] [Google Scholar]
- 23.Chiu AW, Ehrmantraut M, Richert ND, et al. A case study on the effect of neutralizing antibodies to interferon beta 1b in multiple sclerosis patients followed for 3 years with monthly imaging. Clin Exp Immunol 2007;150:61–67. [DOI] [PMC free article] [PubMed] [Google Scholar]
- 24.Gupta S, Solomon JM, Tasciyan TA, et al. Interferon-beta-1b effects on re-enhancing lesions in patients with multiple sclerosis. Mult Scler 2005;11:658–668. [DOI] [PubMed] [Google Scholar]
- 25.Bagnato F, Jeffries N, Richert ND, et al. Evolution of T1 black holes in patients with multiple sclerosis imaged monthly for 4 years. Brain 2003;126:1782–1789. [DOI] [PubMed] [Google Scholar]
- 26.Bagnato F, Butman J, Mora C, et al. Conventional magnetic resonance imaging features in patients with tropical spastic paraparesis. J Neurovirol 2005;11:525– 534. [DOI] [PubMed] [Google Scholar]
- 27.van den Elskamp IJ, Lembcke J, Dattola V, et al. Persistent T1 hypointensity as an MRI marker for treatment efficacy in multiple sclerosis. Mult Scler 2008;14:764–769. [DOI] [PubMed] [Google Scholar]
Associated Data
This section collects any data citations, data availability statements, or supplementary materials included in this article.