

Abstract
It has been shown in several animal models that HIV infection of accessory cells (ACs) plays an important role in development of AIDS. Here, we report that ACs treated with HIV-1 Tat protein (Tat-ACs) have a decreased ability to organize cellular aggregates as compared with untreated ACs, resulting in incomplete activation of T cells in responses to anti-CD3 mAb or staphylococcal enterotoxin B stimulation. The T cells failed to up-regulate adhesion molecules CD11a and CD2 on the cell surface and had reduced proliferative responses, as determined by [3H]thymidine incorporation, but they obtained lymphoblast-like morphology and expressed early activation antigens on the cell surface such as Fas and CD69 and interleukin 2 receptor, at comparable levels as those T cells undergoing a maximal proliferation. These results suggest that the Tat-AC-induced defect occurs in the late, but not in the early, phases of T cell activation. Normal expression of cell surface Fas antigen accompanied by defects in late activation thus may result in the susceptibility of these T cells to apoptosis. Our studies suggest that dysfunction, hyperactivation, and susceptibility to apoptosis, as observed with T cells isolated from HIV-infected individuals, may be, at least in part, a consequence of abnormal functions of ACs.
T cells, including both CD4+ and CD8+ cells, isolated from HIV-infected individuals show several abnormalities, even in the asymptomatic phase of the disease, when the number of CD4+ cells is still normal and virion titer is low (from 1 in 1,000 to 1 in 10,000) (1–3). For instance, the ability of T cells to recognize and respond to soluble antigen in vitro is defective, and they also show spontaneous lymphocyte proliferation, expression of activation antigens, lymph node hyperplasia, and increased cytokine secretion, suggesting that the T cells are activated (4, 5). In addition, these same T cells are susceptible to apoptosis when cultured in vitro or upon activation (4).
Unlike humans, chimpanzees infected by HIV demonstrate neither the cellular or functional abnormalities of T cells, nor do they develop AIDS (5). A major distinguishing feature differentiating viral infection in humans and chimpanzees is that in the human, HIV infects not only CD4+ cells, but also accessory cells (ACs), consisting of dentritic cells and monocytes/macrophages (Mo/Mø). A role for infected ACs in the pathogenesis of AIDS was demonstrated by using animal models (6). In vivo studies of severe combined immunodeficient mice implanted with human peripheral blood lymphocytes have revealed that the characteristic loss of CD4+ T cells is observed only in animals infected by noncytopathic macrophage-tropic HIV strains, but not by T cell-tropic viral strains (7). Simian immunodeficiency virus, similar to HIV, but only infectious in primate, causes immunodeficiency and death of macaques, whereas a mutant of this virus that does not infect macrophages, fails to cause the disease (see review, ref. 8).
A role for the HIV-1 transactivator protein, Tat, has been implicated in the induction of T cell dysfunction (9), apoptosis (10, 11), as well as hyperactivation (12). In our previous studies, we have shown that activated ACs can suppress mitogen-stimulated T cell proliferative responses by induction of programmed cell death (13, 14). Because treatment of primary ACs with HIV-1 Tat protein could mimic many properties of HIV-infected ACs (15), we evaluated the effect of Tat-ACs on the proliferation and apoptotic cell death of normal peripheral blood T (PBT) cells.
MATERIALS AND METHODS
HIV-1 Tat Protein.
Recombinant HIV-1 Tat protein (rTat) was purified from E. coli strain M15:pDMI.1 expressing Tat protein (amino acid residues 1–86), which was a kind gift from M. M. Lederman (Case Western Reserve University School of Medicine, Cleveland) (16). The expressed rTat protein containing six consecutive histidine residues at the N terminus was first affinity purified by metal chelate chromatography under denaturing conditions (17) and then further purified by HPLC (18). The purified rTat protein was aliquoted and stored at −80°C. Its concentration and amino acid composition were determined by amino acid analysis. Before use, it was dissolved [0.01 mM DTT and 0.01% BSA protein in endotoxin-free water (Sigma)]. Endotoxin level in the rTat preparation was examined by endocell kit (Promega) and was <1 ng/mg protein.
Antibody Reagents.
Anti-CD14 (MY-4) with or without fluorescein isothiocyanate (FITC)-conjugation, FITC-conjugated anti-CD2 (T11-FITC), phycoerythrin-conjugated anti-CD5 (T1-RD1), FITC-conjugated anti-CD25 (IL2R-1-FITC), FITC-conjugated anti-HLA-D/DR (I2-FITC), and control nonimmune mouse IgG (MsIgG)-FITC and MsIgG-RD1 mAbs were obtained from Coulter. mAbs against CD20, CD16, and CD56 were used as diluted ascites. Neutralization antibodies against human IL-10, TGF-β, and IFN-γ were purchased from R & D Systems. Anti-CD69 and anti-CD86 (B7.2) mAbs were obtained from Sigma or PharMingen, respectively. The mAbs directed against CD11a (G-25.2, IgG2a, donated by N. L. Warner, Becton Dickinson) and CD95 (Fas, 7C11, donated by M. Robertson and J. Ritz, Dana–Farber Cancer Institute, Boston) were kindly provided by the Fifth International Workshop and Conference on Human Leukocyte Differentiation Antigens (19).
Cells.
Adherent cells, consisting of dendritic cells and Mo/Mø, were isolated from E rosette− cells by plastic adherent technique. These adherent cells were used as ACs and cultured with 2 ml per well of serum-free medium (AIM-V Medium, GIBCO) with an addition of 1 μM of rTat protein, dissolving buffer alone, or none in six-well plate for 4 days at 37°C. The resulting ACs were designated here as Tat-ACs, Tc-ACs, or C-ACs, respectively. In some cases ACs were treated with rTat protein or lipopolysaccharide (Lps) at indicated concentrations. PBT cells were purified from nonadherent cells derived from peripheral blood mononuclear cells as described (13).
Assay for Proliferation of T Cell.
To stimulate PBT cells with immobilized anti-CD3 mAb, plates (96-well, flat-bottom, Costar) were coated with 10 μg/ml of anti-CD3 mAbs for overnight at 4°C and washed with PBS three times. PBT cells then were seeded at 1 × 10⁵ cells per well into the anti-CD3 mAb-coated plate and incubated in culture medium either alone or together with varying numbers of Tat-ACs, Tc-ACs, Lps-ACs, or C-ACs, for 4 days at 37°C with 5% CO2. For staphylococcal enterotoxin B (SEB) stimulation, PBT cells were added at 5 × 10⁴ cells per well in 96-well, flat-bottom plates either alone or together with varying numbers of ACs treated as above and incubated in culture medium containing 2 μg/ml of SEB for 3 days at 37°C with 5% CO2. The anti-CD3 mAb- or SEB-stimulated cultures were then pulsed with 1 μCi (1 Ci = 37 GBq) per well of [3H]thymidine (3H-TdR) (New England Nuclear) for 16 hr. Incorporated radioactivity was determined by using a Betaplate reader (Pharmacia). Microphotographs were taken at day 3 by an inverted microscopy conjugated with camera (Nikon). In some experiments, rIL-2 (Biogen), or neutralization antibodies against IL-10, transforming growth factor-β, or interferon-γ were added to the cultures at initiation.
Quantification of Apoptosis.
PBT cells were seeded at 1 × 10⁶ cells per well in a 24-well plate (Costar) that previously was coated with anti-CD3 mAb. After 20 min at room temperature, varying amounts of ACs were added to the plate, and the cells were incubated at 37°C with 5% CO2. At day 4, cells were removed, washed once with hs-PBS buffer (3% human AB serum in PBS), and stained with propidium iodide (PI) solution (50 μg of PI in 0.1% sodium citrate plus 0.1% Triton X-100) overnight at 4°C. DNA contents of the stained cells were analyzed by flow cytometry. Quantification of apoptotic cells in the T cell population or ACs was performed by using an Epics Elite flow cytometer (Coulter) as described (14). All fluorescent signals were recorded on a logarithmic scale and analyzed with Epics Elite software.
Cell Surface Staining and Flow Cytometric Analysis.
Cells (5 × 10⁵) to be analyzed were collected, washed, and stained for 30 min at 4°C with saturating concentrations of indicated mAbs, FITC-conjugated mAbs, or isotype-matched control antibodies by either direct or indirect fluorescent staining protocols (14).
RESULTS
Inhibition of T Cell Proliferation by HIV-1 Tat Protein-Activated ACs.
When treated with HIV-1 rTat protein for 4 days, ACs (Tat-ACs) expressed slightly increased levels of cell surface molecules such as HLA class II molecule (HLA-DR) and CD16 as compared with C-ACs, showing signs of cell activation (Fig. 1). At a low percentage (8%), Tat-ACs supported a maximal proliferation of anti-CD3-stimulated T cells, as determined by 3H-TdR incorporation, as equally well as, or even better than, untreated ACs, Tc- or C-ACs (see Materials and Methods) (Fig. 2A), suggesting that Tat protein has little effect on ACs regarding costimulatory function. This was in agreement with the observation that Tat-ACs expressed cell surface antigens like B7.2 and HLA-DR, both required for delivering costimulatory signals for T cell proliferation, at levels comparable to C-, or Tc-ACs (Fig. 1). However, when ACs were increased to 28% in the cultures, a percentage that reflects the amount of ACs normally present in peripheral blood mononuclear cells, Tat-ACs inhibited T cell proliferation by 58% as compared with the maximum, whereas Tc-AC-mediated inhibition was only 13% and C-ACs had no discernible effects (Fig. 2A). Such inhibitory effect of ACs on T cell proliferation was related specifically to treatment with rTat protein and was dose-dependent. When treated with a higher concentration of rTat protein (1 μM), AC-induced inhibition was stronger than those ACs treated with lower concentrations of Tat protein (0.5 or 0.1 μm) (58% vs. 29% or 6%) (Fig. 2A). In contrast to Tat-ACs, ACs treated with Lps, another known activator of Mo/Mø, showed a decreased ability to support proliferation of anti-CD3 mAb-stimulated T cells at a low percentage (8%) as compared with control ACs. However, the proliferation could be increased with an increasing number (28%) of Lps-ACs (Fig. 2D).
Figure 1.
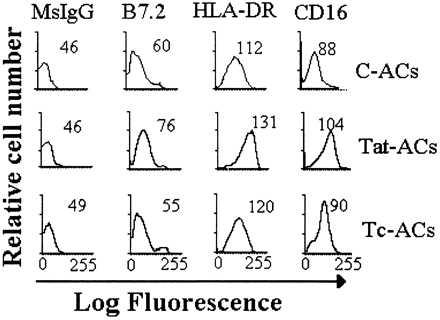
Flow cytometric analysis of cell surface antigens of ACs. ACs were cultured for 4 days in either the presence or absence of 1 μM Tat protein and then stained with indirect immunofluorescence by using control mouse mAb (MsIgG) or mAbs against B7.2, HLA-DR, or CD16 antigens. The numbers represent the mean fluorescent intensity for analysis of 10,000 events.
Figure 2.
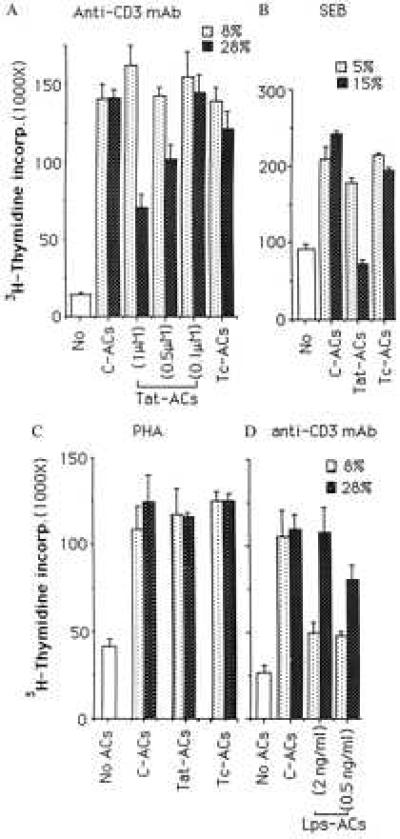
Effects of ACs on 3H-TdR incorporation by PBT cells stimulated with immobilized anti-CD3 mAb (A and D), SEB (B), or phytohemagglutinin (C). PBT cells were cultured in the absence (No) or presence of indicated percentages of C-ACs, Tat-ACs, Lps-ACs, or Tc-ACs. The 3H-TdR incorporation is expressed as the mean cpm of triplicate cultures and the vertical bars represent standard derivation of the mean (n = 3). Concentrations of either rTat protein or Lps used to treat ACs are indicated inside parentheses otherwise 1 μM of Tat protein is used. A representative experiment of five (A), three (B), or two (C and D) performed is shown.
Tat-ACs induced a similar inhibitory effect on proliferation of T cells stimulated with SEB superantigen. As shown in Fig. 2B, inclusion of 15% of Tat-ACs, which was about three times the number of normal ACs needed for a maximal proliferation of SEB-stimulated T cells, resulted in a decrease in T cell proliferation by 56% relative to the maximum. Under similar conditions, the effect of untreated ACs was either weak or little. The result excludes the possibility that anti-CD3 mAb may mediate some form of antibody-dependent cytotoxicity by Tat-ACs against antibody-bound T cells. In addition, like Tat protein itself (9), Tat-ACs did not inhibit phytohemagglutinin-induced proliferation of T cells under the conditions tested (Fig. 2C).
To rule out the possibility that the inhibitory effect of a high percentage of Tat-ACs on anti-CD3 mAb- or SEB-induced T cell proliferation might be because of a shift in the kinetics of T cell proliferation, we measured 3H-TdR incorporation on a daily basis. It was found that anti-CD3 mAb-induced proliferative response of T cells was persistently suppressed by a high percentage of Tat-ACs over the entire period of the response (Fig. 3). Similar results also were obtained with respect to SEB-induced T cell proliferation (data not shown).
Figure 3.
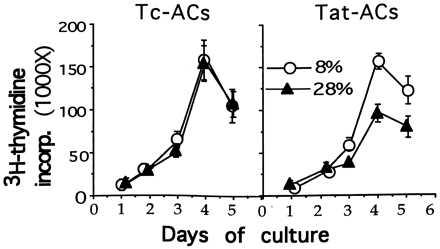
A kinetic study of PBT cell proliferation induced by stimulation with immobilized anti-CD3 mAb in the presence of either 8% or 28% of ACs treated as in Fig. 1. The cocultures were set up and results are expressed as Fig. 2 except for pulsing with 3H-TdR for 16 hr every day for total of 5 days.
A Decrease in Formation of Cellular Aggregates.
In response to immobilized anti-CD3 mAb stimulation, T cells alone could not form cellular aggregates (Fig. 4E). They formed discrete, multiple cellular aggregates only when small numbers of Tc-ACs (8%) were present in cultures (Fig. 4A). The effect of ACs on cellular aggregate formation appeared not to be enhanced proportionally to the increasing numbers of ACs in cultures because T cells and ACs formed smaller cellular aggregates when the percentage of Tc-ACs increased to 28% (Fig. 4B). Similar to Tc-ACs, the degree of cellular aggregates also was decreased with an increasing percentage of Tat-ACs. However, because cellular aggregates generated in the presence of 8% of Tat-ACs were smaller than those in the presence of 8% Tc-ACs (Fig. 4 C vs. A) and were in fact comparable to cellular aggregates observed with 28% of Tc-ACs present in cultures ( Fig. 4 C vs. B), an additional increase of Tat-ACs to 28% gave rise to few cellular aggregates (Fig. 4D). Interestingly, despite a failure to form cellular aggregates in the presence of a relatively higher percentage of Tat-ACs, microscopic examination revealed morphologic features resembling T cell blasts. The T cells were larger in size when compared with unstimulated T cells (Fig. 4 D vs. F) or T cells stimulated in the absence of ACs, suggesting that the T cells had been activated. The morphologic impression was confirmed by flow cytometric analysis of characteristic cell surface antigens. The T cells expressed CD25 (IL-2 receptor), CD69, and CD95 (Fas) molecules on the cell surface at levels similar to those T cells undergoing maximal proliferation (Fig. 5). Unlike normally activated T cells, however, the unclustered T cells stimulated in the presence of 28% of Tat-ACs had lower levels of adhesion molecules CD11a and CD2 on their cell surfaces (Fig. 5).
Figure 4.
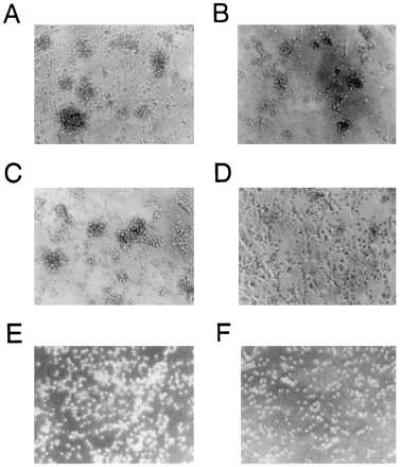
Effect of Tat-ACs on formation of discrete cellular aggregates in T cell cultures stimulated with immobilized anti-CD3 mAb. PBT cells were stimulated for 3 days at 37°C in the presence of either 8% (A and C) or 28% (B and D) of Tc-ACs (A and B) or Tat-ACs (C and D). (F and E) PBT cells cultured in culture medium or PBT cells stimulated with immobilized anti-CD3 mAb in the absence of ACs, respectively. Magnification of cells is about 200 times. Note: few cellular aggregates were formed in the culture containing 28% of Tat-ACs.
Figure 5.
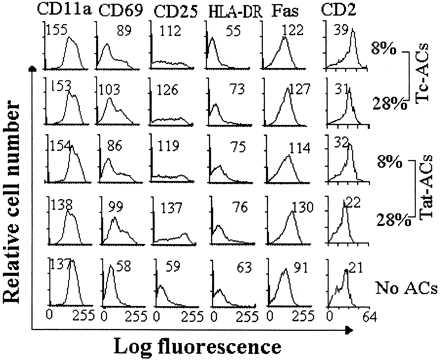
Surface expression of activated antigens on PBT cells stimulated with immobilized anti-CD3 mAb in the presence of ACs. PBT cells were stimulated in the presence of indicated percentages of C-ACs, Tat-ACs, or Tc-ACs prepared as in Fig. 1. After incubation for 4 days at 37°C, the cells were stained by indicated mAbs. The mean fluorescent intensity for analysis of 10,000 events on T cell gate of each sample is indicated. Fluorescent profiles of PBT cells stimulated by immobilized anti-CD3 mAb in the absence of ACs are shown as controls.
Susceptibility to Apoptotic Cell Death.
We next questioned whether the unclustered, but partially activated, T cells were susceptible to apoptotic cell death. PI staining revealed a high degree of apoptotic T cell death (subG1 population) (12.7% vs. 1.7%) induced by 28% of Tat-ACs in the anti-CD3 mAb-stimulated cultures and virtually no apoptotic T cell death over the background was found in the presence of either 8 or 28% of C-, or Tc-ACs as well as in the presence of 8% of Tat-ACs (Fig. 6A). Among 10 donors tested, despite the variation in the percentages of T cell death among different individuals, similar differences (≥10%) in T cell apoptosis were observed with T cells obtained from five different donors. However, in three of the donors, the difference was <10% and in these cases the T cells underwent apoptosis even in the presence of untreated ACs. T cells from two of the donors did not undergo significant apoptosis under this treatment.
Figure 6.
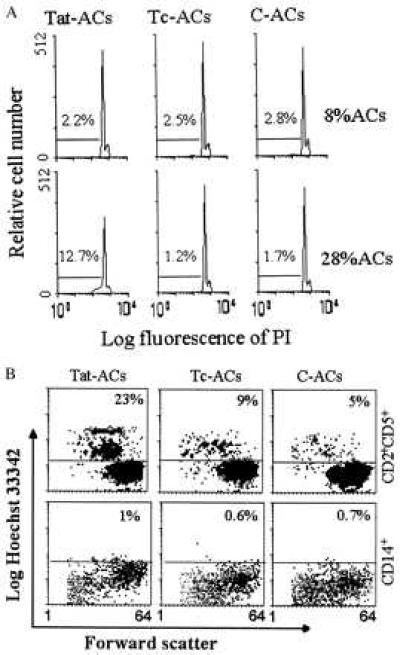
PI (A) and Hoechst (B) staining of apoptotic cell death in PBT cells stimulated with immobilized anti-CD3 mAb in the presence of ACs. (A) PBT cells were stimulated for 4 days at 37°C in the presence of either 8% or 28% of Tat-ACs, Tc-ACs or C-ACs, after which the cells were stained by PI and DNA contents were examined by flow cytometry. The percentages of cells identified as apoptotic cells (subG1 cell population) are indicated. (B) PBT cells were stimulated for 4 days at 37°C in the presence of 28% of indicated ACs, after which the cells were stained with FITC-conjugated anti-CD2 mAb plus phycoerythrin-conjugated anti-CD5 mAb, or with FITC-conjugated anti-CD14 mAb alone, followed by Hoechst staining. The percentages denote Hobright cells within CD2+CD5+ or CD14+ cell population.
Although the cells shown in Fig. 6A were gated on the T cell population by forward scatter based on cell size, it was quite possible that Tat-ACs might contribute to the apoptotic cell population, especially when they were present at a relatively high percentage. To rule out this possibility, analysis of apoptotic cells specifically present in the T cell population was next carried out by a method described previously (14). Because anti-CD3 mAb was used to stimulate T cells, we used CD5 and CD2, instead of CD3, as markers for T cells in this experiment. About 23% of anti-CD3 mAb-stimulated T cells underwent apoptotic cell death when cocultured with 28% Tat-ACs, which was significantly higher than that (≤9%) obtained in the presence of the same numbers of C- or Tc-ACs (Fig. 6B). When gated on ACs by CD14-FITC, Tat-ACs showed Ho staining slightly brighter than Tc- or C-ACs. However, these cells did not undergo apoptotic cell death, as they did not become smaller in size when compared with normal ACs cells. The contrast between ACs and T cells is shown in Fig. 6B, where apoptotic T cells are characterized by being relatively smaller in size and staining brighter with Ho as compared with live T cells.
DISCUSSION
As with HIV-1 Tat protein, Tat protein-activated ACs inhibited anti-CD3 mAb- or SEB-stimulated proliferative responses, as demonstrated by decline in 3H-TdR incorporation, but did not affect phytohemagglutinin-induced responses. The similarity underscored the importance of ACs in Tat protein-induced immunosuppression. Unfortunately, we were unable to determine the effect of Tat-ACs on the proliferative response of T cells to soluble tetanus toxoid antigen using this system, because 4-day cultured normal ACs (2–8%) failed to support an optimal proliferation of tetanus toxoid antigen-stimulated T cells, while in the parallel experiments, tetanus toxoid antigen-induced proliferation could be detected in the same peripheral blood mononuclear cells. But, utilization of immobilized anti-CD3 mAb to stimulate T cells is a widely accepted model to mimic the signaling delivered through T cell receptors, irrespective of the ability of ACs to process and present antigen. Therefore, our results indicate that Tat-AC-induced inhibition occurs independent of antigen processing and presentation by ACs.
Although the T cells proliferated poorly in response to anti-CD3 mAb stimulation in the presence of 28% of T-ACs, they did become large and express elevated levels of IL-2R, Fas, and CD69 on the cell surfaces, suggesting that they were truly activated. Because activation and enlargement of T cells, but failure of proliferation secondary to inability to produce IL-2 are characteristics of T cell anergy, we added human recombinant IL-2 at concentrations of 50–200 units/ml to our cultures containing unclustered, but partially activated T cells. The addition of IL-2 could not restore the T cell proliferation (data not shown), thereby distinguishing Tat-AC-induced inhibition from T cell anergy. Our finding that a high percentage of Tat-ACs results in anti-CD3 mAb-stimulated T cells attaining blast-like morphology and an activated phenotype, but a decreased ability to proliferate suggests that Tat-ACs interrupt a late, rather than an early, phase of T cell activation. This greatly contrasted with the early defect in activation of T cells cocultured with Lps-treated Mo/Mø (20), which could be compensated by increasing the number of ACs or addition of IL-2 (21). The lack of impairment of early events in T cell activation, including calcium flux and phosphotyrosine kinase activity, was observed in the T cells cocultured with HIV-infected ACs (22) or T cells isolated from HIV-infected individuals (1, 23), suggesting a similar alteration with respect to accessory function of Tat-ACs and HIV-infected ACs. The partial activation of T cells is believed to be a critical factor for the maintenance of the infectious status, as HIV cannot infect resting T cells.
In HIV-infected individuals, circulating levels of Tat protein are very low (<2.5 nM/ml) and it is unlikely that it directly affects ACs. However, because of active infection of ACs by macrophage-tropic virus and/or phagocytosis of HIV-infected cells, the amount of Tat in ACs could be significant, especially in the microenvironment of lymph nodes where lymphocytes are productively infected by HIV (24–26). This argument is favored by the fact that activated ACs, as shown by the up-regulation of the HLA class II molecules, are present in lymph nodes in HIV-infected, but not in uninfected individuals. Indeed, recent studies of apoptosis in lymph nodes reveal that the general intensity of apoptosis correlates with degrees of follicular hyperplasia, a reflection of activation, and is significantly higher in lymph node sections obtained from HIV infected individuals than from HIV-negative patients (27). The correlation between activation and intensity of apoptosis is also true for the peripheral lymphocytes from HIV-infected individuals (28).
Our data showed that low percentages of Tat-ACs supported optimal proliferation of T cells, but that high percentages of Tat-ACs did not. Moreover, Tat-ACs did not lack conventional costimulatory structures given that both Tat-ACs and C-ACs expressed similar levels of cell surface B7.2 and HLA-DR molecules. Tat-AC-induced inhibition was also unlikely to involve some known soluble suppressers because neutralizing antibodies against several inhibitors of T cell proliferation, including transforming growth factor-β, interferon-γ, IL-10, tumor necrosis factor-α, were unable to restore the proliferation of T cells when tested at concentrations of 5–50 μg/ml (data not shown).
The reduced proliferation of T cells may result from a decrease in formation of cellular aggregates. T cells have great ability to form clusters with normal AC cells, which are essential for T cell receptor-ligation- or mitogen-induced proliferative response. Although we have demonstrated that the unclustered, partially activated T cells fail to up-regulate CD11a and CD2 on the cell surfaces, it is not clear at this point whether this is the cause or the consequence of their inability to form “optimal sized” clusters in the presence of 28% of Tat-ACs.
In addition to adhesion molecules, at least two other factors, including the ratio of T cells to ACs and the ability of ACs to recruit T cells into the discrete cellular aggregates, also may play a crucial role in formation of T-AC cell aggregates. When 8–28% of Tc-ACs were added to anti-CD3-stimulated T cell cultures, no significant difference in thymidine incorporation was measured although smaller cellular aggregates were seen in the presence of higher percent of Tc-ACs. It appeared that these ratios were still within the optimal range for T cell proliferation. In contrast, the optimal ratio range of T cells to Tat-ACs was not as wide as using Tc-ACs. Twenty eight percent of Tat-ACs in the T cell cultures was clearly not in the optimal range, as measured by a reduced proliferation and few cellular aggregates. HIV-1 Tat protein has been reported to facilitate differentiation of Mo into tissue macrophage-like cells that may have less ability to form cellular clusters with T cells as compared with freshly isolated Mo and dendritic cells (14). Moreover, a subpopulation of CD14low CD16high Mo resembling tissue Mø was found to be expanded from <5% in the healthy donors, to 40% in the HIV-infected individuals of the total circulating monocyte cell population (29). An increased level of CD16 on Tat-ACs was shown in Fig. 1, but no decrease in the level of CD14 was found, perhaps suggesting an early differentiation of Tat-ACs into tissue macrophage-like cells. These findings suggest that Tat-induced abnormal differentiation of Mo may result in a low degree of cellular aggregation.
The studies reported above suggest a relationship between infection of ACs and induction of abnormalities in T cells, which is consistent with animal models of AIDS and should provide additional strategies for effective HIV vaccine design.
Acknowledgments
We thank Dr. M. M. Lederman for his kind gift of HIV-1 Tat protein-expressing E. coli, Drs. P. Anderson and P. Kanteti for their discussion and critical reading of the manuscript, Z. Ao for his help, and H. Levine for his assistance in flow cytometric analysis. We appreciate the panel mAbs from the Fifth International Conference on Human Leukocyte Differentiation Antigens. This work was supported by National Institutes of Health Grants p30AI28691 (to M.X.W), AI12069 (to S.F.S), and CA-34183 (to S.F.S).
ABBREVIATIONS
- AC
accessory cell
- Mo/Mø
monocytes/macrophages
- PBT cells
peripheral blood T cells
- rTat
recombinant Tat
- FITC
fluorescein isothiocyanate
- IL
interleukin
- SEB
staphylococcal endotoxin B
- Lps
lipopolysaccharide
- 3H-Tdr
[3H]-thymidine
- PI
propidium iodide
References
- 1.van Noesel C J, Gruters R A, Terpstra F G, Schellekens P T, van Lier R A, Miedema F. J Clin Invest. 1990;86:293–299. doi: 10.1172/JCI114698. [DOI] [PMC free article] [PubMed] [Google Scholar]
- 2.Shearer G M, Bernstein D C, Tung K S, Via C S, Redfield R, Salahuddin S Z, Gallo R C. J Immunol. 1986;137:2514–2521. [PubMed] [Google Scholar]
- 3.Clerici M, Stocks N I, Zajac R A, Boswell R N, Lucey D R, Via C S, Shearer G M. J Clin Invest. 1989;84:1892–1899. doi: 10.1172/JCI114376. [DOI] [PMC free article] [PubMed] [Google Scholar]
- 4.Meyaard L, Otto S A, Jonker R R, Mijnster M J, Keet R P M, Miedema F. Science. 1992;257:217–219. doi: 10.1126/science.1352911. [DOI] [PubMed] [Google Scholar]
- 5.Schuitemaker H, Meyaard L, Lootstra N A, Otto S A, Dubbes R, Tersmette M, Heeney J L, Miedema F. J Infect Dis. 1993;168:1190–1197. doi: 10.1093/infdis/168.5.1140. [DOI] [PubMed] [Google Scholar]
- 6.Mosier D, Sieburg H. Immunol Today. 1994;15:332–339. doi: 10.1016/0167-5699(94)90081-7. [DOI] [PubMed] [Google Scholar]
- 7.Mosier D E, Gulizia R J, MacIsaac P D, Torbett B E, Levy J A. Science. 1993;260:689–692. doi: 10.1126/science.8097595. [DOI] [PubMed] [Google Scholar]
- 8.Balter M. Science. 1996;274:1464–1465. doi: 10.1126/science.274.5292.1464. [DOI] [PubMed] [Google Scholar]
- 9.Viscidi R P, Mayur K, Lederman H M, Frankel A D. Science. 1989;246:1606–1608. doi: 10.1126/science.2556795. [DOI] [PubMed] [Google Scholar]
- 10.Li C J, Friedman D J, Wang C, Metelev V, Pardee A B. Science. 1995;268:429–431. doi: 10.1126/science.7716549. [DOI] [PubMed] [Google Scholar]
- 11.Westendorp M O, Frank R, Ochsenbauer C, Stricker K, Dhein J, Walczak H, Debatin K-M, Krammer P H. Nature (London) 1995;375:497–500. doi: 10.1038/375497a0. [DOI] [PubMed] [Google Scholar]
- 12.Ott M, Emiliani S, Lint C V, Herbein G, Lovett J, Chirmule N, McCloskey T, Pahwa S, Verdin E. Science. 1997;275:1481–1485. doi: 10.1126/science.275.5305.1481. [DOI] [PubMed] [Google Scholar]
- 13.Wu M X, Daley J F, Rasmussen R A, Schlossman S F. Proc Natl Acad Sci USA. 1995;92:1525–1529. doi: 10.1073/pnas.92.5.1525. [DOI] [PMC free article] [PubMed] [Google Scholar]
- 14.Wu M X, Ao Z, Daley J F, Schlossman S F. J Immunol Methods. 1997;206:153–162. doi: 10.1016/s0022-1759(97)00105-1. [DOI] [PubMed] [Google Scholar]
- 15.Lafrenie R M, Wahl L M, Epstein J S, Hewlett I K, Yamada K M, Dhawan S. J Immunol. 1996;156:1638–1645. [PubMed] [Google Scholar]
- 16.Patki A H, Lederman M M. Cell Immunol. 1996;169:40–46. doi: 10.1006/cimm.1996.0088. [DOI] [PubMed] [Google Scholar]
- 17.Purvis S F, Jacobberger J W, Sramkoski R M, Patki A H, Lederman M M. AIDS Res Hum Retroviruses. 1995;11:443–450. doi: 10.1089/aid.1995.11.443. [DOI] [PubMed] [Google Scholar]
- 18.Gutheil W G, Subramanyam M, Flentke G R, Sanford D G, Munoz E, Huber B T, Bachovchin W W. Proc Natl Acad Sci USA. 1994;91:6594–6598. doi: 10.1073/pnas.91.14.6594. [DOI] [PMC free article] [PubMed] [Google Scholar]
- 19.Schlossman S F, Boumsell L, Harlow J M, Kishimoto T, Morimoto C, Ritz J, Shaw S, Silverstein R L, Springer T A, Tedder T F, Todd R F. Leucocyte Typing V: White Cell Differentiation Antigens. Oxford: Oxford Univ. Press; 1995. pp. 1423–1425. [Google Scholar]
- 20.Kono K, Salazar-Onfray F, Petersson M, Hansson J, Masucci G, Wasserman K, Nakazawa T, Anderson P, Kiessling R. Eur J Immunol. 1996;26:1308–1313. doi: 10.1002/eji.1830260620. [DOI] [PubMed] [Google Scholar]
- 21.Miescher S, Whiteside T L, Carrel S, von Fliedner V. J Immunol. 1986;136:1899–1907. [PubMed] [Google Scholar]
- 22.Macatonia E, Patterson S, Knight S C. Immunology. 1989;67:285–289. [PMC free article] [PubMed] [Google Scholar]
- 23.Clerici M, Stocks N I, Zajac R A, Boswell R N, Bernstein D C, Mann D L, Shearer G M, Berzofsky J A. Nature (London) 1989;339:383–385. doi: 10.1038/339383a0. [DOI] [PubMed] [Google Scholar]
- 24.Pantaleo G, Graziosi C, Butini L, Pizzo P A, Schnittman S M, Kotler D P, Fauci A S. Proc Natl Acad Sci USA. 1991;88:9838–9842. doi: 10.1073/pnas.88.21.9838. [DOI] [PMC free article] [PubMed] [Google Scholar]
- 25.Pantaleo G, Graziosi C, Demarest J F, Butini L, Montroni M, Fox C H, Orenstein J M, Kotler D P, Fauci A S. Nature (London) 1993;362:355–358. doi: 10.1038/362355a0. [DOI] [PubMed] [Google Scholar]
- 26.Orenstein J M, Fox C, Wahl S M. Science. 1997;276:1857–1861. doi: 10.1126/science.276.5320.1857. [DOI] [PubMed] [Google Scholar]
- 27.Muro-Cacho C A, Pantaleo G, Fauci A S. J Immunol. 1995;154:5555–5566. [PubMed] [Google Scholar]
- 28.Gougeon M L, Lecoeur H, Dulioust A, Enouf M G, Crouvoiser M, Goujard C, Debord T, Montagnier L. J Immunol. 1996;156:3509–3520. [PubMed] [Google Scholar]
- 29.Thieblemont N, Weiss L, Sadeghi H M, Estcourt C, Haeffner-Cavaillon N. Eur J Immunol. 1995;25:3418–3424. doi: 10.1002/eji.1830251232. [DOI] [PubMed] [Google Scholar]