

Abstract
Wound healing is a complex process involving the delicate interaction between elements that vary widely in nature and size scales, from the nanometre level, such as molecules, to cells measured in micrometres, and fibres with width and length measured on both scales. Hybrid approaches, where each species is represented by a model on an appropriate size scale, have received attention recently. In this study, we provide a review of earlier work on such hybrid models of wound healing. General models for each of the element types involved in dermal wound healing used in this research are described: cells, modelled as discrete individuals; chemicals, modelled as continua; and fibres, modelled with a novel tensorial representation. Techniques for integrating such disparate models are outlined. A six-species model (fibrin, collagen, macrophages, fibroblasts, transforming growth factor-β (TGF-β) and tissue plasminogen activator) of dermal wound healing is presented. The role of the cytokine TGF-β in the healing cascade is investigated using the model, along with its role in the degree of scarring in the healed tissue.
Keywords: collagen, wound healing, hybrid model, fibroblast, transforming growth factor-β
1. Introduction
Successful wound healing is a well-orchestrated process involving many cell types, non-cellular components, such as fibrin and collagen, and a cocktail of biologically active chemical species. Although it is a continuous cascade of overlapping processes, it is often divided into three phases: inflammation; proliferation; and remodelling.
Initially, the wound space is filled with blood from the damaged vasculature. The extravasated blood and aggregated blood-borne platelets coagulate to form a fibrin-rich clot that acts to prevent further blood loss and acts as a scaffold for early cell migration into the wound. Cell migration is also stimulated by the release of cytokines, such as transforming growth factor-β (TGF-β), produced by the degranulation of platelets in the coagulation process.
Neutrophils from the intact blood vessels invade the wound space within the first 24 hours as part of the body's immune response. Within 3 days, the neutrophil population has been replaced by macrophages attracted into the wound by chemoattractants. The macrophages debride the wound of pathogenic organisms and tissue debris. They also express cytokines including, but not limited to, TGF-β and plasminogen-activated growth factor (PDGF), both of which act as chemoattractants for fibroblasts.
Within 4 days, proteins such as plasmins start to break down the clot. The production of plasmin is governed by the presence of tissue plasminogen activator (tPA), a protein that converts plasminogen to plasmin. Here, we focus on tPA as a critical molecular species in the cascade. The clot is replaced by granulation tissue, composed of newly formed blood vessels (up to 50% by volume), macrophages, fibroblasts and loose connective tissue. This granulation tissue will completely fill the wound space within a week, and collagen fibrils will have bridged the gap. This precedes a phase of rapid proliferation of fibroblasts that synthesize and remodel collagen.
The final remodelling stage occurs on a longer time scale, often taking weeks or even months to complete. Fibroblasts in the wound continue to remodel collagen, and blood vessels regress leaving a relatively avascular scar. The resulting tissue is characterized by increased collagen density, higher levels of fibre alignment and different proportions of collagens I–III from those observed in normal tissue.
One of the intriguing features of wound healing is that skin wounds on early mammalian embryos heal perfectly without scarring (Whitby & Ferguson 1991). Embryonic wounds that lead to healing with no scar have low levels of the isoforms TGF-β1 and PDGF and high levels of TGF-β3 (Ferguson & O'Kane 2004). Recent experiments that manipulate adult wound healing to mimic the embryonic environment have led to scar-free healing in the adult (Ferguson & O'Kane 2004).
Though there has been experimental work performed on the interactions between the different species involved in wound healing, they are still poorly understood. This is largely due to the complex relationships between the involved species: the extracellular matrix (ECM); cells; and chemical factors. Mathematical modelling is an increasingly important tool for quantitatively defining, then testing, the nature of these relationships. In this work, we aim to provide detailed models of each of the species, and show how these models can be combined into a hybrid model of wound healing by first intention.
In §2, we review models of dermal wound healing, concentrating on previous hybrid multiscale models and their predictions. In §3, we extend these investigations and outline the general component models for fibres, chemicals and cells used in our new framework. In §4, a six-species hybrid model is developed with our framework to examine the inflammation and proliferation phases of wound healing. In appendix B.1, we give details of the numeric procedures used in the simulations. In §5, we give the new results, and end with a discussion in §6. Details of the modelling are given in appendices.
2. Modelling dermal wound healing
There have been two main approaches to modelling wound healing. Transquillo & Murray (1992) adopted a continuum modelling approach that incorporated a simple mechanical model of cell traction, where the behaviour of all species was governed by partial differential equations (PDEs). They focused on wound contraction, comparing their predictions with the results obtained with experiments on rats (McGrath & Simon 1983). This continuum approach was extended by Olsen et al. (1998) who distinguished between fibroblasts and their active contraction-producing form, myofibroblasts.
An alternative approach to modelling wound healing is based on a hybrid framework. Dallon and co-workers have published a series of papers on this approach (Dallon et al. 1999, 2000, 2001; McDougall et al. 2006), and the work presented here adopts this framework. The focus of these papers is the interaction between fibroblasts and the ECM, with the main aim of predicting the characteristics of the scar tissue that results when a wound heals. The papers consider dermal healing by first intention with no contraction of the wound space; in this work, we discuss the same situation.
Dallon et al. (1999) lay the foundation for this type of modelling. The cells (fibroblasts) are treated as discrete entities that move at a constant speed through the rectangular two-dimensional wound space. While their speed is fixed, their direction is governed by the local orientation of the ECM fibres. The ECM, treated as a continuous variable, initially consists of fibrin (a clot) that is replaced with collagen laid down by the infiltrating fibroblasts. The justification for the continuum assumption is that collagen fibres are typically less than 1 μm in radius, whereas a typical fibroblast cell is approximately 50–70 μm in ‘length’ (Pizzo et al. 2005). The cells ‘sense’ the local orientation of the collagen and reorient their motion in the predominant direction (contact guidance). A cell can, in turn, reorient the ECM in its vicinity to be more aligned with its current polarity. The results are obtained using 600 cells on a 0.5×1 mm domain. The model examines (i) the effect of altering the speed of the fibroblasts, (ii) the consequences of reducing the contact guidance of the cells, and (iii) the changes that occur when the initial matrix orientation is varied. They also investigate how the alignment of the final collagen matrix depends on the distribution of cell influx into the wound. The degree of alignment of the final ECM has been implicated in the degree of scarring with normal tissue described as having a ‘basket weave’ pattern with a fairly random orientation, whereas scarring appears to be associated with more aligned collagen fibres (Rawlins et al. 2006).
Dallon et al. (2000) used the previously developed model to examine anti-scarring therapies using TGF-β (the isoform is not specified). From the modelling, they conclude that the most important factors influencing the quality of the scar are the speed and, more importantly, the influx of fibroblasts from the surrounding undamaged tissue. The TGF-β distribution is not modelled explicitly.
The Dallon et al. (2001) paper again focuses on the role of TGF-β (again the isoform is not specified) in wound healing, although now its concentration (uniform throughout the wound space) is time dependent with a peak approximately 100 hours after wounding. The TGF-β has direct effects on cell motility, cell proliferation and collagen production, but the model predicts that these effects are small and, in addition, the predictions do not explain the anti-scarring properties of TGF-β. However, they do find that changing the fibroblast–collagen contact guidance interaction strongly affects the final collagen alignment, and that this might be an explanation for the experimentally observed influence of TGF-β on scarring.
The more recent McDougall et al. (2006) paper further develops the earlier models by including a chemoattractant with a stationary, spatially non-uniform distribution, which the authors assume is produced by leucocytes that have migrated into the wound bed before the fibroblast infiltration. The model is used to estimate the degree of scarring and predicts that there is a trade-off between the wound integrity (measured by the level of integration of scar tissue with surrounding tissue) and the degree of scarring, with the integrity being maximized when the chemoattractant has a large diffusion coefficient; scarring can be reduced if an inhibitor of the chemoattractant is present.
3. A general hybrid model of dermal wound repair
3.1. Overview of general model
We consider, as a basis for our work, the methods originally developed by Dallon and co-workers. The authors' use of continuum and discrete variables to represent species on different size scales offers many options for extension and investigation.
McDougall et al. (2006) investigated the addition of a fixed TGF-β concentration profile to a hybrid model. However, the concentration profile in a wound changes over space and time, and can be affected by the alteration of various conditions/model parameters. The time evolution of cytokines is included in our model. These are synthesized by individual cells and released from the tissue under certain conditions.
The vector-based representation of collagen and fibrin fibres used by Dallon et al. (1999) has some drawbacks. As mentioned earlier, collagen in healthy uninjured tissue is aligned in a basket weave pattern, as opposed to scar tissue that is characterized by highly aligned fibres. The vector method represents directional alignment; however, it does not provide any explicit information about the degree of isotropy of the field at a point.
The second drawback of the vector approach is that it is inherently unidirectional in nature while fibre alignment is bidirectional. When interpolating to determine the alignment of fibres at points not on a numeric mesh node, it is necessary to choose from one of the two possible alignments, leading to ambiguities in some cases. We propose a tensor-based orientation representation that elegantly overcomes the isotropy and ambiguity limitations.
The cell populations of Dallon et al. (1999) are composed of discrete points. In our model, each cell occupies a circular region of the domain. This approach allows the inclusion of cell–cell interactions such as collisions as well as contact inhibition.
3.2. Representation of fibre networks
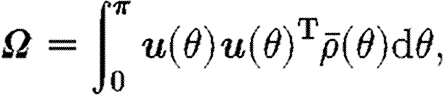
A tensorial approach is proposed to represent the ECM components (collagen and fibrin) as continua, and is similar to that proposed by Barocas & Tranquillo (1997). Fibre orientation at a given point is represented by a symmetric tensor
 |
3.1 |
where  is the density of fibres at the angle θ and u(θ)T=[cos θ, sin θ] is the unit vector in the direction θ. Fibre orientation is bidirectional in nature, so the integral in (3.1) is over the half-plane θ∈[0, π).
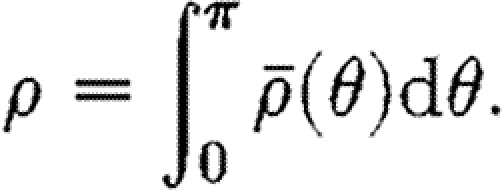
The total density of fibre at a point is defined by the integral
 |
3.2 |
Taking the trace of the orientation tensor, Ω, in (3.1) shows that the fibre density in (3.2) is implicitly stored as the trace of the orientation tensor.
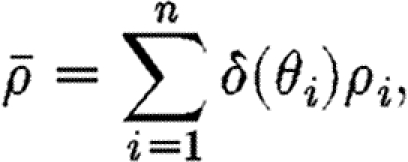
If the fibres at a given point are represented by n discrete fibres with individual orientations θ 1,θ 2, … , θ n and densities ρ 1, …, ρ n, the fibre density (3.2) can be written more simply as a sum
 |
3.3 |
where δ(θ) is the Dirac delta function. The fibre orientation tensor, Ω, then becomes
 |
3.4 |
and the total fibre density (3.3) is
 |
3.5 |
The orientation tensor is a symmetric positive definite, and consequentially it can be decomposed as the sum of its (orthogonal) eigenvectors' outer products
 |
3.6 |
where the weights, λ 1 and λ 2, are the corresponding positive eigenvalues. The eigenvalues are ordered such that λ 1≥λ 2, and we label (λ 1, v 1) as the dominant eigenpair. These eigenpairs can be used to measure the degree of isotropy and alignment of fibres. The eigenvector v 1 corresponding to the largest eigenvalue gives the dominant direction of fibre alignment. In the case where both eigenvalues are equal, the fibre distribution is perfectly isotropic (Ω=α I), and in the case where λ 2=0 the fibres are oriented in only one direction ±v 1, and (3.5) degenerates to the rank one case
 |
3.7 |
Thus, the orientation of the eigenvectors gives information about the direction of alignment, and
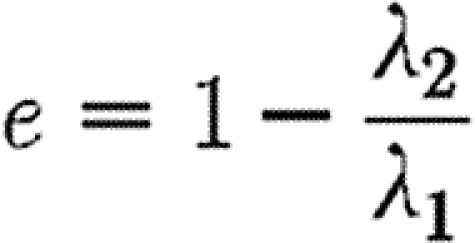 |
3.8 |
gives a metric for local fibre anisotropy. Figure 1 gives a visual representation of bundles of fibres of uniform density whose orientation tensors have been calculated using the discrete form in (3.4).
Figure 1.

Sets of (i) discrete fibres with the (ii) corresponding ellipses whose axes are aligned with the eigenvectors of the tensor. The total density of fibres in each case has been scaled to unity: (a) fibres with an isotropic distribution (e=0) and (b,c) fibres that are predominantly horizontally and vertically aligned, respectively (e=0.89 and 0.79).
The ellipsoid glyphs in figure 1 are useful for visualizing fibre distribution properties at discrete points. However, to visualize the orientation of large fields, where orientation properties can vary from scale to scale, a better approach is required. In figure 2, a pseudo-streamline approach has been made that intuitively indicates both local and global alignment properties. See appendix B.2 for details of the pseudo-streamline technique.
Figure 2.

Three different fibre fields visualized with the pseudo-streamline method. (a,b) The fields are perfectly anisotropic and isotropic, respectively. (c) The field is random at each point on the mesh and, as such, exhibits both local anisotropy and global isotropy.
3.3. Cell model
The cell population consists of discrete individuals, each occupying a two-dimensional disc in the plane. Each cell receives cues from its surrounding environment. These include local cytokine concentration and collagen alignment, which, together with local cell–cell interactions, determine its behaviour.
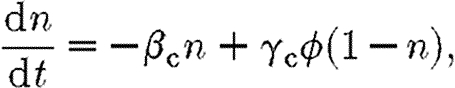
Many cell behaviours, such as proliferation, are stimulated by cytokines. The model cell has a fixed number of receptors for a given cytokine, and the proportion of receptors bound by the cytokine, n, is determined by the ordinary differential equation
 |
3.9 |
where β c and γ c are the receptor unbinding and binding rates, respectively, and ϕ is the concentration of the cytokine. A cell's response to a change in cytokine concentration is not instantaneous, instead it is dependent on the rate of receptor binding γ c. Likewise, the cell will exhibit persistence in cytokine-induced behaviour, inversely proportional to β c.
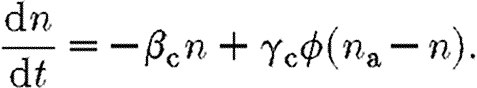
It is assumed in (3.9) that the number of receptors on a cell is fixed. Of interest is the effect of reducing the number of receptors available for binding by using receptor blockers. This is incorporated into the model by reducing the proportion of receptors that can be bound from unity to n a, so that equation (3.9) becomes
 |
3.10 |
The model cell also receives directional cues from its environment. All cell types exhibit chemotactic behaviour, so that the cells migrate in the direction of the (increasing) gradient of a chemoattractant. Some cell types, such as fibroblasts, also respond to the local orientation of the ECM by orienting their motion in the direction of the dominant collagen alignment.
We propose a model for chemosensory cell movement, similar to that of Stokes et al. (1991), based on receptor binding, with a stochastic term accounting for the random aspect of cytokine molecule binding to a finite number of receptors. In ECM of uniform fibre orientation, a cell's alignment is affected solely by the chemoattractant gradient, ∇ϕ, which we will refer to as its chemotactic bias. The chemotactic bias is defined by the vector-valued function g c, governed by the stochastic differential equation
| 3.11 |
The first term accounts for the loss of chemotactic bias as a result of freeing bound receptors. Directional persistence is inversely proportional to β; lower values of β increase the ‘memory’ of the cell. The bias of the cell towards the chemotactic gradient is governed by the second term, with sensitivity γ. We propose that as cell receptors become saturated, the cell is less able to perceive the gradient, with cells exhibiting more pronounced chemotactic responses in lower cytokine concentrations. To account for this, the bias term is also scaled by the number of free receptors (n a−n).
Variations in bias due to stochastic fluctuations in binding/unbinding are included in the third term. The stochastic variable W is the normal Weiner variable, where W(t)−W(s) is normally distributed with mean 0 and variance (t−s), given that t>s.
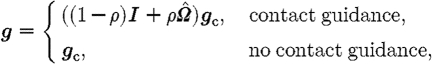
Some cell types, such as fibroblasts, show preferential alignment and migration in the direction of local fibre orientation (contact guidance; Dickinson et al. 1994). Fibre orientation is bidirectional, with the cells being polarized towards the fibre direction closest to that of their chemotactic response. The cell orientation adjusted for fibre orientation is given by
 |
3.12 |
where g is the cell's direction of migration;  is the normalized (length-preserving) local fibre orientation tensor; and 0≤ρ≤1 is the local scaled fibre density. Thus, the fibre alignment has little effect on isotropic fields (
 ) and when fibre density ρ is small. If a cell type's orientation is not influenced by fibre alignment, it is determined solely by the direction of its chemotactic bias.
Modelling cell populations with discrete individuals, each occupying volume, allows the inclusion of complex cell–cell interactions. Such interactions are very difficult to model if the cell population is treated as a continuum or as a set of dimensionless points. For example, cells in the middle of a tightly packed group become trapped and are unable to migrate.
Cells are represented as inelastic discs with no cell–cell overlap. When one cell blocks the path of another, the cell whose path is blocked will change its path such that the smallest deviation is made to its preferred direction of migration, g in (3.12), while avoiding overlapping. This is illustrated in figure 3. Such cell–cell interactions are short range in nature. Only nearby cells in the cell population need to be considered when determining such influences on a cell. The algorithm for calculating such cell–cell interactions is  (N
2) in computer time for a population of N cells, which becomes prohibitive for large populations. To overcome this, the domain is subdivided into a grid of equally sized regions, and lists of the cells that are currently in each region are maintained. Thus, only cells that are currently in a cell's region, and in neighbouring regions, need to be considered when calculating cell–cell interactions.
(N
2) in computer time for a population of N cells, which becomes prohibitive for large populations. To overcome this, the domain is subdivided into a grid of equally sized regions, and lists of the cells that are currently in each region are maintained. Thus, only cells that are currently in a cell's region, and in neighbouring regions, need to be considered when calculating cell–cell interactions.
Figure 3.

Cell i finds its path blocked by cell j and chooses a new direction of travel g new to avoid cell j, while minimizing the deflection θ from the original path g defined in (3.12).
3.4. Chemical species model
Biologically active chemicals play an important role in this model. They regulate cell behaviour, are synthesized by cells and interact directly with the fibrous network in the decay of the initial fibrin clot. We use the diffusion equation
 |
3.13 |
to model a generalized chemical of concentration ϕ. The non-constant diffusion coefficient in the first term allows the diffusion coefficient to vary over space and time. The source term S(x, t) represents the production and decay of the bioactive chemical. In the model developed in §4, diffusion is dependent on the density of the ECM, and cells act as point sources.
Equation (3.13) is solved numerically using the finite-volume method. It is an extension of previous models involving discrete cells and cytokines in which dynamically changing chemical fields can be modelled, and is essential for modelling wound healing processes over longer periods of time.
The model presented above is general in the sense that, for example, the equations would apply to a general problem involving any number of cell species and cytokines. Now we focus on the six-species model (fibrin, collagen, macrophages, fibroblasts, tPA and TGF-β).
4. A six-species wound healing model
As a demonstration of the insights that can be gained using the modelling framework presented thus far, we now develop a model of the healing of a wound in the dermis by first intention. We are interested in the first two weeks of healing, which correspond to the inflammation and proliferation stages discussed in §1. The mechanical properties of the wound, such as stress and contraction induced by migrating fibroblasts, are not considered here as they are assumed to be smaller and less significant in a narrow wound healing by first intention.
The two-dimensional domain illustrated in figure 4, representing a cross section of the dermis perpendicular to the epidermis, is used in the simulation. The top boundary of the domain corresponds to the bottom of the epidermis. Directly below the epidermal boundary is the wound space from an incision initially filled by a fibrin clot. The wound is surrounded by uninjured tissue comprising isotropically oriented collagen. The entire domain has dimensions of 1200×1600 μm, with the wound space having dimensions of 400×800 μm.
Figure 4.

The domain for simulations with the dermal wound healing model. The initial fibrin clot in the wound space is surrounded by a region of uninjured tissue populated with cells.
The domain is discretized on a regular mesh, with the same spatial discretization used for both the fibre and the chemical species. Cell positions are independent of the mesh points. See appendix B.3 for further information on the interpolation between mesh-based and cell-based species.
Two fibre networks, collagen and fibrin, are the components of the ECM considered here. Two cytokines, TGF-β and tPA, regulate cell behaviour and the decay of the fibrin clot, respectively. Two cellular species, fibroblasts and macrophages, are involved in the remodelling of collagen and the expression of cytokines. Here we give an overview of the model equations, with further notes on the parameters and the numerical solution of the equations in appendix A. A list of the variables used in the equations is given in table 1.
Table 1.
Model variables and their definitions.
| variable | definition |
|---|---|
| Ω F/ρ f | fibrin orientation/density |
| Ω C/ρ c | collagen orientation/density |
| ϕ p | tPA concentration |
| ϕ t | TGF-β concentration |
The densities of fibrin and collagen in the ECM, ρ f and ρ c, respectively, are scaled such that their sum does not exceed unity, 0≤ρ f+ρ c≤1. The ECM in the wound space is initially composed of a fibrin clot of uniform isotropic orientation, i.e. Ω f=I and ρ f=1. A simple model is used to describe how the fibrin clot is broken down by tPA, at a rate proportional to the concentration of tPA, namely
 |
4.1 |
where r p is the constant rate for fibrin degradation by tPA. It is possible to express the time evolution of fibrin in (4.1) in terms of density ρ f alone, because it is assumed that the orientation of the clot does not vary as it decays. The tPA concentration is governed by a diffusion equation of the form given in (3.13), i.e.
 |
4.2 |
where the source term T(x, t) accounts for production at the perimeter of the wound by healthy endothelium during the initial stages of healing, and D p(x, t) is the diffusion coefficient of tPA, which varies with fibrin density (see appendices A.2 and A.3 for the functional forms of T and D p).
As the fibrin decays, it is replaced by collagen produced by fibroblasts that migrate into the wound, which we model using
 |
4.3 |
where the product (1−ρ f)(1−ρ c) dictates that the total density of fibrin and collagen does not exceed unity. The rate at which collagen is synthesized by fibroblasts that migrate into the wound, W Fc, is defined in appendix A.4.
The concentration of TGF-β is governed by the equation
 |
4.4 |
where w Mt is the source term associated with TGF-β production by macrophages at a rate dependent on fibrin density and the proportion of bound TGF-β receptors (see appendix A.2).
Boundary conditions are the same for both chemical types. The top of the domain, where the dermis meets the epidermis, has a no-flux condition, and the other boundaries in the dermis are governed by a Robin condition
 |
4.5 |
where  is the unit normal to the boundary and k is a constant. The concentration of both the chemicals outside the domain, ϕ
∞, is taken to be zero.
is the unit normal to the boundary and k is a constant. The concentration of both the chemicals outside the domain, ϕ
∞, is taken to be zero.
The two cell species, macrophages and fibroblasts, are present initially only in the ECM surrounding the wound space. Following the observations of McDougall et al. (2006), the density of both cell types increases linearly with distance from the epidermis. This assumption is based on cell-staining experiments (Adams 1997). A cell that migrates off the computational domain is replaced by a cell placed at the edge of the domain at a random location sampled from the initial random linear distribution.
Macrophages are assumed not to proliferate and have a constant population of 400. They exhibit a chemotactic response to TGF-β, which promotes their migration into the wound space. Once exposed to TGF-β and fibrin inside the wound space, they express more TGF as given by equation (A 2).
Unlike the macrophages, the fibroblast population is not fixed at its initial size of 100. A simple model of proliferation stimulated by exposure to TGF-β is used. For mitosis to occur, an individual fibroblast has to have a threshold proportion of its F receptors, n p, bound for some fixed proliferation time, t p. Furthermore, contact inhibition of proliferation is included by stipulating that a cell will not proliferate if there are any other cells within a certain radius, r p.
In addition to receiving directional cues from the concentration gradient of TGF-β, a fibroblast's orientation is affected by the local alignment of collagen fibres according to (3.12). Thus, the orientation of collagen deposited by the first fibroblasts to enter the wound influences the migration of subsequent arrivals because of contact guidance.
The reader is referred to appendix B for details on the implementation of the numerical solution of the model.
5. Results
We investigate a baseline wound healing case using parameters (defined in appendix A) that produce a healing cascade as described in §1. Each simulation is over a two-week period, which covers the inflammation and proliferation stages which see the fibrin clot replaced with collagen under normal healing conditions. Given the uncertainty regarding the true values of many of the parameters, this investigation is of the sensitivity of the model outputs to variation of the baseline parameters.
The results for separate simulations with the same parameters are very similar, despite the stochastic variation introduced by the cell model. The results presented in figures 5 and 6 were obtained by running the simulations twice for each set of parameter values, and finding the average of the variable in question, such as cell population or mean collagen density in the wound space, at each time step. Images of the wound space showing key species in a representative simulation are shown in figure 7.
Figure 5.

Comparison of averaged results using baseline parameters (solid curves), reducing TGF-β expression by macrophages (§5.1; dashed curves), and decreasing the TGF-β diffusion rate (§5.2; dotted curves): (a) the proportion of fibrin in the wound space ECM (the same for each case), (b) population of fibroblasts inside the wound space, (c) the total amount of TGF-β inside the domain and (d) the proportion of collagen in the wound space ECM, where a uniform collagen density of ρ c=1 everywhere in the wound space corresponds to a proportion of 1.
Figure 6.

Averaged results for simulations where the proportion of TGF-β receptors was reduced from n a=1 (solid curves) to n a=0.5 (dashed curves) and n a=0.2 (dotted curves). (a,b) Total TGF-β in the domain for baseline and reduced TGF-β diffusion cases, respectively. (c,d) Number of fibroblasts in the wound space for baseline and reduced TGF-β diffusion cases, respectively. (e,f) Proportion of collagen in the wound space ECM for baseline and reduced TGF-β diffusion cases, respectively.
Figure 7.

Time evolution of species at the end of (i) 2, (ii) 4, (iii) 7 and (iv) 14 days of baseline wound healing simulation: (a,b) distribution of macrophages and fibroblasts, respectively, over the entire domain with grey shade representing TGF-β concentration. (c) Collagen inside the wound space.
TGF-β acts as a mediator for the duration of the simulation. The first macrophages enter the wound via random walks since the TGF-β gradient is low. They then synthesize TGF-β when exposed to the fibrin in the clot. This quickly establishes a significant cytokine gradient, which promotes large-scale influx of macrophages into the wound from the surrounding tissue. By the end of the second day, two clusters of macrophages have formed in the wound space, both centred on high-concentration ‘hot spots’ of TGF-β at the bottom and top of the wound, respectively, as illustrated in figure 7. By the end of the fourth day, the fibrin in the clot is almost entirely broken down by the action of tPA (figure 5 a). The macrophages stop producing TGF-β in response, and the total amount of the cytokine in the domain decreases from the fifth day onwards.
The increase in the fibroblast population inside the wound goes through two phases, as illustrated in figure 5 b. The population increases rapidly for the first 4 days in response to the newly established chemotactic gradient. Population growth is more modest, and approximately linear, for the remainder of the two weeks due to TGF-β stimulated proliferation inside the wound. The majority of the cells migrate to the two TGF-β hot spots, where they cluster in a manner similar to that exhibited by the macrophages. As a result, the bulk of the initial collagen synthesis occurs in these regions, with the remainder of the wound space healing as fibroblasts migrate and proliferate to fill the wound more uniformly as the intensity of the hot spots decreases.
In each step of the baseline case, the cytokine TGF-β plays a central role. We now investigate three cases that affect this role in different ways.
5.1. Reduction of TGF-β expression by macrophages
In this case, the maximum rate of TGF-β synthesis by macrophages, as they migrate into the wound, is reduced from k 3=0.5 to 0.2 (see equations (A 1) and (A 2)).
As in the baseline case, the profile of the amount of TGF-β in the domain (figure 5 c) peaks around the fifth day; however, from the second day onwards, it is half the baseline value. As illustrated in figure 8, the hot spots of TGF-β are far less pronounced, and the number of cells of both species that migrate into the wound is reduced. However, the number of fibroblasts inside the wound is approximately the same as the baseline case, as a result of increased proliferation in the absence of clustering. Despite reduced collagen synthesis rates by individual cells, the proportion of collagen in the wound space is increased by the more spatially uniform fibroblast population from the fourth day onwards, as illustrated in figure 5 d.
Figure 8.

Time evolution of species at the end of (i) 2, (ii) 4, (iii) 7 and (iv) 14 days of wound healing simulation with reduced TGF-β expression levels by macrophages (§5.1): (a,b) distribution of macrophages and fibroblasts, respectively, over the entire domain with grey shade representing TGF-β concentration. (c) Collagen inside the wound space.
5.2. Decreasing the TGF-β diffusion coefficient
We investigate the effect of decreasing the minimum and maximum values of the TGF-β diffusion coefficient,  and
and  , in equation (A 6), from 75–750 to 40–400. As illustrated in figure 9, the cytokine gradient outside the wound space takes longer to form, and the hot spots in the wound are more concentrated and persistent. While the fibroblast population is of a similar size to that in the baseline case, the cells remain clustered around the hot spot in the middle of the wound space for longer, and synthesize less collagen at the periphery of the wound space as a result. The subsequent reduction of total collagen synthesis inside the wound can be seen in figure 5
d.
, in equation (A 6), from 75–750 to 40–400. As illustrated in figure 9, the cytokine gradient outside the wound space takes longer to form, and the hot spots in the wound are more concentrated and persistent. While the fibroblast population is of a similar size to that in the baseline case, the cells remain clustered around the hot spot in the middle of the wound space for longer, and synthesize less collagen at the periphery of the wound space as a result. The subsequent reduction of total collagen synthesis inside the wound can be seen in figure 5
d.
Figure 9.

Time evolution of species at the end of (i) 2, (ii) 4, (iii) 7 and (iv) 14 days of wound healing simulation with reduced TGF-β diffusion rate (§5.2): (a,b) distribution of macrophages and fibroblasts, respectively, over the entire domain with grey shade representing TGF-β concentration. (c) Collagen inside the wound space.
5.3. Varying the number of available cytokine receptors on a cell
The results so far show the importance of TGF-β in orchestrating the initial phases of healing. This suggests that the manipulation of TGF-β could be used to control healing. However, in a clinical application, it may not be possible to alter the production rate by macrophages or the rate of diffusion directly. Blocking of cytokine receptors may offer a way to clinically influence the role played by such cytokines. Here, we investigate the effect of reducing the proportion of available receptors on both macrophages and fibroblasts from n a=1 to 0.5 and 0.2 using the baseline parameters.
For the baseline case, each successive reduction in the parameter n a reduces the amount of TGF-β in the domain, as illustrated in figure 6. As a result, fewer macrophages migrate into the wound and those that do express less of the cytokine. The fibroblast population in the wound varies little after the sixth day, after the initial influx of fibroblasts from the surrounding tissue has finished. This is because the fibroblasts do not proliferate as the proportion of bound receptors required for proliferation, n prol=0.5, and cannot be reached when n a≤0.5. Despite the lower TGF-β levels and lower fibroblast population, the rate of wound healing increases when cell receptors are blocked. The sparser fibroblast population is more evenly distributed as a result of lower chemotactic response, and this leads to faster collagen deposition away from the hot spots, with 90 per cent of the wound healed in half the time for n a=0.2.
A reduction in the proportion of bound receptors in the second case, when the rate of diffusion of TGF-β is decreased, leads to similar reductions in the levels of TGF-β and the fibroblast population. Similarly, the rate of healing is faster than n a=1 for both n a=0.5 and n a=0.2, although it is slower for n a=0.2 than n a=0.5. As noted earlier, when the diffusion coefficient D t is decreased, the TGF-β gradient around the wound space forms more slowly. The cells with n a=0.2 do not respond strongly to the weak gradient, when compared with cells with more available receptors. Healing is slower between days 2 and 6, but by the sixth day a steep enough gradient has been established to attract enough fibroblasts into the wound to ensure rapid healing.
5.4. The degree of scarring in healed tissue
The analysis presented so far has focused on the rate of healing, measured by the proportion of the wound space composed of collagen over time. In our work, as was noted in the previous work of Dallon et al. (1999), the increased alignment of collagen fibres in healed tissue is associated with scarring. However, from an inspection of the fibres in figures 7–9 it is not obvious whether there is any significant difference between the orientations of the healed tissue in each case.
Here, we investigate the properties of the healed tissue in the baseline case to the properties of tissue; the proportion of available receptors on cells, n a, is varied over the range n a={1,0.9,0.8,0.7,0.5,0.2}. The orientation of healed collagen shows a more random variation between simulations associated with stochastic effects than other measures, such as TGF-β concentration and fibre density, and it was found that simulations had to be run 20 times for each case and fibre orientation properties averaged. The mean value of the measure of isotropy, e, defined by expression (3.8), inside the wound space is used as a metric of the degree of scarring, and is plotted for each case in figure 10. There is a clear trend for collagen in the healed tissue to be less aligned when the proportion of the cells' TGF-β receptors is reduced.
Figure 10.

Plot of mean value of e, the measure of fibre isotropy, of collagen in healed wounds as the proportion of available TGF-β receptors, n a, is reduced.
Visual inspection of the spatial variation of the isotropy measure, e, in figure 11 a, shows that when no receptors are blocked, there is a higher level of collagen alignment, particularly at the lower edges of the wound space, where the initial influx of fibroblasts enters the wound. These migrating fibroblasts synthesize collagen in their direction of travel, with the resulting fibres aligned from the edges towards the centre of the wound. This can be seen clearly in the streamline image of the healed collagen in figure 11 b. By reducing the number of available receptors, the initial rate of collagen synthesis by fibroblasts is reduced and cells migrate in more random paths. As a result, the healed tissue becomes more isotropically aligned as more receptors are blocked. Fibroblasts synthesize collagen in their direction of movement, so the more random the cell paths, the more variation there is in fibre orientation. Also, when individual cells synthesize less collagen, the first cell to migrate into a region will synthesize less collagen, so that subsequent arrivals moving in other directions have more ‘space’ to synthesize collagen. The results of reducing the parameter n a are very similar to those from modelling the application of a TGF-β blocker by McDougall et al. (2006), an extension of the work of Dallon et al. (1999), with similarities between both the degree and the direction of alignment in the baseline and reduced receptor/TGF-β blocking/inhibition. In that study, the authors also concluded that the higher turning rate of cells when TGF-β is inhibited leads to more random/isotropic fibre orientation.
Figure 11.

Images of the alignment of healed collagen inside the wound at the end of the two-week period for the baseline parameters with n a values of (i) 1, (ii) 0.5 and (iii) 0.2. (a) Isotropy of the healed collagen, where darker regions correspond to more isotropic tissue (low values of e). (b) Streamline images of fibre alignment.
6. Discussion
Modelling dermal wound healing has become an area of intense research in the last two decades, driven primarily by researchers attempting to understand the phenomena that lead to impaired wound healing. Chronic wounds, such as leg ulcers, often associated with diabetes, are a significant burden on a community's healthcare budget and are debilitating and painful for the patient. On the other hand, some wounds heal quickly, but do so with excessive scarring.
The multiscale model that we have developed here is more general than those developed previously and can be used as a framework to study both the inflammation and proliferation stages of wound healing. As a general framework, it allows, for example, for the introduction of cytokine-dependent proliferation or the inhibition of mitosis when space is not available. Other cell behaviours can be introduced relatively easily. The main aim of the present work has been to establish a general framework for two-dimensional hybrid multiscale modelling of wound healing. Now that the base model has been formulated, it has the potential to be used for more general models. Here we discuss some possible extensions.
The framework we have developed is two-dimensional; however, it would carry over to three dimensions easily. In the work presented here, the clumping of cells had a very significant impact on the predictive outcomes, impairing migration and cell division. In three dimensions, the cells would have much more freedom to move past one another and to proliferate.
The modelling described here does not include the ingrowth of the epidermis (at the top of the computational domain). It is known that there is a strong interaction between the epidermal and dermal cells in wound healing, which has been implicated in the development of hypertrophic scars (Bellemare et al. 2005). This interaction involves chemical signals, and the modelling framework developed here could be extended to model the restoration of the epidermis by cell migration and chemical signalling.
In this work, we modelled healing by first intention, where we assume that wound contraction is small. If the work is to be extended to healing by second intention, where contraction can be significant, a mechanical model would be required. Hybrid models that include the stresses induced by discrete cells exerting traction on the ECM have been introduced recently (Kim et al. 2007). Such an extension would also allow for the investigation of the mechanical interaction between the dermal and epidermal cells (Cruywagen & Murray 1992), and the recent observation that the differentiation of fibroblasts to myofibroblasts (the cells that exert more cell traction in a wound) requires both TGF-β and mechanical stress.
Another important extension is to include new blood vessel growth (angiogenesis) into a wound. As pointed out by Murray (2003), there are no mechanical models of wound healing which include angiogenesis, even though it is known that successful ingrowth of blood vessels is a crucial step in successful wound healing.
In summary, we have developed a flexible framework to investigate dermal wound healing. We have demonstrated some of its predictions with examples that relate to scarring, and have outlined how it can be extended to form the basis of a powerful predictive tool. Such a tool could be used to test hypotheses about interventions that might be proposed to ameliorate hypertrophic scarring or to improve the healing of chronic wounds.
Acknowledgments
This research was supported under the Australian Research Council's Discovery Projects funding scheme (project number DP0878011). The authors would like to thank the anonymous referees for their thoughtful suggestions for improvement of the original manuscript.
Appendix A. Parameter and kinetic form description
A.1. tPA production at wound edges
A very simple model is used for the release of tPA by healthy endothelium at the boundary of the wound. The source term T in (4.2) is set to be constant in a 20 μm wide strip on the left, right and lower edges of the wound space, and zero everywhere else.
A.2. TGF-β expression by macrophages
The source term for the expression of TGF-β in the wound space in equation (4.4) is given by
 |
A1 |
where w i is the weight function defined in (B 4). In our model, TGF-β synthesis by macrophages is stimulated by direct contact with fibrin in the clot and exposure to TGF-β, so that
| A2 |
where k 3 is the maximum rate of TGF-β expression by a macrophage, and r n and r f vary linearly between minimum values k 4 and k 5, respectively, and unity
| A3 |
| A4 |
A.3. Diffusion coefficients of the chemical species
It is assumed that the diffusion coefficients for both tPA and TGF-β, D p and D t, respectively, are lower in the fibrin clot and follow the linear forms
 |
A5 |
 |
A6 |
where D min is the diffusion rate inside ECM completely composed of a fibrin clot, and D max is the diffusion rate in tissue free of fibrin.
A.4. Collagen synthesis by fibroblasts
The net collagen synthesized by fibroblasts in (4.3) is defined by
 |
A7 |
where the tensor  aligns the collagen synthesized by cell i with the cell's direction of orientation, u
i=g
i/‖g
i‖2. The weight function w
i is calculated using (B 4). It is assumed that the rate of collagen synthesis by a fibroblast, r
Fc, increases linearly as the proportion of bound TGF-β receptors increases, so that
aligns the collagen synthesized by cell i with the cell's direction of orientation, u
i=g
i/‖g
i‖2. The weight function w
i is calculated using (B 4). It is assumed that the rate of collagen synthesis by a fibroblast, r
Fc, increases linearly as the proportion of bound TGF-β receptors increases, so that
| A8 |
where k 1 and k 2 are the maximum and minimum collagen synthesis rates, respectively, inside the wound space by an individual fibroblast.
A.5. Cell speed
We assume that a cell's progress is hindered in the dense fibrin clot that initially occupies the wound space, and that it is most mobile in the granular tissue, which in our model corresponds to areas inside the wound space with little collagen after the initial fibrin clot has been degraded. For simplicity, this is modelled as the product of two decreasing linear functions of fibrin and collagen density in the equation for cell speed
 |
A9 |
where s max is the maximum cell speed, and k 6 and k 7 are the scaling factors for decrease in cell speed as fibrin and collagen densities increase, respectively (in the range 0≤k 6, k 7≤1 to ensure positive cell speeds).
The other factor that affects cell speed is the exposure to TGF-β. This is reflected in the third term of (A 9), which is an increasing function of the number of bound TGF-β receptors. The form of the function, illustrated in figure 12, is chosen such that the cell speed increases quickly after an initial exposure to the cytokine, with relative insensitivity to increased exposure.
Figure 12.

Dependence of cell speed on the proportion of bound TGF-β receptors, given in equation (A 9).
A.6. Parameter values
The parameters for the model equations are given in table 2. Accurate estimates for many of the parameters are not available in the literature, and others, such as the stochastic parameters governing cell motion, would require experimental work to determine. Where possible, values were taken from the literature, and others are chosen to produce a reasonable representation of the wound healing cascade for the simple scenario of healing from first intention. Thus, the focus of the analysis in §5 is on the sensitivity of the model to parameter variation, to illustrate the insights that can be gained using the multiscale modelling framework presented in this paper.
Table 2.
Model parameters, their definitions and values for the baseline case (§5).
| species | parameter | value | definition (equation) |
|---|---|---|---|
| macrophages | β c | 1 | receptor binding (3.9) |
| γ c | 5 | receptor binding (3.9) | |
| β | 2 | cell polarity (3.11) | |
| γ | 5 | cell polarity (3.11) | |
| α | 10−4 | cell polarity (3.11) | |
| s max | 400 | cell speed (A 9) | |
| k 6 | 0.4 | cell speed (A 9) | |
| k 7 | 0.6 | cell speed (A 9) | |
| r | 10 | cell radius | |
| k 3 | 5 | TGF-β expression (A 2) | |
| k 4 | 0.75 | TGF-β expression (A 3) | |
| k 5 | 1 | TGF-β expression (A 4) | |
| fibroblasts | β c | 1 | receptor binding (3.9) |
| γ c | 5 | receptor binding (3.9) | |
| β | 1 | cell polarity (3.11) | |
| γ | 10 | cell polarity (3.11) | |
| α | 10−4 | cell polarity (3.11) | |
| s max | 150 | cell speed (A 9) | |
| k 6 | 0.4 | cell speed (A 9) | |
| k 7 | 0.6 | cell speed (A 9) | |
| r | 20 | cell radius | |
| k 1 | 30 | collagen synthesis (A 8) | |
| k 2 | 60 | collagen synthesis (A 8) | |
| n prol | 0.5 | mitosis | |
| t prol | 48 | mitosis | |
| TGF-β |
|
75 | diffusion rate (A 6) |

|
750 | diffusion rate (A 6) | |
| tPA |
|
50 | diffusion rate (A 5) |
|
1000 | diffusion rate (A 5) | |
| r p | 0.15 | fibrin decay (4.1) | |
| T | 0.1 | source term (4.2) |
— The parameters governing tPA diffusion, production and its subsequent interaction with the fibrin clot in equations (4.1) and (4.2) were chosen so that the fibrin clot decays within 5 days, with an 80 per cent reduction in fibrin density within 4 days.
— The parameters governing cell paths in equations (3.9) and (3.11) were chosen so that both macrophages and fibroblasts show a strong chemotactic response to TGF-β exposure. The receptor binding rates and stochastic noise are the same for both cell types; however, macrophages show a lower tendency to align in the direction of the TGF-β gradient, and exhibit lesser directional persistence than fibroblasts. Thus, macrophages migrate into the wound in response to the initial chemotactic gradient before fibroblasts since their speed is higher, and migrate throughout the entire wound and then leave the wound earlier than the fibroblasts as TGF-β levels decrease.
— The values of parameters in the cell speed equation (A 9) were chosen to give realistic speeds. For simulations with the baseline parameters, fibroblasts travel an average distance of 30 μm per hour in the tissue surrounding the wound, with far lower values inside the wound space initially due to high fibrin density, and later contact inhibition from other cells that migrate into the wound. This is in accordance with the experimentally observed speeds of 12–60 μm h−1 in vitro for fibroblasts in three-dimensional collagen gells (Friedl et al. 1998).
— The cell radius defines the region of a cell's influence on the domain and the region of contact inhibition. The values given correspond with the lower range of values for the size of nuclei of the respective cells, so that the effect of collisions between cells during migration was not too large.
— The TGF-β synthesis rates by macrophages, and the TGF-β diffusion rate (see appendices A.6 and A.2), were chosen to give a concentration profile of TGF-β inside the wound that agrees with those measured by Yang et al. (1999) in experiments on rats, with a peak in TGF-β levels inside the wound around the fifth day. It is interesting to note that the parameter variations chosen for our sensitivity analysis affected the amount of TGF-β in the wound, but had very little effect on the time at which the peak occurred.
— Given the other parameters, collagen synthesis rates by fibroblasts defined in appendix A.4 were set to produce healing of the wound within a two-week time frame with the baseline parameters.
Appendix B. Numerics
B.1. Description of numeric procedure
The set of coupled equations describing the species in the model are integrated using fully explicit in time (Euler) integration due to the stochastic terms in the cell equations. A time step of Δt=10−3 hours was chosen to ensure the stability of the finite-volume solution of the chemical PDEs.
The diffusion equations for chemical species are solved on a regular grid using the finite-volume method. The fibre species are updated on the same mesh. The full algorithm for time stepping the solution is outlined below.
- Initialization
- Generate Eulerian mesh used for chemical and fibre species.
- Set chemical and fibre species to initial values.
- Populate the unwounded region with cells according to initial cell distribution profile.
- Interpolation
- Interpolate cell weights to Eulerian mesh (see appendix B.3).
- Interpolate continuous fibre and chemical values to each cell position.
- Chemical species update
- Update TGF-β source term for production by macrophages.
- Update tPA source term associated with arterial release at wound perimeter, and production during fibrin decomposition.
- Calculate TGF-β and tPA diffusion coefficients as functions of fibrin density.
- Cell update
- For each cell, calculate speed, s, a function of TGF-β concentration and ECM density (see appendix A.5).
- For each cell, search list of neighbour cells and adjust speed and direction to reflect any collisions.
- For each fibroblast, check whether conditions are met for proliferation.
- Integrate
- Integrate (update) cell position.
- Integrate cell receptor and chemotactic bias differential equations.
- Add new fibroblasts associated with proliferation.
- Integrate chemical species using finite volume and a Euler step.
- Integrate fibre species using Euler step.
Go to step (b).
B.2. Streamline interpolation
Each of the streamlines is seeded at a starting point x 0=x(0) in the direction of predominant fibre orientation at that point v(0), then integrated numerically so that
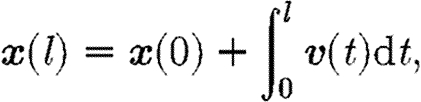 |
B1 |
where l is arc length and the streamline orientation v(l) is defined by
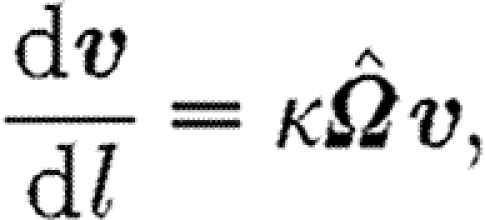 |
B2 |
and  is the normalized (length-preserving) fibre orientation tensor at x(s). The parameter κ, set to κ=1 for generating the images in this paper, affects the sensitivity of the streamline curvature.
Unlike normal streamlines, the pseudo-streamlines can cross paths. Streamlines are more likely to cross as the isotropy of the field increases (see figure 2
b for an image of an isotropic field). In anisotropic fields, the lines tend to align with the degree of alignment dependent on the extent of the anisotropy (see figure 2
a for an example of aligned streamlines in a uniformly anisotropic field). When visualizing fields with large degrees of local and global anisotropy, artefacts occur when a grid of regularly spaced seed points is used. To avoid these artefacts, small random perturbations are made to the otherwise regularly spaced x
0. The perturbations are vectors of fixed length, ‖p‖=ϵ for a user-defined value of ϵ, of random orientation, such that the perturbed seed point for integration is  .
.
B.3. Interpolation between cells and continuous variables
In the hybrid framework, fibrous networks and chemicals are modelled with continuous variables defined everywhere on the domain (the orientation tensor and concentration, respectively). On the other hand, individual cells are defined as discrete individuals, which are free to move around the domain. Interpolation is required to calculate both the values of the continuous variables at the centre of each cell, and to determine the values of the combined cell weight functions at each point on the Eulerian mesh.
The continuous variables are discretized on a regular Eulerian mesh, with a separation distance between mesh nodes of 5 μm. Each cell occupies a disc on the domain, but for cell-based calculations, single values, such as cytokine concentrations, are required. These are calculated at the centre of the cell using a bilinear interpolation of the continuous variable.
Cells contribute to the source terms of the PDEs that describe the time evolution of the continuous species. For example, the rate of TGF-β synthesis by an individual macrophage is defined as a scalar value, r Mt in (A 2). For integration of the continuous species, these single values need to be interpolated from the scattered cell centres onto the Eulerian mesh.
Dallon (2000) investigated such cell-to-mesh interpolation. There the support of the cell was either a Dirac delta function or the same as the internodal distance on the mesh. However, in our model, the cells have an area significantly larger than the internodal distance, which acts as the support for the interpolation function. To describe such a support, we define the weight function w(r) such that
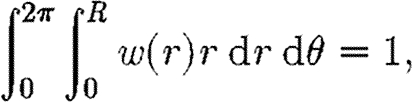 |
B3 |
where R is the cell radius and r is the distance from the centre of the cell. The weight function varies linearly from the centre of the cell to the edge
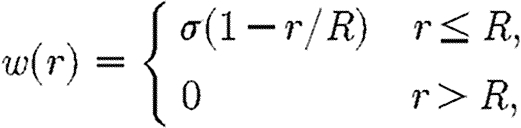 |
B4 |
where σ=3/(πR 2) is chosen such that (B 3) is satisfied.
Thus, the total contribution to the source term for an entire cell population of size N at any point x∈Ω, where the contribution from each individual cell is the scalar value s i, is
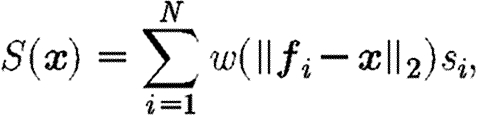 |
B5 |
where f i is the centre of each cell and s i is the scalar contribution of each cell to the source term.
References
- Adams J. J. 1997. The cell kinetics of murine incisional wound healing. PhD thesis, University of Manchester.
- Barocas V. H., Tranquillo R. T.1997An anisotropic biphasic theory of tissue-equivalent mechanics: the interplay among cell traction, fibrillar network deformation, fibril alignment, and cell contact guidance. J. Biomech. Eng. 119, 119–137. [DOI] [PubMed] [Google Scholar]
- Bellemare J., Roberge C. J., Bergeron D. L., Lopez-Vallé C. A., Roy M., Moulin V. J.2005Epidermis promotes dermal fibrosis: role in the pathogenesis of hypertrophic scars. J. Pathol. 206, 1–8. 10.1002/path.1737 [DOI] [PubMed] [Google Scholar]
- Cruywagen G. C., Murray J. D.1992On a tissue interaction model for skin pattern formation. J. Nonlin. Sci. 2, 217–240. 10.1007/BF02429856 [DOI] [PubMed] [Google Scholar]
- Dallon J. C.2000Numerical aspects of discrete and continuum hybrid models in cell biology. Appl. Numer. Math. 32, 137–159. 10.1016/S0168-9274(99)00021-5 [DOI] [Google Scholar]
- Dallon J. C., Sherratt J. A., Maini P. K.1999Mathematical modelling of extracellular matrix dynamics using discrete cells: fiber orientation and tissue regeneration. J. Theor. Biol. 199, 449–471. 10.1006/jtbi.1999.0971 [DOI] [PubMed] [Google Scholar]
- Dallon J. C., Sherratt J. A., Maini P. K., Ferguson M.2000Biological implications of discrete mathematical model for collagen deposition and alignment in dermal wound repair. IMA J. Math. Appl. Med. Biol. 17, 379–393. 10.1093/imammb/17.4.379 [DOI] [PubMed] [Google Scholar]
- Dallon J. C., Sherratt J. A., Maini P. K.2001Modeling the effects of transforming growth factor-β on extracellular matrix alignment in dermal wound repair. Wound Repair Regen. 9, 278–286. 10.1046/j.1524-475X.2001.00278.x [DOI] [PubMed] [Google Scholar]
- Dickinson R. B., Guido S., Tranquillo R. T.1994Biased cell migration of fibroblasts exhibiting contact guidance in oriented collagen gels. Ann. Biomed. Eng. 22, 342–356. 10.1007/BF02368241 [DOI] [PubMed] [Google Scholar]
- Ferguson M., O'Kane S.2004Scar-free healing: from embryonic mechanisms to adult therapeutic intervention. Phil. Trans. R. Soc. B. 359, 839–850. 10.1098/rstb.2004.1475 [DOI] [PMC free article] [PubMed] [Google Scholar]
- Friedl P., Znker K. S., Brcker E. B.1998Cell migration strategies in 3-d extracellular matrix: differences in morphology, cell matrix interactions, and integrin function. Microsc. Res. Tech. 43, 369–378. 10.1002/(SICI)1097-0029(19981201)43:5%3C369::AID-JEMT3%3E3.0.CO;2-6 [DOI] [PubMed] [Google Scholar]
- Kim Y., Stolarska M. A., Othmer H. G.2007A hybrid model for tumor spheroid growth in vitro I: theoretical development and early results. Math. Models Methods Appl. Sci. 17, 1773–1798. 10.1142/S0218202507002479 [DOI] [Google Scholar]
- McDougall S., Dallon J., Sherratt J., Maini P.2006Fibroblast migration and collagen deposition during dermal wound healing: mathematical modelling and clinical implications. Phil. Trans. R. Soc. A. 364, 1385–1405. 10.1098/rsta.2006.1773 [DOI] [PubMed] [Google Scholar]
- McGrath M. H., Simon R. H.1983Wound geometry and the kinetics of contraction. Plast. Resconstr. Surg. 72, 66–72. 10.1097/00006534-198307000-00015 [DOI] [PubMed] [Google Scholar]
- Murray J. D.2003Mathematical biology II: spatial models and biomedical applications New York, NY:Springer [Google Scholar]
- Olsen L., Maini P. K., Dallon J. C., Sherratt J. A.1998Mathematical modelling of anisotropy in fibrous connective tissue. Math. Biosci. 158, 145–170. 10.1016/S0025-5564(99)00005-X [DOI] [PubMed] [Google Scholar]
- Pizzo A. M., Kokini K., Vaughn L. C., Waisner B. Z., Voytik-Harbin S. L.2005Extracellular matrix (ECM) microstructural composition regulates local cell-ECM biomechanics and fundamental fibroblast behavior: a multidimensional perspective. J. Appl. Physiol. 98, 1909–1921. 10.1152/japplphysiol.01137.2004 [DOI] [PubMed] [Google Scholar]
- Rawlins J. M., Lam W. L., Karoo R. O., Naylor I. L., Sharpe D. T.2006Quantifying collagen type in mature burn scars: a novel approach using histology and digital image analysis. J. Burn Care Res. 27, 60–65. [DOI] [PubMed] [Google Scholar]
- Stokes C. L., Lauffenburger D. A., Williams S. K.1991Migration of individual microvessel endothelial cells: stochastic model and parameter measurement. J. Cell Sci. 99, 419–430. [DOI] [PubMed] [Google Scholar]
- Tranquillo R. T., Murray J. M.1992Continuum model of fibroblast-driven wound contraction: inflammation-mediation. J. Theor. Biol. 158, 135–172. 10.1016/S0022-5193(05)80715-5 [DOI] [PubMed] [Google Scholar]
- Whitby D. J., Ferguson M. W. J.1991The extracellular matrix of lip wounds in fetal, neonatal and adult mice. Development. 112, 651–668. [DOI] [PubMed] [Google Scholar]
- Yang L. J., Qiu C. X., Ludlow A., Ferguson M. W. J., Brunner G.1999Active transforming growth factor-beta in wound repair—determination using a new assay. Am. J. Pathol. 154, 105–111. [DOI] [PMC free article] [PubMed] [Google Scholar]