Abstract
Insects have evolved diverse and delicate morphological structures in order to capture the inherently low energy of a propagating sound wave. In mosquitoes, the capture of acoustic energy and its transduction into neuronal signals are assisted by the active mechanical participation of the scolopidia. We propose a simple microscopic mechanistic model of the active amplification in the mosquito species Toxorhynchites brevipalpis. The model is based on the description of the antenna as a forced-damped oscillator coupled to a set of active threads (ensembles of scolopidia) that provide an impulsive force when they twitch. This twitching is in turn controlled by channels that are opened and closed if the antennal oscillation reaches a critical amplitude. The model matches both qualitatively and quantitatively with recent experiments: spontaneous oscillations, nonlinear amplification, hysteresis, 2 : 1 resonances, frequency response and gain loss owing to hypoxia. The numerical simulations presented here also generate new hypotheses. In particular, the model seems to indicate that scolopidia located towards the tip of Johnston's organ are responsible for the entrainment of the other scolopidia and that they give the largest contribution to the mechanical amplification.
Keywords: active hearing systems, biomechanics, synchronization
1. Introduction
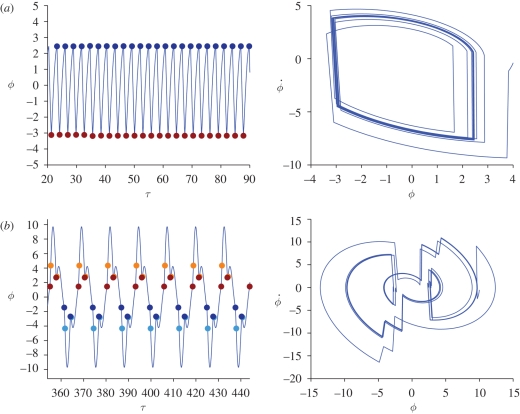
Hearing organs are deemed to operate at the lower limit of what is physically possible. In effect, the ears of animals, vertebrates and insects alike can detect incoming energy near that of thermal noise (Bialek 1987; Robert & Göpfert 2002). To capture the inherently low energy of a propagating sound wave, insects have evolved very diverse and delicate morphological structures (Robert & Hoy 2007). For example, in grasshoppers and moths, energy capture is first mediated by an eardrum, similar to that of vertebrate ears, that converts the acoustic energy of an impinging sound wave into mechanical energy to be conveyed to the mechanosensory receptor cells. In mosquitoes and fruitflies, this task is fulfilled by the animal's antennae. Quite remarkably, the capture of acoustic energy and its transduction into neuronal signals are assisted by the active mechanical and metabolic participation of the cells responsible for the capture of mechanical energy, the mechanoreceptor neurons (Göpfert & Robert 2007). This active sensing process is analogous to that found in vertebrates (Hudspeth 1997) and serves to enhance auditory capacity, thus improving sensitivity and frequency selectivity. In mosquitoes, the antennal shaft constitutes the proper acoustic receiver; it is sensitive to the particle velocity component of the sound field. Antennal hearing organs have recently been shown to feature several nonlinear response characteristics (Jackson & Robert 2006 and references therein) that are deemed to betray the presence of active mechanisms. In effect, because of the experimental amenability, mosquitoes can be regarded as model organisms to study in detail the mechanical and neuronal mechanisms at work in the sense of hearing.
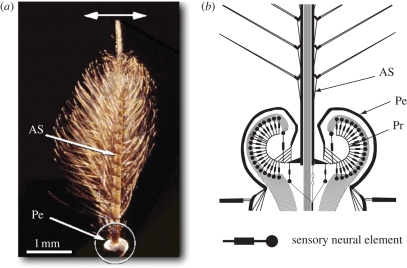
Mosquitoes are generally sensitive to incident sounds in the frequency range between 300 and 500 Hz. For the Tanzanian species Toxorhynchites brevipalpis, best sensitivity has been shown to be between 360 and 400 Hz, mostly as a result of the mechanical resonance of the antenna (Göpfert & Robert 2000), which responds to impinging sound like a rigid body at these frequencies. Analysis of the deflection shapes of mosquito antennae shows that the antenna acts like a swaying rod with a rotational spring attached at its base. The rotational spring stiffness is in effect significantly lower than the bending stiffness of the antennal shaft itself. The base of the antenna, called the pedicel and containing the mechanosensory Johnston's organ (figure 1), constitutes a joint within which the shaft is articulated; nearly all insect antennae have this structure. The internal structure is much like an umbrella, with the antennal shaft decorated with nearly 60 radial spokes. The spokes are of cuticular origin, yet their exact composition and mechanical characteristics remain uninvestigated. Importantly, they are the link between the antennal acoustic receiver and the sensory neurons detecting sound-induced vibrations. Like an upturned umbrella, Johnston's organ has a radial symmetry, implying that sound incident from any direction can elicit a mechanical response and a neuronal activation. The exact direction sensitivity of mosquito hearing organs is not known, yet the 60-fold radial symmetry suggests the potential for an inherent directionality of at least 6°.
Figure 1.
Morphology of the antennal hearing organ of the mosquito Toxorhynchites brevipalpis. (a) The male antennal shaft (AS) is approximately 3.5 mm long and bears numerous fine hairs. At the base of the shaft, the pedicel (Pe) contains Johnston's organ, where mechanosensory neurons receive sound-induced vibrations. The main mode of vibration of the antenna is an oscillation (horizontal arrow). (b) Schematic cross-section of the mosquito pedicel (enlarged circled area in a) highlighting the structure of Johnston's organ, the site of the mechanosensory neuronal elements. Oscillations of the antennal shaft are transmitted to the mechanosensory neurons through curved prongs (Pr) connected to the base of the shaft.
The analysis presented here concerns the behaviour of one pair of spokes lining up across the diameter of Johnston's organ, representing both the effects of acoustic forcing coming from one direction only and a natural situation. This simplification enables us to neglect the radial symmetry of the problem. The anatomical cellular arrangement along a radially symmetrical pair of spokes is depicted schematically in figure 1. At approximately evenly spaced distances along the radius, the mechanically sensitive multicellular units, fine thread-like structures known as scolopidia, are connected to the spoke trasversely. The essential element of each scolopidium is either one or a pair of mechanosensory neurons, which transduce the mechanical translation of the spoke into an electrical signal. It has been shown that the mechanical response of the mosquito auditory system displays a series of nonlinear characteristics that are the hallmark of active auditory mechanics (Göpfert & Robert 2003 and references therein). By analogy to the fruitfly Drosophila melanogaster, the mosquito auditory organ has been suggested to employ the active, contractile properties of scolopidial mechanosensory neurons to enhance acoustic sensitivity and frequency selectivity. The concomitant function of the auditory sensory neurons as sensors and actuators is unique among animals (Eberl 1999) and the mechanisms subtending such functions remain elusive.
In mammalian hearing systems, in which the vibrations are experienced by a membrane rather than by an antenna, motile cells are believed to be responsible for the active behaviour (Ashmore & Gale 2004; Fettiplace & Hackney 2006); hair cells can entrain and their collective, self-sustained motion is capable of influencing the membrane dynamics (Hudspeth 1985; Howard & Hudspeth 1987; Camalet et al. 2000; Nadrowski et al. 2004). Hair cells, cilia and beating axonemes have been previously modelled and analysed (Lindemann 1994; Camalet & Jülicher 2000; Dillon & Fauci 2000; Riedel-Kruse et al. 2007): a key feature of such models is the ability of the ciliar units to induce forces.
The working hypothesis serving as a premise to the work presented here is that each prong and associated series of scolopidial units are capable of acting in a dual capacity, sensing nanoscale mechanical vibrations on the one hand and, crucially, generating and transmitting a force to the spoke and the antennal shaft on the other.
The purpose of this study is the development of a simple mathematical model of the process of hearing in mosquitoes. Specifically, a formal and predictive model is developed to explain the active mechanisms at work in the auditory system of T. brevipalpis. We seek to extend the work of Jackson et al. (in press), which introduced a plausible model in the form of a complex Ginzburg–Landau equation that was able to capture the features present in experimental data. The model we propose includes details at a microscopic level, rather than starting from an aggregated macroscopic viewpoint. Specifically, we will include in our model an array of a large number of individual sensory neurons, each with its own dynamics, and couple them to a model of the antennal shaft.
The paper is structured as follows: in §2, we give an overview of the key findings obtained with our model, which is derived in detail in §3. In §4, we identify plausible parameter ranges for the model. Numerical simulations and comparisons with experimental results are given in §5. In §6, we give physical interpretations of the results and comment on possible model refinements.
2. Overview of key findings
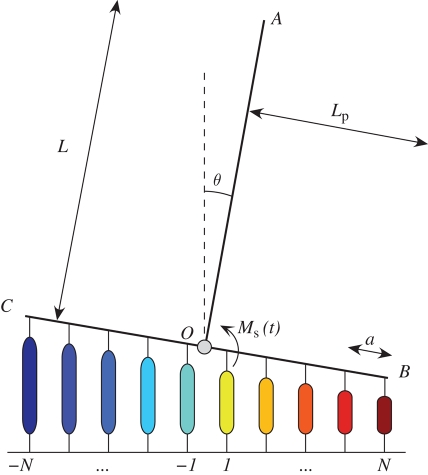
In this section, we will give a brief account of the main results obtained by our model. Even though a detailed derivation can be found in §3, we will anticipate here that the model is based on three ingredients (see figure 2 for reference): the antenna (OA), the prong (BOC) and the threads (bundles of scolopidia, colour coded in the schematic). The antenna and the prong form a rigid body, pivoting around O. The external sound field (torque Ms in figure 2) acts on the antenna, inducing oscillations on the prong. The sound-induced antennal oscillations compress the threads, sitting just underneath the prong. When the compression is above a certain threshold, the threads respond with an impulsive force (a twitch), influencing the antennal dynamic. Starting from these basic assumptions, the model agrees both quantitatively and qualitatively with a series of experimental results.
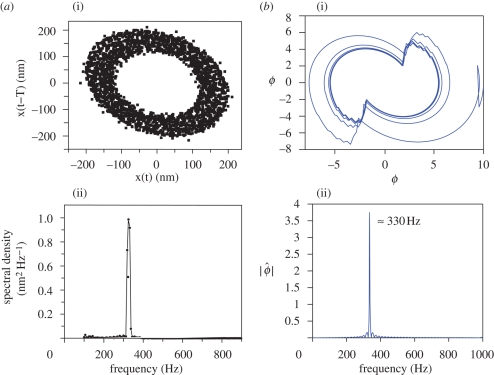
Free oscillations. In the absence of external forcing, some specimens of mosquito exhibit free oscillations at around 330–350 Hz and variable amplitudes. The self-oscillations single out the proper frequency of the system Ω. In figure 3, we show that the model can support free oscillations at Ω ≈ 330 Hz. Such oscillations are robust to perturbation in the damping and stiffness of the antenna (parameters δ and κ in table 1). Experiments suggest that not all individuals feature free oscillations. This is confirmed by numerical simulations where we find that free oscillations are not robust to perturbations of the parameter controlling the thread's charge rate: if the threads are too responsive or not responsive enough, free oscillations disappear (see figure 4 and related comments on the parameter λ2).
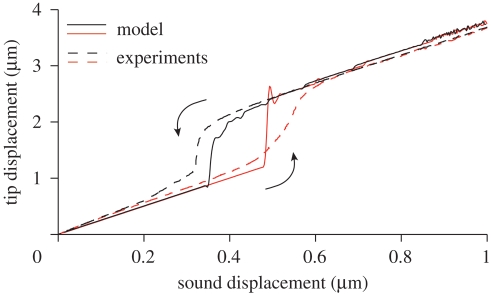
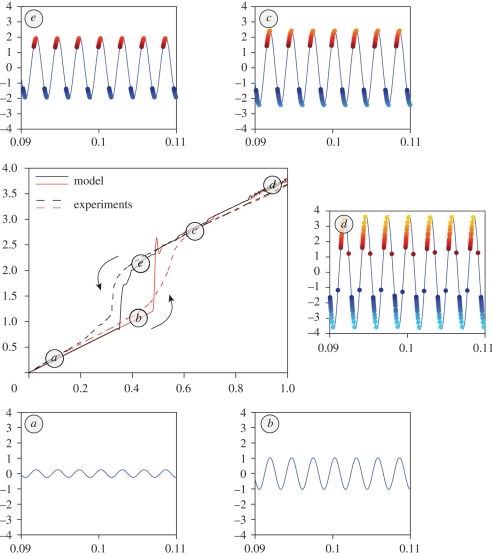
Nonlinear amplification and hysteresis. When the animal is subject to harmonic forcing with constant frequency ωs and slowly varying amplitude A, the antenna exhibits nonlinear amplification at A ≈ 0.4 µm and saturates towards A ≈ 1.0 µm. This process is also found to be hysteretic. In figure 5, it is shown that the model matches the experiments remarkably well. A detailed explanation of how hysteresis is supported by the model is given in figure 6.
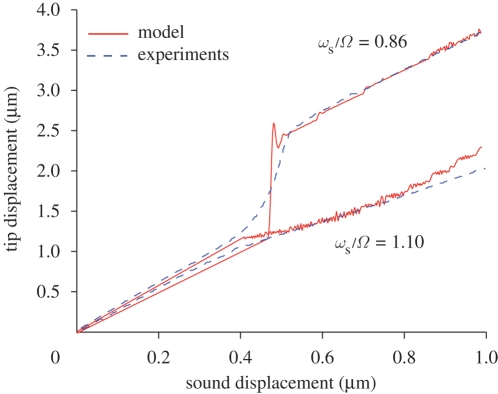
Amplification loss owing to changes in the forcing frequency. Experiments suggest that the antenna features amplification when the stimulus frequency is slightly below resonance, ωs/Ω < 1. Figures 7 and 8 confirm that the model agrees with the experiments both qualitatively and quantitatively.
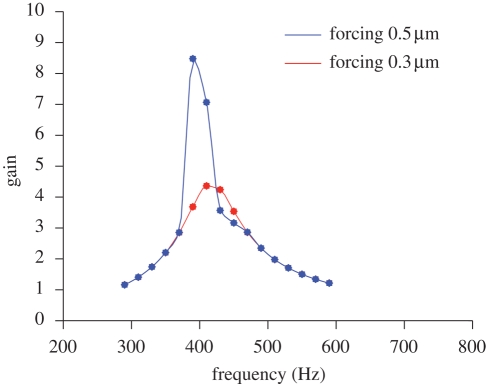
Gain–frequency response. When studying the antennal gain as a function of ωs, we see that, after transition (at A ≈ 0.4 µm), the gain spectrum has a narrower bandwidth and a much sharper amplification (figure 9). This is in excellent agreement with the experiments reported in Jackson et al. (in press).
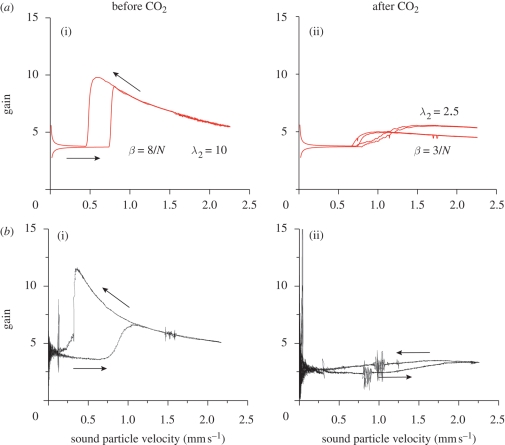
Amplification loss owing to hypoxia. When the animal is subject to hypoxia (through CO2), the antenna loses both amplification and hysteresis. This is reflected by the model as well (figure 10) if we modify the thread responsiveness (parameter λ2) or exerted force (parameter β).
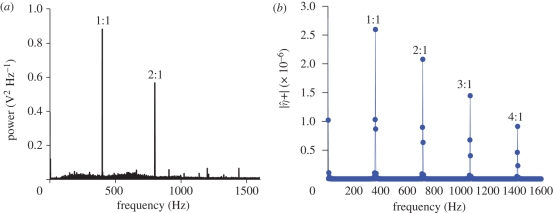
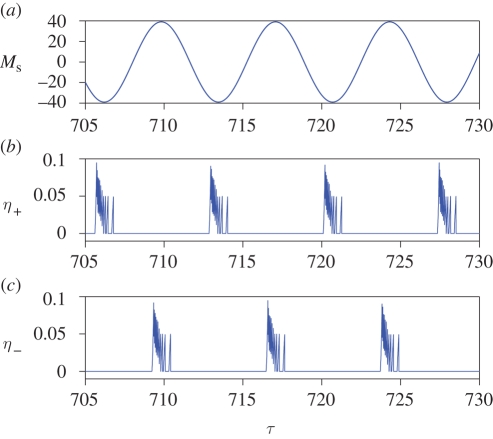
2 : 1 resonance of the compound action potential. In experiments, it is possible to measure the compound action potential of the neurons at the base of the antenna. It has been observed (Jackson et al. in press) that the compound action potential signal has a frequency component at twice the forcing frequency ωs. In the model, we can define an averaged function of the thread activity. In figure 11, we show that the thread activity in our model also has this double frequency.
Figure 2.
Schematic of one radial slice of the mosquito antenna and its support structure (not to scale). Here, the flagellum is modelled by a rigid rod (OA) of length L that is rigidly attached at O to a rigid prong (BC) of total length 2aN. At regular intervals along the prong, 2N threads (colour coded for later visualization purposes) are attached with regular separation a. The external sound field is modelled as an applied moment Ms.
Figure 3.
Free oscillations of the antenna: experimental results (a) (reproduced with permission from Jackson (2007)) versus numerical simulations (b). Parameters for the numerical simulations are δ = 0.5, κ = 1.0625, α = 0, λ1 = 2, λ2 = 4, Δ = 2.5, σ = N = 10 and β = 1/N. (a(i), b(i)) Phase plane representation of the free oscillations. (a(ii), b(ii)) Power spectrum of the oscillations; the frequency peak is located at approximately 330 Hz.
Table 1.
Physiologically plausible values/ranges of the non-dimensionalized parameters of the mosquito hearing model.
| interpretation | rescaled parameter | values |
|---|---|---|
| antenna damping | δ | [0.20,0.50] |
| antenna stiffness | κ | [1.01,1.06] |
| sound-evoked forcing | α | [0,78.75] |
| thread leak rate | λ1 | 2 |
| thread charge rate | λ2 | [4,10] |
| refactoriness | Δ | 2.5 |
| thread charge threshold | σ | [N,120 N] |
| thread forcing | β | [10/N,100/N] |
Figure 4.
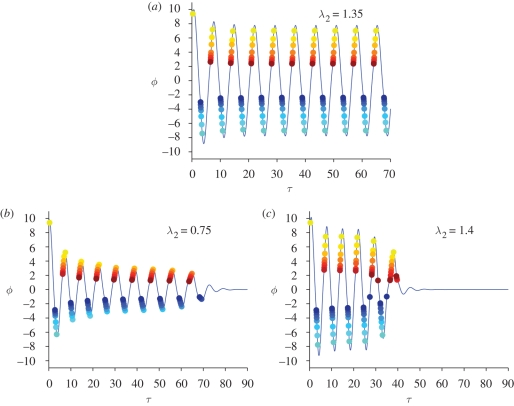
Dependence of free oscillations on the charging constant λ2. (a) A value of λ2 for which free oscillations are supported; each thread twitches once per period. (b) If λ2 is too small, the threads take a long time to charge; some threads fail to twitch and the oscillations die out. (c) If λ2 is too high, the outer threads have the chance to twitch twice per period, which has a destructive effect on the oscillations.
Figure 5.
Hysteresis diagrams: numerical simulation (solid lines) compared with experimental results in Jackson et al. (in press) (dashed lines). In both settings, the amplitude of the applied sound field is increased (red) and then decreased (black) quasi-statically. The amplitude of the oscillations is plotted on the vertical axis. Hysteresis is found when the excitation frequency is slightly below the natural frequency of the system. Numerical parameters used for the simulations: δ = 0.2, κ = 1.01, λ1 = 2, λ2 = 10, Δ = 2.5, σ = 120 N, N = 20, β = 8/N, ωs/Ω = 0.87.
Figure 6.
Different stages of the hysteresis diagram. In the central panel, we have reproduced the hysteresis diagram of figure 5. (a and b) The threads are quiescent, as their geometric activation threshold σ has never been reached. (c) The threads are all active, and they induce nonlinear amplification. (d) At saturation, threads ± N twitch constructively twice per period. (e) In this regime, nonlinear amplification is sustained by a low number of threads.
Figure 7.
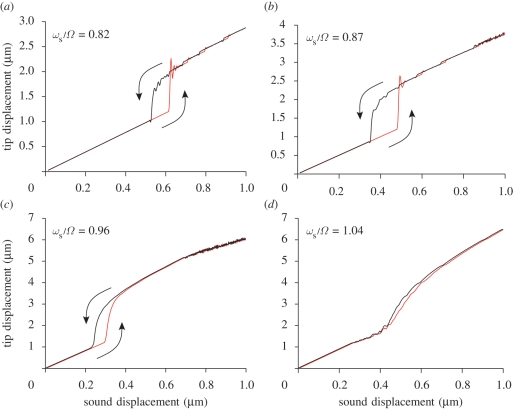
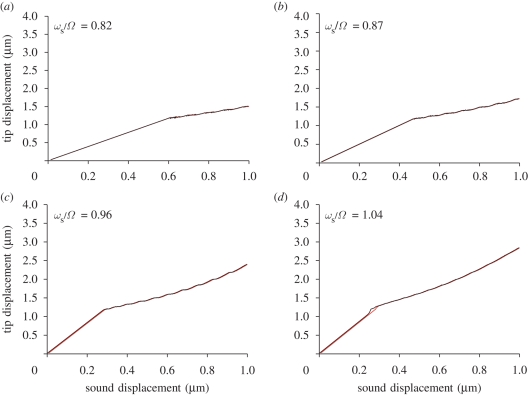
(a–d) Hysteresis diagrams for different values of the ratio ωs/Ω. Hysteresis is found when the excitation frequency is slightly below the resonant frequency of the system. Numerical parameters as in figure 5.
Figure 8.
Antennal response for different values of frequency stimulus: experimental (dashed lines) versus numerical computations (solid lines). Two stimuli of increasing amplitude and different frequencies are applied. When stimulated below resonance, amplification takes place. For a stimulus above frequency, there is no amplification. Numerical parameters as in figure 5.
Figure 9.
Gain as a function of frequency for two different amplitudes of the stimulus. After transition, the gain spectrum has a narrower bandwith and sharper amplification. Numerical parameters as in figure 5.
Figure 10.
Effect of hypoxia on the nonlinear dynamics of the antenna: numerical simulation (a) and experimental results (b) (Jackson 2007). In both cases, the stimulus is an amplitude-modulated sound with sub-resonant frequency ωs/Ω = 0.87. The physiologically robust animal (a(i), b(i)) shows amplification and hysteresis. Subjecting the animal to hypoxia (through CO2) drastically affects both features. In the model, we have simulated hypoxia via reducing the threads forcing (a(i), b(i) β = 8/N, a(ii), b(ii) β = 3/N) or by increasing the threads' charging time (a(i), b(i) λ2 = 10, a(ii), b(ii) λ2 = 2.5). Numerical parameters as in figure 5.
Figure 11.
(a) Power spectrum of the experimental neuronal response (data from Jackson (2007)). (b) Discrete Fourier transform of the signal η + (τ). The 1 : 1 and 2 : 1 peaks are in very good agreement. Higher order resonances, if present in the real system, could be inaccessible in the experiments. The Fourier transform has been computed with a very small sampling frequency: as a result, the peaks in the spectrum are well refined. Numerical parameters as in figure 5.
3. Model development
3.1. Simplified mechanical model
In this section, we introduce the model we chose to represent the mechanosensory portion of the mosquito hearing system, namely Johnston's organ, that serves to detect and actuate the motion of the antenna. Our study is built upon the experimental work of Jackson (2007), which identifies the key features we seek to model: namely free oscillations, nonlinear amplification and bistability and 2 : 1 resonance. Jackson et al. (in press) also proposed a macrosopic model of the mosquito hearing system, which coupled a linear oscillator representing the antenna to a space-independent complex Ginzburg–Landau equation representing the ensemble of scolopidial units. While their modelling study could qualitatively predict the experimental data, the question we shall address is how to include microscopic details, such as the contributions of individual scolopidial units, in a model of the mosquito hearing system. This will enable us not only to incorporate measurable physiological parameter values into the model, but also to pose questions about the function of the scolopidia. Furthermore, questions such as the emergence of synchrony between groups of scolopidia can only be answered with a microscopic approach.
For the frequency range in which the mosquito seems most sensitive (in the range 8–500 Hz), the flagellum is known to respond to the external sound field predominantly in a rigid body mode (Göpfert et al. 1999). That is, the structure inside the pedicel, to which the flagellum is attached, acts like a rotational spring of significantly lower stiffness than that of the flagellum itself.
In what follows we shall suppose that the sound field comes from a single well-defined direction and that the antenna undergoes planar motion. Moreover, for simplicity, we suppose that just a single prong is active. This is, of course, a simplification, which enables us to factor out the radial symmetry of the problem, and in reality our single prong may represent a small radial sector of prongs.
The structure along each prong is as depicted schematically in figure 2. At approximately evenly spaced distances along the radius, structures known as scolopidia are connected to the prong in a direction transverse to the basal plate. The other end of each scolopidium is attached to another fine structure, composed of a neuron surrounded by a sheath of dynein, a contractile material. Experimental evidence (Robert & Göpfert 2002; Göpfert & Robert 2007) suggests that these scolopidium–dynein–neuron structures are capable of both passive translation of the antenna motion into an electrical signal and active mechanical amplification of the antenna motion. Each prong has several thousand of these mechanosensory units attached (the total of 16 000 inside Johnston's organ is comparable to the number of active units inside the human cochlea). However, for the sake of computational convenience, we chose to aggregate groups of Nb of these scolopidium–dynein–neuron structures together into a smaller number of units, henceforth referred to as threads. Each prong has 2N threads (each one containing Nb scolopidium–dynein–neuron structures), equally distributed along the prong with separation a, given by
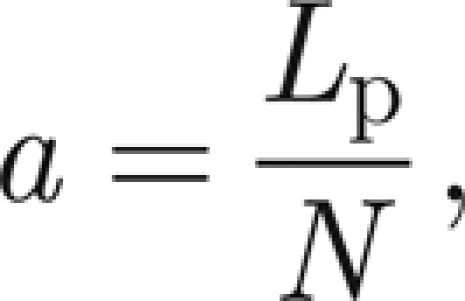 |
where Lp is the length of the prong.
In truth, the physiology is more complex than we have just described (figure 1). In particular, the prongs are not simple linear structures, but are instead somewhat curved. Specifically, each prong curves upwards (i.e. towards the direction of the axis of the antenna) with increasing radial distance from the base of the flagellum. The orientation of the threads varies accordingly, so that they are locally approximately perpendicular to the tangent plane of the prong family. Also, the lengths of the threads vary greatly, with those nearer the base of the flagellum typically being shorter. There are also different types of scolopidia found in Johnston's organ, differing subtly in their physiology (Clements 1963), and it is not clear whether all act both passively and actively. We shall assume for simplicity that each thread is capable of acting in this dual capacity role and, crucially, that each thread along the radial prong is capable of transmitting a force to the antenna.
In summary, we have simplified the geometry of Johnston's organ, composed of the antenna and an ensemble of scolopidia and neurons, considerably. We now proceed to discuss the details of the dynamics, both passive and active. The key aspect of the model is the way in which the flagellum responds to the external sound field, and the subsequent two-way interaction between the antenna and the threads, transmitted via the prong. The threads respond to the motion of the prong, with their own dynamics, and are further able to exert a force back to the antenna ensemble. We shall discuss these issues in more detail below.
3.2. Macroscale modelling
We suppose for simplicity that the prong and flagellum together act as a single rigid body, whose motion we model as a damped rotational spring, with stiffness to inertia ratio k, and viscous proportional damping, with ratio c. Thus the equation of motion for the angular inclination of the antenna from its (vertical) rest state can be written as
 |
3.1 |
where dots denote differentiation with respect to time, J is the moment of inertia of the antenna and Mext(t) is an external applied moment. When acting purely passively, Mext comprises the applied moment Ms(t) on the structure that is transduced from the external sound field. In general, though, for a healthy insect, there will be a contribution to Mext(t) from the active response of each of the 2N threads that are connected to the prongs as discussed earlier. That is, we suppose
 |
3.2 |
where mi, i = 1, … , N, are the moments supplied by each of the 2N threads.
In order to complete the model of the antenna, we propose an expression for the applied external sound field. Let θ̇s(t) be the angular velocity of the sound field in the proximity of the antenna. In the absence of forcing and neglecting the coupling with the threads, we have
 |
When the antenna is subject to the external sound field, we amend the previous equation to be
 |
This implies that the antenna experiences a damping proportional to the relative velocity between the flagellum itself and the external field θs (motivated by the fluid-induced stress forces of flow moving past a cylindrical obstacle derived by Stokes and reported in Humphrey et al. (1993)). In equations (3.1) and (3.2), this corresponds to the choice Ms(t) = cJθ̇s(t). Hence, if the external applied moment owing to the sound field, Ms, can be viewed as a superposition of M harmonics, it can be written as
 |
3.3 |
where Xj and Yj are constants. In equation (3.3), c has been replaced by a new parameter cs. In this way, we are able to independently vary the damping on the antenna (via changing c) and the forcing Ms (via changing cs).
In what follows, we will assume the sound to be a pure sinusoid with amplitude X0 and frequency ωs. This leads to our final expression for the external moment
 |
3.4 |
where L is the length of the antenna (figure 2).
3.3. Model of the threads
Given the absence of a detailed understanding of the function of the mechanosensory units in Johnston's organ, we shall take a very simple approach to their modelling. Since it is believed that antennal motion activates the scolopidium/neuron units and causes the firing of action potentials and the exertion of a force upon the antenna, we shall associate with each thread a potential ni that loads as a function of antennal displacement and dissipates through natural leakage. Furthermore, when the potential reaches a threshold, we shall say that a force is exerted on the antenna and that the potential is reset to its resting level. There will then follow a period of quiescence, before which the thread potential can begin to increase again.
Hence the model for each thread's potential is similar to that of an integrate and fire neuron (Tuckwell 1988), with the addition of force generation. It must be highlighted, though, that threads are intrinsically different objects from (bundles of) neurons, in that the former are capable of providing a mechanical force. To make this distinction clear, we will say that the thread twitches, rather than fires, when its potential reaches threshold. We discuss a more detailed physical interpretation of the threads in §6.
Assuming, for simplicity, that all threads have identical physical properties, the evolution of the potential ni of the ith thread (relative to its rest potential) is given by
| 3.5 |
until ni(t) = hi, the threshold for the ith thread, at time t = tij, at which time we say the thread twitches. At this time, the potential ni is instantaneously reset to zero and is forced to remain there for a time d, so that
| 3.6 |
whereupon the potential can begin to increase again, according to equation (3.5).
Here, l1 and l2 are positive constants representing the rate of leakage and charging, respectively, and d > 0 measures the refractory time following a twitch before charging can recommence (assumed to be identical for all threads). The function Θ(xi) represents the behaviour of an ion channel gate that opens when the extension (or compression) xi of the thread is sufficiently large, such that Θ = 0 for no stretch (gate closed) and Θ = 1 for sufficiently large extension (gate open). Here xi is measured with respect to a datum such that xi = 0 when the system is in equilibrium (i.e. when the prong is horizontal in the orientation depicted in figure 2). For simplicity, we shall assume that Θ is a simple switch, namely
 |
for some constant s > 0, where H is the Heaviside step function.
Now, from simple geometry, we have
since θ is small (the angular displacement is typically of the order 10−3 rad).
To close the model, we must make assumptions about how the threads act on the antenna. In other words, we must specify how mi(t) depends on the dynamics ni(t). We suppose that, when the ith thread twitches, it transmits an impulsive force to the antenna. In keeping with the assumption that the discharge Θ of the thread is a step function, we suppose that the impulse has infinitesimal duration when compared with the time constants of the input sound and the free dynamics of the antenna. For simplicity, we suppose that each thread transmits the same force f that, owing to the geometry, leads to a moment fai. Thus, we have
 |
Note that it is not clear physiologically whether the threads become active as a result of extension or compression. Furthermore, the sense of the force exerted with regard to the antenna (whether a positive or negative moment) is also a matter of debate. However, we can choose to explore these issues by simple changes of sign of parameters; an issue we shall explore further in §5.
3.4. Mosquito hearing model
Summarizing the information presented earlier, we can write a closed model for the mosquito hearing system
 |
3.7 |
 |
3.8 |
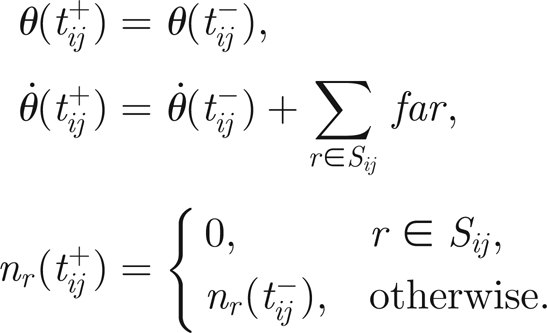
where a dot means differentiation with respect to time and tij is defined as the jth time at which thread ni reaches the threshold value h. For practical computations, the Dirac-δ functions are replaced by reset rules applied at t = tij. If we collect in
 |
the threads that twitched at time tij and denote the times immediately before and after twitching by tij±, then we have
 |
To see qualitatively how such a model can lead to amplification of ambient oscillations, consider an input with small amplitude M(t). This will lead to a forced response θ(t) that is also of small amplitude. If this amplitude θmax is less than N/a, then xi < s for all threads, and hence there is no active amplification. If M is of moderate amplitude so that 1/a < θmax < N/a, then those threads that are sufficiently far from the antenna will twitch and there can be an active amplification. However, there will be an upper saturation to the amount of amplification if θmax > N/a since then all threads twitch and further increase in θmax will not occur.
3.5. Rescaling
Given that the amplitude and time scales concerned are very small, it is convenient to rescale and non-dimensionalize the governing equations of motion (3.7) and (3.8). We therefore choose to rescale the angle θ, time t and neuron voltage ni with characteristic angle R, time T and voltage V scales, so that
where ϕ, τ and η are the dimensionless angle of the antenna, time and potential of thread i, respectively. Since the threshold of mosquito hearing is at an antenna tip displacement Lt ≈ 10 nm, and the antenna has length L ≈ 2 mm, the threshold angle is θ = arcsin(Lt/L) ≈ Lt/L, we choose
 |
It is convenient to rescale time using the natural frequency of oscillation of the antenna Ω, which is measured to be around 400 Hz (Jackson et al. in press), so
 |
The most obvious candidate for the scale constant of the thread potential is to use the reset threshold, so that
Therefore, if we replace the Dirac-δ functions by reset maps, the equations of motion become, for τij < τ < τi,j+1, j = 1,2, …
 |
3.9 |
 |
3.10 |
and, at τ = τij
 |
3.11 |
 |
3.12 |
 |
3.13 |
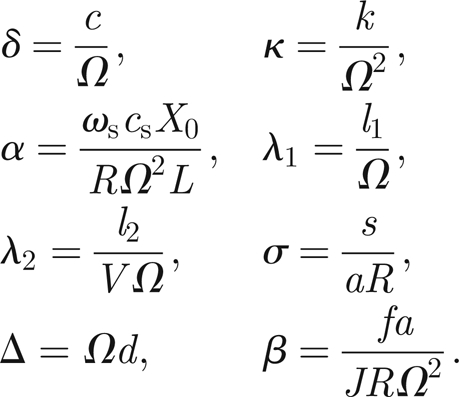
where prime denotes differentiation with respect to rescaled time, τ, and the dimensionless parameter values are given in terms of the original parameters and scale constants via
 |
4. Parameter values
It is important for any model to provide estimates of the sizes of the relevant parameters in the system, derived from direct measurements, or physiologically plausible estimates, where appropriate. The rescaled parameter values we have derived are summarized in table 1, and are derived in more detail.
4.1. Antenna damping and stiffness: δ and κ
The damping and stiffness values are linked to the natural frequency of the passive antenna system. It is possible to derive a simple equation involving κ and δ by noting that free oscillations (at frequency Ω) correspond to eigenmodes of the differential operator on the left-hand side of equation (3.7). We can solve the eigenvalue problem
 |
and find the eigenvalues to be
 |
Free oscillations at frequency Ω imply
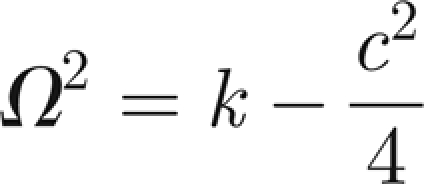 |
or, using the dimensionless parameters introduced in the previous section,
 |
This leads us to the desired relation between κ and δ
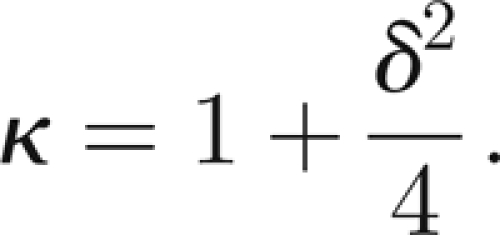 |
From experiments on free oscillations, it would seem that the passive damping is subcritical (δ < 1) and somewhat weak. We take δ ∈ [0.20,0.50], thus κ ∈ [1.01,1.06].
4.2. External sound field: α
We recall that the external sound field intensity is controlled by the non-dimensional parameter α introduced in equation (3.9) and defined as
 |
In the expression for α, some parameters are already determined: they are R ≈ 5 × 10⁻⁶, Ω ≈ 800π rad s−1 and L ≈ 2 mm. To compute α, we need to specify three other parameters that are characteristic of the external sound field, namely its damping coefficient δs, its frequency ωs and its amplitude X0. For the damping, we assume δs = 0.9 (almost all the sound field is intercepted by the antenna).
In experiments (Jackson et al. in press), the excitation frequency is usually below resonance, ωs = 700π rad s−1 (approx. 350 Hz), whereas the spatial displacements X0 vary between 0 and 1.0 µm. As a result, α can assume the values α ∈ [0,78.75].
4.3. Charge constants: λ1, λ2, Δ, σ
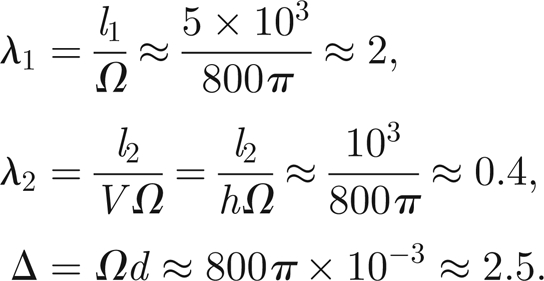
Owing to the lack of direct measurements of the detailed function of individual scolopidia and neurons inside Johnston's organ, there is a considerable degree of uncertainty with regard to all the thread parameters. However, it seems reasonable that the thread time scales (charge, decay and refactoriness) are all commensurate with the time scale of the antenna oscillation. Therefore, we choose, as an initial starting point, that the charge time, decay time and refactory period are all of the order of 1 ms, which gives rise to unscaled parameters given approximately by
 |
Therefore, the rescaled parameter values are given by
 |
However, we shall explore the consequences of variation of these quantities as part of our investigation.
Estimating that the threads' charge threshold is more speculative, threads must support both free oscillation and forced oscillation. In the regime of forced oscillations, the scolopidia provide nonlinear amplification when the tip displacement La is between 0.6 and 1.2 µm (Jackson 2007).
This suggests that the most sensitive threads (those furthest from the antenna, labelled ±N in figure 2) are active at the threshold angle θa
 |
and thus that
 |
so
 |
Therefore, we choose σ ∈ [60N,120N] when the antenna is subject to external sound fields.
On the other hand, there is certainly electrophysiological activity for very small antenna tip displacements (approx. 10 nm, in the free oscillation regime). This would suggest a threshold at σ = N.
4.4. Neural force constant: β
We recall that the threads force the antenna via the parameter β introduced in equation (3.12) and defined by
 |
4.1 |
where we have expressed f as the product of F, the force applied by a single scolopidium, and Nb the number of scolopidia contained in each bundle. The force F is again somewhat difficult to estimate, as there are no direct experimental measurements, but it seems plausible that F is of the order of 1 pN to 1 nN. We determine a via geometrical considerations (figure 2) expressing it as the ratio between the prong half-width, Lp ≈ 200 µm, and the number of threads N, and choose Nb = 200.
Finally, we need to calculate J, the moment of inertia of the antenna/prong system. Assuming that the vast majority of the mass is in the antenna (of length 2 mm, compared with 200 µm for the prong) and that the antenna is rod-shaped, pivoting about its base, we have
 |
where M is the antenna mass, and ρ, r and L its density, radius and length, respectively. We have that ρ = 1100 kg m−3 (Humphrey et al. 1993), L = 2 mm and r ≈ L/100, so
 |
Assuming that there is extra mass, and hence inertia, in the hairs of the male antenna, we take J ≈ 10−14 kg m2. We can then use expression (4.1) for β and, owing to the uncertainty of F, we have β ∈ [10/N,100/N].
5. Simulations
Having derived physiologically plausible parameter values for our simple mosquito hearing model (3.9)–(3.14), we are now in a position to investigate its behaviour numerically and compare with experimental data. For the sake of clarity, we re-write the equations here: for τij < τ < τi,j+1, j = 1,2, … , we have
 |
5.1 |
 |
5.2 |
and, at τ = τij,
 |
5.3 |
 |
5.4 |
 |
5.5 |
We have simulated the mosquito model via an explicit fourth-order Runge–Kutta scheme. The reset times τij have been determined as follows: at each discrete time τk, we select those variables ηi that have stepped above the threshold, and then set τ− = τk and τ+ = τk + Δτ, where Δτ is the simulation time step.
We have performed several different types of investigation, motivated by the experimental observations described in §1, the results of which are reported in §§5.1 and 5.2. First, we explore the capacity of the model to exhibit self-oscillations (which also permits an exploration of the variation of thread parameters). We then go on to explore the capacity of the model to exhibit the nonlinear amplification and hysteresis seen in experiments and again explore the dependence on parameter values in the model.
In what follows, we denote the mosquito model (5.1)–(5.5) as the compress and pull model. The reason for this is that we have assumed so far that our threads start charging under compression (H(iϕ − σ) = 1 when iϕ > σ) and their twitch results in pulling the prong (β > 0). We summarize the possible models in table 2. Owing to the symmetry of the physical model, the compress and pull and extend and push models are completely equivalent: thread i of the former replaces thread −i of the latter, and we can pass from one model to the other by changing sign of the initial conditions of the antenna. Similarly, the model compress and push is completely equivalent to extend and pull. This symmetry allows us to consider only two families of models, namely compress and pull and extend and pull. As we shall see, the compress and pull model gives more plausible results, and in all simulations presented below, the reader should assume that we have used this model unless stated otherwise.
Table 2.
Overview of various possible threads' models. (Threads can be assumed to charge under compression or extension, and they can provide the prong with a pull or a push. Compress–pull and extend–push models are equivalent. Similarly, a compress–push model is equivalent to an extend–pull one.)
| H(iϕ − σ) | H(−iϕ − σ) | |
|---|---|---|
| β > 0 | compress–pull | extend–pull |
| β < 0 | compress–push | extend–push |
5.1. Free oscillations
As a first numerical experiment, we shall show that model (5.1)–(5.5) is capable of reproducing the self-oscillations that have been previously reported experimentally (Jackson et al. in press). To this end, we set α = 0 and impose non-zero initial conditions.
In figure 3, it is shown that the model supports free oscillations: the system approaches a stable periodic orbit as time increases. The orbit plotted in the (ϕ, ϕ̇) plane shows a good qualitative agreement with the experimental results. The frequency of oscillations is found to be at around 330 Hz, as it was found in the experiments.
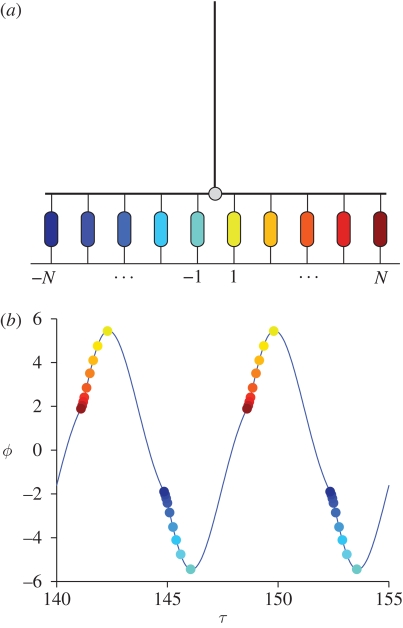
A time plot of ϕ (figure 12) reveals that the antenna follows almost-sinusoidal oscillations. To gain some insight into the dynamics of the system, we have identified each thread with a distinct colour and marked the twitching times with a bullet point of that colour.
Figure 12.
Thread twitches in the self-oscillatory regime (index denoted by colour scheme). (a) Sketch of the colour-coded threads. (b) Threads' twitches are superimposed on the antenna displacements. The thread N triggers its neighbours with positive index. The energy received from the positive threads suffices to trigger the thread −N, which in turn activates all its neighbours. Parameters as in figure 3.
As expected, a key role is played by threads −N and N (the extremal threads). First, such threads determine the minimal perturbation that must be applied to the trivial rest state in order to obtain free oscillations: if the perturbation is too small, the extremal threads are not allowed to start charging. If no thread charges and twitches, the antenna is a free damped oscillator and any initial perturbation of the unforced system dies out. Second, the external threads are the most influential in the system, in that they provide the antenna with the largest torque: when the thread N twitches, it might provide enough energy to allow the thread N − 1 to twitch at a later time. In its turn, thread N − 1 triggers its neighbour in a cascade.
Figure 12 shows clearly the twitching pattern: self-oscillations are sustained by an underlying wave of twitches travelling from the outside towards the inside of the prong. For positive θ, the antenna receives energy from the positive threads. Such energy is partly dissipated during the free flight, but it is enough to induce thread −N to twitch. In its turn, thread −N triggers all the negative threads to twitch.
The periodic orbits shown earlier are not the only self-oscillations supported by the mosquitoes' system. By varying the physical parameters and initial conditions, we find other kinds of periodic orbits. Examples are included in figures 4 and 13.
Figure 13.
Free oscillations involving only a subset of threads. (a) Oscillations sustained by threads ± N only (numerical parameters as in figure 3). Such threads are of the extend–pull type. (b) Oscillations sustained by threads ± N and ± (N − 1) only. These threads are of the compress–pull type. Parameters as in figure 3 except for λ2 = 5 and β = 8/N.
In figure 4, we study the appearance and disappearance of self-oscillations as parameter λ2 is varied; recall that λ2 is the scolopidia bundle charge rate and that a high λ2 means that the threads reach the twitching threshold very quickly once they are allowed to charge. In figure 4a, we see self-oscillations for λ2 = 1.35; if we decrease λ2 and keep fixed all the other parameters (figure 4b), some of the internal threads fail to twitch and oscillations die out. On the other hand, if we increase λ2 too much, some threads twitch twice per period (figure 4c): this can have a destructive effect on the oscillations, as can be seen in the picture at around τ = 30. Indeed, the first twitch of thread N has the effect of accelerating the antenna, while the second twitch decelerates it, causing the oscillations to disappear progressively.
Free oscillations involving a limited number of threads are also supported by the system: in figure 13a, we show oscillations sustained only by the ±Nth threads of an extend and pull model.
As a last example of free oscillations, we have included one obtained in a compress and pull model by increasing parameters λ2 and β. In this configuration, only threads ±N and ±(N − 1) are active, they twitch twice per period (as in figure 4c), but the intensity of their pull is such that the motion of the antenna is inverted.
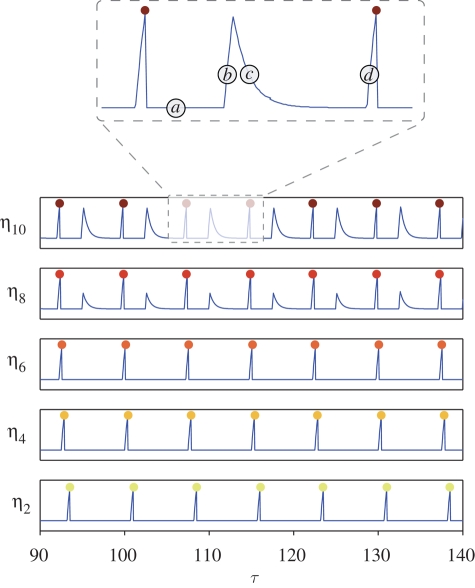
So far we have looked at the motion of the antenna as a function of time. We know that the antenna is coupled to the thread potentials ηi, which are also functions of time. In figure 14, we focus on the positive threads in the regime of free oscillations (N = 10, compress and pull model) and show their time-evolution. From the numerical simulations, we see that the internal threads twitch once per period, whereas the most external ones are able to recharge after the twitch, inducing two spikes per period (though only one twitch, as the second spike is subthreshold). This behaviour can also be seen in figure 15.
Figure 14.
Threads potentials as functions of time. Thread η2 is closer to the antenna, and thread η10 sits at the end of the prong. Parameters as in figure 3. In the inset, we show a portion of η10 (τ). (a) After twitching, the thread is in a quiescent state for at least the refractory time Δ. (b) When the geometric condition iϕ > σ holds, the thread begins to load exponentially, ηi(τ) = C2 e−λ1τ. (c) The motion of the antenna is such that iϕ < σ, the thread discharges before twitching; in this segment, we have ηi(τ) = C1 e−λ1τ +λ2/λ1 (1 − e−λ1τ). (d) The condition iϕ > σ holds again, the thread loads exponentially and twitches. For the internal threads 2–6, the potentials are composed only of segments of types (a) and (d): for these threads, indeed, the geometric condition iϕ > σ is unlikely to be satisfied, because i is small.
Figure 15.
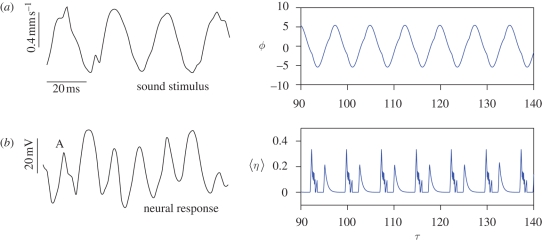
Compound action potential: experimental results (Jackson et al. in press) versus numerical simulations. (a) Sound oscillations (resp. angular displacements) and (b) compound action potential (resp. average of the potentials). In both experiments and numerical simulations, the compound action potential features two spikes per cycle. Parameters as in figure 3.
It is important to note that this 2 : 1 effect is not simply caused by measuring the response on both sides of the antenna: both theoretical and experimental data presented here are collected from one side of the antenna only.
This mechanism can be explained by looking at equation (5.2), upon considering that the vector field for each ηi is piecewise linear. Indeed, the Heaviside functions can assume only the values zero and 1; therefore between two consecutive twitches τi,j < τ < τi,j+1, the differential equations for ηi can be rewritten as
 |
5.6 |
A single thread will switch, in general, from one vector field to another, therefore, in τi,j < τ< τi,j+1, the ηi(τ) are continuous, non-smooth functions formed by growing and decaying exponentials
 |
5.7 |
with constants C1 and C2 determined by initial conditions.
Threads 2, 4 and 6 in figure 14 contain only growing exponentials and identically null segments, i.e. functions of the second family in equation (5.7). On the other hand, the external threads 8 and 10 feature both growing and decaying exponentials, glued together between two consecutive twitches. This is owing to the fact that for external threads i is larger, therefore the geometrical condition iϕ > σ is easier to achieve. As a consequence, trajectories are formed by functions of both families of equation (5.7). The caption of figure 14 contains a detailed explanation of how such trajectories are formed. As we will see in the next section, this mechanism is important also when the external forcing is switched on.
5.2. Amplification and hysteresis
Under standard conditions, the antenna is subject to the action of an external sound field. In our model, this is represented by the torque Ms(t) in equation (3.2). In §3.2, we have proposed an expression for Ms(t) valid when the applied external sound field is harmonic with frequency ωs and amplitude X0.
In this section, we will examine how the mosquito model responds to harmonic forcing when ωs and X0 are varied. In particular, when X0 is varied quasi-statically and ωs is subcritical, the amplitude of the oscillations follows a hysteretic diagram typical of nonlinear systems.
In numerical simulations, we can adjust the frequency and amplitude of the applied sound field by acting on the parameters α and ωs/Ω of equation (5.1). In particular, we run simulations for 0 < τ < 2T and prescribe a saw-toothed behaviour for α
 |
where γ is chosen sufficiently small (typically γ = 0.03) and T sufficiently large (typically T = 3000) so that the amplitude variation is effectively quasi-static (exactly akin to the method used in experimental investigations). As we can see in figure 5, numerical simulations and experimental results are in good agreement.
The hysteresis cycle is explored in detail in figure 6. In order to have a better insight into the hysteresis mechanism, we have recomputed various solutions on the hysteresis diagram: while the hysteresis diagram in figure 6 is obtained by varying α quasi-statically, the solutions in the insets (a)–(e) are computed for a fixed α, starting from suitable initial conditions. This supports the intuition that the system possesses bistable solutions for X0 ≈ 0.4 µm (see figure 6b,d).
Note that numerical and experimental curves show hysteresis with different areas. Indeed, while the linear amplification and saturation regime are superimposable, experiments feature a slightly wider hysteresis cycle. In this respect, we recall that, in the model, nonlinear amplification happens abruptly (no threads are active in figure 6b, but all threads are active in figure 6c). It is easy to imagine that, for large N, or for populations of non-identical threads, this process would be smoothed out and the hysteresis cycle broadened. On the other hand, we should also consider that the experimental curves refer to a single specimen of mosquitoes. The hysteresis diagram can change considerably in different individuals.
In figure 7, we investigate hysteresis as the parameter ωs/Ω is changed. Hysteresis is supported by the model for a range of values ωs/Ω slightly below 1. As ωs/Ω approaches 1, the area of the hysteresis shrinks and finally disappears. Again, this is in qualitative agreement with the experimental observations (Jackson 2007). When analogous numerical simulations are run for the extend and pull model (figure 16), there is neither nonlinear amplification nor hysteresis, regardless of the value of ωs/Ω.
Figure 16.
(a–d) The numerical experiment of figure 7 is repeated with an extend and pull model. The system does not support hysteresis: black and red curves are superimposed.
We have then analysed how the antennal response changes in frequency. While keeping Ω fixed, we repeat the numerical experiment of figure 5 for forcing frequencies ωs between 300 and 600 Hz and compute the gain (figure 9). For forcing amplitues below 0.3 µm, the gain spectrum is rather flat; after transition (between 0.4 and 0.5 µm), the spectrum has a narrower bandwidth and a sharper amplification: this is in excellent agreement with the experiments (Jackson et al. in press).
The frequency dependence can also be seen in figure 8, where we show the tip displacement for stimuli above and below resonance: the agreement with the experiments is striking. When stimulated above resonance, the animal does not exhibit amplification.
It has also been found in experiments (Jackson 2007) that animals subject to hypoxia (through CO2) lose their amplification and hysteresis capabilities. We have collected numerical and experimental results in figure 10. It seems reasonable to assume that hypoxia can influence the charging time of the scolopidia: under the effect of CO2, the scolopidia would be less responsive. In figure 10a(ii), we show that amplification and hysteresis are sensibly affected when the charging time parameter, λ2, is decreased by approximately 60%. Another possiblity is that hypoxia has the effect of decreasing the forces exerted by the scolopidia: in figure 10, it can be seen that decreasing the parameter β has an effect similar to decreasing λ2.
Finally, we examine the behaviour of the threads in the regime of forced oscillations. In order to do that, we monitor the thread potentials ηi(τ) via the average potentials
 |
which measure the compound action of the threads on each side of the antenna. As shown in figure 17, the positive (respectively, negative) threads twitch out of phase (respectively, in phase) with the external stimulus. The overall effect is that the threads provide always a torque of opposite sign with respect to Ms. In figure 11, we show the spectrum of η(τ): the threads have multiple resonances with the forcing frequency ωs. This is also found in experiments (Jackson et al. in press), where the compound action potential of an ensemble of neurons is recorded and transformed in the frequency domain. The numerics and experiments are in good agreement, both showing strong 1 : 1 and 2 : 1 resonances. The numerics also show higher resonances that are not seen experimentally; whether this is due to limitations in the modelling or to the limitations of data collection remains an open question.
Figure 17.
(a–c) External sound field and compound action potentials. The functions η+(τ) and η−(τ) are averages of the threads' potentials in each side of the prong. The threads' twitches are clustered, and they provide a torque of opposite sign with respect to Ms. Numerical parameters as in figure 5.
6. Conclusions
In this paper, we have proposed a simple mechanical model to describe the active hearing process in mosquitoes. The system is based on the description of the antenna as a forced-damped oscillator coupled to a set of active threads that provide an impulsive force when they twitch. This twitching is in turn controlled by channels that are opened and closed if the antenna oscillation reaches a critical amplitude. Even with such a simple description, the model seems to match adequately the experimental observations both qualitatively and quantitatively.
The mosquito model is characterized by a large number of parameters, some of which are hard to determine due to uncertainties in the physical quantities involved. We have demonstrated that the main phenomena discovered in recent experimental results can be reproduced for a biologically plausible range of parameter values.
Furthermore, our model is able to propose a mechanistic explanation of these observations. First and foremost, the self-oscillations observed in some individuals, the nonlinear amplification and consequent observed hysteresis all point to an active process that provides input-amplitude-dependent additional forcing. From the physiology of the mosquito ear, we have concluded that this forcing must arise in the scolopidium–dynein–neuron structures. It is known that they contain ion channels that open in the presence of mechanical stimulation. Our central hypothesis then is that, when sufficient stimulation is provided, the ion channels open and charge the scolopidium until it twitches. Determining the precise mechanism of this charge and twitch process remains beyond the realm of current experimental techniques, but it is reasonable to assume an analogy with neuronal integrate and fire processes in which the twitch occurs once the potential has reached a certain threshold.
Based on these assumptions, our model makes several predictions that agree with experiments. First, that the switching on of the mechanical stimulation (at about 0.5 µm; figures 5 and 6) occurs when the first group of threads start to twitch. The rapid growth in gain from slightly larger amplitude input is caused by more and more of the threads twitching. The saturation of this gain at yet larger amplitude is due to the external threads beginning to twitch twice per period.
Another conclusion from the model is that amplification and hysteresis occur for sound inputs that are just below the primary resonant frequency of the system (figures 7–9). Thus, the model provides a softening nonlinearity just as observed experimentally. Note that this effect is seen only under the hypothesis of a compress and pull mechanism rather than an extend and pull. As already explained, it is not possible to distinguish in the models compress and pull and extend and push, but the clear conclusion, which can be hopefully tested experimentally when more refined techniques are available, is that the sense of the force provided by the twitch agrees with the sense of the displacement that opens its ion channel.
The model presented here confirms that physiologically compromised animals do not exhibit amplification and hysteresis, as found in experiments: the main assumption is that hypoxia can influence the thread responsiveness.
Another feature of the model is its ability to capture self-oscillations, albeit for a slightly different range of parameters from those used to show hysteresis effects (compare the parameters used in figure 3 with those used in figure 5). While the interpretation and fitting of model parameters to any biological system are often fraught with difficulty, this nevertheless fits the experimental observations that only some individuals display self-oscillations (Jackson et al. in press) and of those that do there is a significant variation from individual to individual (see also figure 4).
Nevertheless, the proposed model is capable of many refinements: we want to conclude the paper by outlining how new models can be derived from the present one. An important question to address concerns the role played by the threads in the real insect. As with all models, we have had to introduce some simplifications, and we began by thinking of threads as bundles of scolopidium–dynein–neuron units. This viewpoint has proved to be useful to determine equations governing the thread potentials and to gain insight into the parameters involved in controlling the active hearing process.
Nevertheless, the analogy of threads as scolopidium–dynein–neuron bundles could be subject to criticism. It is known, for instance, that in the mosquitoes there is electrophysiological activity even for very small forcing amplitudes, and before the onset of any significant nonlinear gain or hysteresis (Jackson et al. in press). In our model, the threads start to load and twitch only in proximity to the nonlinear amplification threshold. A potential resolution to this apparent contradiction is that each thread has a dual capacity and that neuronal sensing (owing to charging of the neuronal axon) is a separate process to the mechanical twitching, which is charged by the opening of ion channels on the scolopidium itself.
Furthermore, in each of our threads, we condensed both an electrical sensor (charge and discharge constants, action potentials) and a mechanical actuator (twitches). It is still unclear what is the precise biological counterpart of the threads proposed here.
Thus, in the primitive auditory mechanism of mosquitoes, the cells providing mechanical forces are essentially separated by the activity of the neurons: right underneath the prong, the scolopidia would be the most obvious candidates for transmitting a force to the antenna. Connected to them, it is plausible to hypothesize that a set of neurons would turn mechanical motion into electrical signals. In this framework, scolopidia could oscillate with their own frequencies and their motion would be well described by a stable limit cycle. The force transmitted by the prong would entrain the scolopidia, giving rise to nonlinear amplification. The nature of the feedback between neurons and scolopidia (and, indeed, between different neurons) remains very much an open question.
Another possible interpretation of our model is that threads presented in our model can be thought of as lumped-parameter entities that measure the coherence of a bundle of underlying oscillating scolopidia. The ith thread represents an ensemble of scolopidia in a certain region of the prong, and the variables ηi are a measure of how coherent the scolopidia are in that region. When ηi is close to zero, the underlying scolopidia are incoherent; when the forcing provided by the prong exceeds a given threshold, the scolopidia oscillate coherently and they are capable of forcing the prong (when ηi = 1).
In order to proceed towards a more refined model, which would take into account individual scolopidia and their entrainment, more experimental data are needed at the microscopic level. In any case, the coarse-grained model presented here gives us an idea of the order of magnitude of the mechanical work done by the scolopidia, and it can guide us in future refinements.
The numerical results presented here also generate new questions. In our description of the system, for instance, all threads have the same material properties, but their impact on the dynamics of the antenna varies according to the spatial location of the threads: intuitively, an external thread induces a much larger torque than an internal one. However, the true physiology of the threads is more complex, owing to the curved arrangement of Johnston's organ, and a further investigation of the effect of the consequent mechanical variation of each thread is another topic that we defer for future work.
Acknowledgements
The authors are grateful to Krasimira Tsaneva-Atanasova and Robert Szalai (University of Bristol) for useful discussions. D. A., M. H. and A. C. wish to acknowledge the EPSRC for funding this research with the ‘Applied Nonlinear Mathematics, Making it Real’ EP/E032249/1 grant. J. C. J. was financed by the IRC in Nanotechnology Cambridge, Bristol, UCL. J.C.J. and D. R. acknowledge funding from the BBSRC BB/C518522 grant.
References
- Ashmore J., Gale J. 2004. The cochlear amplifier. Curr. Biol. 14, 403–404. ( 10.1016/j.cub.2004.05.025) [DOI] [PubMed] [Google Scholar]
- Bialek W. 1987. Physical limits to sensation and perception. Annu. Rev. Biophys. Biophys. Chem. 16, 455–478. ( 10.1146/annurev.bb.16.060187.002323) [DOI] [PubMed] [Google Scholar]
- Camalet S., Jülicher F. 2000. Generic aspects of axonemal beating. New J. Phys. 2, 24.1–24.23. [Google Scholar]
- Camalet S., Duke T., Jülicher F., Prost J. 2000. Auditory sensitivity provided by self-tuned critical oscillations of hair cells. Proc. Natl Acad. Sci. USA 97, 3183–3188. ( 10.1073/pnas.97.7.3183) [DOI] [PMC free article] [PubMed] [Google Scholar]
- Clements A. N. 1963. The physiology of mosquitoes. Oxford: Pergamon Press. [Google Scholar]
- Dillon R. H., Fauci L. J. 2000. An integrative model of internal axoneme mechanics and external fluid dynamics in ciliary beating. J. Theor. Biol. 207, 415–430. ( 10.1006/jtbi.2000.2182) [DOI] [PubMed] [Google Scholar]
- Eberl D. F. 1999. Feeling the vibes: chordotonal mechanisms in insect hearing. Curr. Opin. Neurobiol. 9, 389–393. ( 10.1016/s0959-4388(99)80058-0) [DOI] [PubMed] [Google Scholar]
- Fettiplace R., Hackney C. 2006. The sensory and motor roles of auditory hair cells. Nat. Rev. Neurosci. 7, 19–29. ( 10.1038/nrn1828) [DOI] [PubMed] [Google Scholar]
- Göpfert M. C., Robert D. 2000. Nanometre-range acoustic sensitivity in male and female mosquitoes. Proc. R. Soc. Lond. B 267, 453–457. ( 10.1098/rspb.2000.1021) [DOI] [PMC free article] [PubMed] [Google Scholar]
- Göpfert M. C., Robert D. 2003. Motion generation by drosophila mechanosensory neurons. Proc. Natl Acad. Sci. USA 100, 5514–5519. ( 10.1073/pnas.0737564100) [DOI] [PMC free article] [PubMed] [Google Scholar]
- Göpfert M. C., Robert D. 2007. Active auditory mechanics in insects. In Active processes and otoacoustic emissions in hearing. Springer Handbook of Auditory Research, vol. 30 (eds Manley G., Popper A.). Berlin: Springer-Verlag. [Google Scholar]
- Göpfert M. C., Briegel H., Robert D. 1999. Mosquito hearing: sound-induced antennal vibrations in male and female aedes aegypti. J. Exp. Biol. 202, 2727–2738. [DOI] [PubMed] [Google Scholar]
- Howard J., Hudspeth A. J. 1987. Mechanical relaxation of the hair bundle mediates adaptation in mechanoelectrical transduction by the bullfrog's saccular hair cell. Proc. Natl Acad. Sci. USA 84, 3064–3068. ( 10.1073/pnas.84.9.3064) [DOI] [PMC free article] [PubMed] [Google Scholar]
- Hudspeth A. J. 1985. The cellular basis of hearing: the biophysics of hair cells. Science 230, 745–752. ( 10.1126/science.2414845) [DOI] [PubMed] [Google Scholar]
- Hudspeth A. J. 1997. Mechanical amplification of stimuli by hair cells. Curr. Opin. Neurobiol. 7, 480–486. ( 10.1016/s0959-4388(97)80026-8) [DOI] [PubMed] [Google Scholar]
- Humphrey J. A. C., Devarakonda R., Iglesias I., Barth F. G. 1993. Dynamics of arthropod filiform hairs. I. Mathematical modelling of the hair and air motions. Phil. Trans. R. Soc. Lond. B 340, 423–444. ( 10.1098/rstb.1993.0083) [DOI] [Google Scholar]
- Jackson J. C. 2007. Experimental and theoretical investigations into the active nonlinear processes of mosquito audition. PhD thesis, School of Biological Sciences, University of Bristol. [Google Scholar]
- Jackson J. C., Robert D. 2006. Nonlinear auditory mechanism enhances female sounds for male mosquitoes. Proc. Natl Acad. Sci. USA 103, 16734–16739. ( 10.1073/pnas.0606319103) [DOI] [PMC free article] [PubMed] [Google Scholar]
- Jackson J. C., Windwill J. F. C., Pook V. G., Robert D. Submitted In press Synchrony through twice-frequency forcing for sensitive and selective auditory processing. Proc. Natl Acad. Sci. USA. [DOI] [PMC free article] [PubMed] [Google Scholar]
- Lindemann C. B. 1994. A ‘geometric clutch’ hypothesis to explain oscillations of the axoneme of cilia and flagella. J. Theor. Biol. 168, 175–189. ( 10.1006/jtbi.1994.1097) [DOI] [Google Scholar]
- Nadrowski B., Martin P., Jülicher F. 2004. Active hair-bundle motility harnesses noise to operate near an optimum of mechanosensitivity. Proc. Natl Acad. Sci. USA 101, 12195–12200. ( 10.1073/pnas.0403020101) [DOI] [PMC free article] [PubMed] [Google Scholar]
- Riedel-Kruse I. H., Hilfinger A., Howard J., Jülicher F. 2007. How molecular motors shape the flagellar beat. HFSP J. 1, 192–208. ( 10.2976/1.2773861) [DOI] [PMC free article] [PubMed] [Google Scholar]
- Robert D., Göpfert M. C. 2002. Novel schemes for hearing and orientation in insects. Curr. Opin. Neurobiol. 12, 715–720. ( 10.1016/S0959-4388(02)00378-1) [DOI] [PubMed] [Google Scholar]
- Robert D., Hoy R. R. 2007. Auditory systems in insects. In Invertebrate neurobiology (eds Greenspan R., North G.), pp. 155–184. Cold Spring Harbor, NY: Cold Spring Harbor Laboratory Press. [Google Scholar]
- Tuckwell H. C. 1988. Introduction to theoretical neurobiology. Cambridge, UK: Cambridge University Press. [Google Scholar]


