Abstract
Here, we present a detailed analysis of the deforming wing kinematics of free-flying hoverflies (Eristalis tenax, Linnaeus) during hovering flight. We used four high-speed digital video cameras to reconstruct the motion of approximately 22 points on each wing using photogrammetric techniques. While the root-flapping motion of the wing is similar in both the downstroke and upstroke, and is well modelled as a simple harmonic motion, other wing kinematic parameters show substantial variation between the downstroke and upstroke. Whereas the magnitude of the angle of incidence varies considerably within and between different hoverflies, the twist distribution along the wing is highly stereotyped. The angle of incidence and camber both show a recoil effect as they change abruptly at stroke reversal. Pronation occurs consistently after stroke reversal, which is perhaps surprising, because this has been found to reduce lift production in modelling studies. We find that the alula, a hinged flap near the base of the wing, operates in two discrete states: either in plane with the wing, or flipped approximately normal to it. We hypothesize that the alula may be acting as a flow-control device.
Keywords: insect flight, kinematics, control, aeroelasticity, wing deformation, hovering
1. Introduction
Hovering flight is the most demanding type of sustained locomotion, as it is not only the most energetically expensive form of flight (Weis-Fogh 1972), but exceptionally fine control is also needed to remain stationary. All of the aerodynamic force must be produced in the absence of any incident flow, meaning lift can be produced only by the powered reciprocating motion of the wing (Fry et al. 2005). For engineers interested in building micro-air vehicles, hovering represents a challenging feature of insect flight that would be desirable to replicate (e.g. Zuo et al. 2006; Shyy et al. 1999; Żbikowski 2002; Żbikowski et al. 2006; Kurtulus et al. 2008). It is therefore no surprise that hovering flight remains one of the most active areas of insect flight research.
Mechanical and mathematical models have shown that a number of parameters are important in determining the forces produced during hovering flight, e.g. angle of attack (Dickinson & Götz 1993; Sun & Tang 2002; Wang et al. 2004; Bos et al. 2008), stroke amplitude (Wang 2000; Ramamurti & Sandberg 2002; Lua et al. 2008) and wingbeat frequency (Wu & Sun 2004; Tang et al. 2007). However, these models are typically based on rigid, flat-plate kinematics, which are far removed from the real kinematics of a hovering insect where time-varying camber and wing twist are present (e.g. Weis-Fogh 1973; Ellington 1984; Ennos 1989; Willmott & Ellington 1997). Recent work has shown that camber, and to a lesser extent twist, do indeed play important roles in determining the aerodynamic forces produced during hovering flight, by increasing the lift coefficient and reducing the required aerodynamic power (Du & Sun 2008; Vanella et al. 2009).
Subtle changes in stroke parameters are also known to influence the aerodynamic forces produced during hovering flight (e.g. Fry et al. 2003, 2005; Lehmann & Pick 2007). Recently, Bos et al. (2008) showed that using simplified wing-tip kinematics and angles of attack in models of insect flight can result in considerable reductions in the measured lift-and-drag forces. Detailed kinematics which describe the full kinematics of the wings, including their deformations, are therefore needed if we are to fully understand the aerodynamic mechanisms that are used by insects in hovering flight. Despite this, there are few quantitative measurements of wing shape and movement in free-flying insects. Walker et al. (2009, in press) recently described a series of techniques, based on photogrammetry, that allow high spatiotemporal resolution three-dimensional kinematics to be measured using high-speed digital video cameras. These techniques allow accurate measurements to be made of the surface topography from insect wings during free-flight.
Several studies have focused on the wing kinematics of hoverflies, involving quantitative measurements of wing-tip paths and qualitative descriptions of the wing twist and camber (Ellington 1984; Ennos 1989). These studies show that a torsional wave passes from wing-tip to wing root during rotation at the end of each half-stroke. Ennos (1988b) used an analytical approach to show that wing rotation and the torsional wave could be accounted for by inertial forces alone, with little or no muscular input required, and this has been supported by more recent work from Ishihara et al. (2009) using computational fluid dynamics on a two-dimensional flexible aerofoil. Some control of wing rotation is nevertheless apparent in flight (Ellington 1984), and rotation at the end of the half-stroke is especially important. Many studies have shown that the timing and duration of this rotation has a substantial effect on the resulting lift forces in dipteran flight (e.g. Dickinson et al. 1999; Sane & Dickinson 2001; Sun & Tang 2002; Walker 2002; Wang et al. 2004). In particular, early rotation results in significantly higher lift coefficients than delayed rotation owing to differences in wake capture and the amount of rotational lift being produced.
In this paper, we describe and analyse the deforming wing kinematics of free-flying hoverflies (Eristalis tenax, Linnaeus). We examine how the wing-tip paths, angle of attack and camber of the wings vary through the stroke. We then discuss which parameters show significant variation or consistency through the stroke and between different individuals, and consider how they might be important in terms of the aerodynamics and control. We also describe the movements of the alula, a hinged flap-like structure at the root of the wing, which might serve as a flow-control device.
2. Material and methods
2.1. Wing kinematics measurements
The methods used are those outlined in Walker et al. (2009), so only a brief summary shall be given here. Hoverflies were wild-caught in Oxford and used for experiments on the day of capture. Each hoverfly was allowed to fly freely inside a 220 mm diameter flight cylinder made of 0.175 mm clear sheet polyester, and was encouraged to hover in a column of visible light generated by two, non-flickering light sources, placed above and below the light chamber. Four Photron Ultima APX cameras (Photron Ltd, Bucks, UK) with 180 mm Sigma macro lenses were used for filming, recording at 4000 frames s−1 with 1024 × 512 pixel resolution. The cameras were positioned above the cylinder to give good views of the wings throughout the stroke cycle, with minimal obscuration by the body. For illumination, we used a 200 W infrared pulsed laser (HSI-1000, Oxford Lasers Ltd, Oxford, UK), which was routed though four fibre optics and a series of collimating lenses to provide direct illumination into each of the cameras' lenses. This provided extremely bright illumination, while also having a short enough pulse duration (1 µs) to eliminate motion blur and overheating of the insect. The wavelength of the laser (805 nm) was beyond the range of the visible spectrum for Eristalis (Bishop 1974; Horridge et al. 1975), hence it did not interfere with the hoverflies' behaviour. In total, 172 recordings were made from 26 individual hoverflies, although only 78 of these, from six individuals, had both wings visible in at least two cameras for at least one complete stroke cycle. From these, five sequences, each from a different hoverfly, were selected for full kinematic analysis, providing 25 complete wingbeats. These sequences were selected as those in which both wings were visible in all four camera views for multiple wingbeats, and in which Ellington's (Ellington 1984) criterion for hovering was satisfied, namely that the advance ratio was ≪ 0.1 (table 1).
Table 1.
Morphological parameters and summary wing-tip kinematic parameters (mean ± s.d.) for each hoverfly. All of the hoverflies except H2 are female. See text for definitions of kinematic parameters.
| hoverfly (wingbeats) | mass (mg) | wing length (mm) | advance ratio | body lengths per wingbeat | wingbeat frequency (Hz) | stroke plane angle (°) |
stroke amplitude (°) |
mid-stroke angle (°) |
|||
|---|---|---|---|---|---|---|---|---|---|---|---|
| left | right | left | right | left | right | ||||||
| H1 (4) | 104 | 12.3 | 0.007 | 0.057 | 154 ± 2 | 0.6 ± 0.5 | −0.2 ± 0.8 | 67.2 ± 5.8 | 68.5 ± 6.2 | −2.7 ±2.6 | −12.9 ±3.4 |
| H2 (5) | 100 | 11.3 | −0.027 | 0.152 | 163 ± 2 | −4.8 ± 3.0 | −7.6 ± 4.1 | 130.3 ± 8.3 | 130.9 ± 2.8 | −27.2 ±9.0 | 22.6 ± 7.9 |
| H3 (5) | 125 | 12.4 | −0.021 | 0.071 | 152 ± 2 | 0.6 ± 1.1 | −2.6 ± 1.4 | 91.8 ± 0.9 | 90.9 ± 2.3 | −6.5 ± 3.6 | −14.7 ± 4.2 |
| H4 (7) | 181 | 12.6 | 0.015 | 0.069 | 180 ± 3 | −1.3 ± 3.9 | −3.9 ± 1.4 | 116.1 ± 3.4 | 116.6 ± 2.9 | −26.2 ± 1.5 | −29.1 ± 1.9 |
| H5 (4) | 108 | 12.3 | −0.009 | 0.072 | 149 ± 0 | 3.1 ± 0.9 | 5.6 ± 1.0 | 105.8 ± 2.9 | 102.3 ± 2.6 | −12.8 ± 1.1 | −3.2 ± 1.2 |
The cameras were calibrated using custom-written software running in Matlab (Matlab v. 7.4, The Mathworks Inc., Natick, MA, USA). The details of the calibration are described in Walker et al. (2009) but in brief, the method uses a bundle adjustment, which uses a nonlinear least squares solver to produce jointly optimal estimates of the camera parameters and the spatial coordinates of points on a two-dimensional calibration grid in a range of positions and orientations. Manual tracking was used to identify 22 points on each wing and three points on the body (two from the head and one from the abdomen). The estimated spatial coordinates of these points had a mean absolute error of approximately 0.03 mm (Walker et al. 2009). The coordinates of the identified points were then forwards–backwards filtered using a third-order low-pass Butterworth filter with a −3 dB cut-off frequency at 1000 Hz. The value of the cut-off frequency was chosen by autocorrelation analysis as the lowest filter frequency that did not remove any underlying signal from the data. A 100 × 100 point deformable surface mesh was then fitted to each wing that accurately described the camber and twist distribution. Finally, a scale model of the body was fitted, based on the coordinates of the measured points from the head and the abdomen.
Three reference frames are defined for each wing. The first is a right-handed laboratory-fixed frame of reference (x, y, z). The x-axis of this frame is horizontal and points forward in the direction of the long axis of the body based on its position in the first frame of the sequence; the z-axis points vertically down. The stroke angle and deviation angle are measured with respect to a second, body-fixed axis system (x′y′z′) defined with respect to the stroke plane and centred on the wing root. The stroke plane (figure 1) contains the wing root and the wing-tip at the two extremes of the stroke, and defines the x′y′-plane in which the x′-axis points forward within the plane of symmetry of the insect. The stroke plane angle is defined as the angle between the xy-plane and the x′y′-plane (i.e. stroke plane), measured in the xz-plane. This angle measures the tilt of the stroke plane, and is signed positive when the stroke plane is inclined downward, as it is in forward flight. The stroke angle is defined as the angle between the line joining the wing-tip and wing root and its projection onto the y′z′-plane (figure 1a). This angle measures the instantaneous position of the wing within the stroke plane, and is signed positive when the wing points forwards of the y′-axis. The stroke amplitude is defined as the maximum subtracted from the minimum stroke angle, and the mid-stroke angle is defined as the stroke angle at the mean midpoint of the downstroke and upstroke. The deviation angle is measured orthogonal to the stroke angle, and is defined as the angle between the line joining the wing-tip and wing root and its projection onto the x′y′-plane (figure 1b). This angle measures the out-of-plane motion of the wing, and is signed positive when the wing is above the stroke plane.
Figure 1.
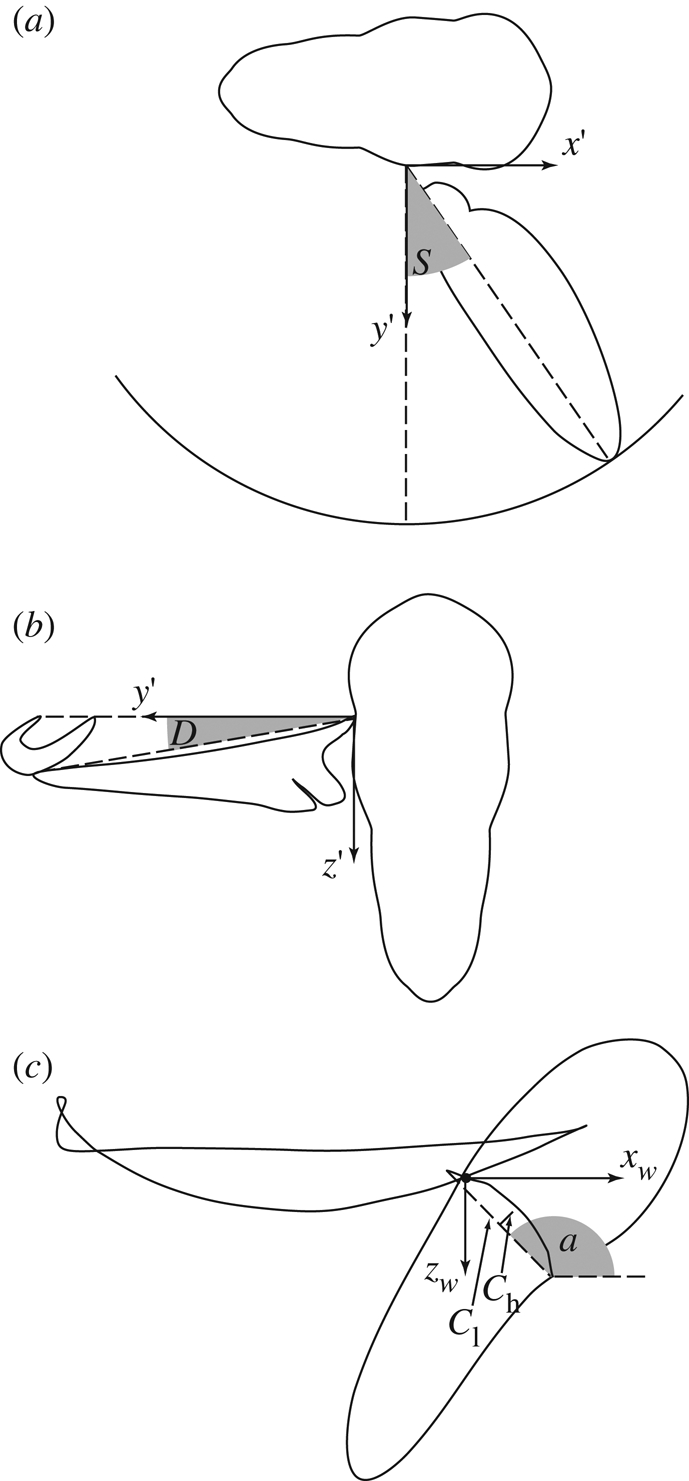
Definition sketches showing calculation of kinematic parameters. (a) The stroke angle (S) is defined as the angle between the line joining the wing-tip and wing root and its projection onto the y′z′-plane. (b) The deviation angle (D) is measured orthogonal to the stroke angle, and is defined as the angle between the line joining the wing-tip and wing root and its projection onto the x′y′-plane. (c) The local angle of incidence is defined as the angle between the xwyw-plane and the line joining the leading and trailing edge parallel to the xwzw-plane. The local camber is defined as the ratio of the mid-chord height (Ch) to the chord length (Cl).
The local angle of incidence and the camber of each wing were measured with respect to a rotating wing-axis system (xw, yw, zw) that is centred on the wing root. The yw-axis is coincident with the line joining the wing-tip to the wing root, and the xw-axis is horizontal and is directed forwards to a degree that varies through the stroke (figure 1c). Defining camber and angle of incidence with respect to this rotating frame of reference allows us to control for the effects of changing stroke angle and deviation angle. The local angle of incidence was defined as the angle between the xwyw-plane and the line joining the leading and trailing edge parallel to the xwzw-plane, signed positive in the direction of rotation from the xwyw-plane to the anatomical ventral surface of the wing. The s.d. of the error in the angle of incidence measurements was an inverse function of the local chord length, but was at worst 0.88° (Walker et al. 2009). The local camber was defined as the ratio of the mid-chord height to the chord length (figure 1c). The mid-chord height was used as opposed to the maximum chord height because the wing bends into a complicated reflexed shape during stroke reversal, causing the maximum chord height to vary discontinuously.
3. Results
3.1. Wing-tip kinematics
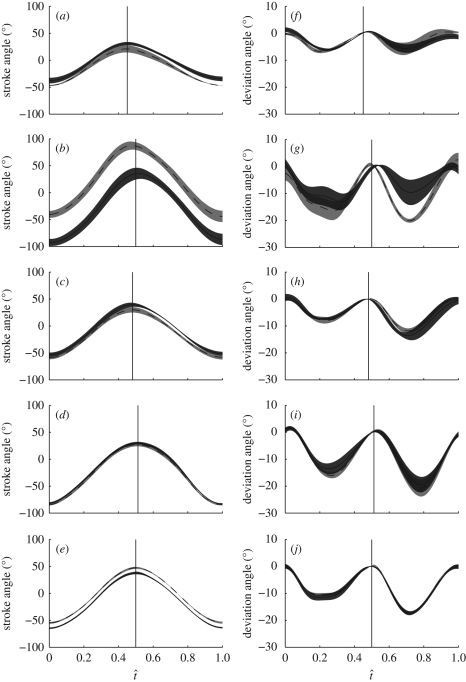
Table 1 gives summary kinematic parameters for each hoverfly. There is considerable variation in nearly all of the wing-tip parameters between the different hoverflies. The stroke amplitude varies greatly between individual hoverflies. For example, the wings of hoverfly H2 (stroke amplitude 130° for both the left and right wings) move through an angle almost double that of hoverfly H1 (stroke amplitude 67° and 69° for the left and right wings, respectively). All of the hoverflies have stroke plane angles that are close to zero, resulting in an approximately horizontal wingbeat with no significant correlation between the advance ratio and the stroke plane angle (general linear model controlling for hoverfly: F1,19 = 1.8, p = 0.195). All of the hoverflies move considerably less than one body length per wingbeat.
Within hoverflies, the stroke amplitude and stroke plane angle are similar between the left and right wings, with a maximum of 4° difference in stroke amplitude for hoverfly H5, and a maximum of 3° difference in stroke plane angle for hoverfly H2. There is considerably more variation in the mid-stroke angle, particularly in the case of hoverfly H2 where the difference in the mid-stroke angle between the left and right wings is approximately 50°.
Figure 2 plots the stroke angle and deviation angle for each wing of each hoverfly against normalized time through the wingbeat (t̂), defined as the time since the start of the downstroke divided by the wingbeat period. For a given individual, the stroke angle shows less variation between successive wingbeats than the deviation angle. The change in stroke angle through the stroke is very similar between the left and right wings, but the absolute values show some differences, particularly in the case of hoverfly H2, where there is approximately a 50° difference between the left and right wings. The downstroke duration is typically shorter than the upstroke duration, but the changes in stroke angle are fairly symmetric in other respects. The deviation angle is similar between wings, except for hoverfly H2, which shows variation between both the left and right wings.
Figure 2.
Stroke angle (a–e) and deviation angle (f–j) against normalized time through the wingbeat (t̂) for the five hoverflies (a,f, H1; b,g, H2; c,h, H3; d,i, H4; e,j, H5). Solid lines, left wing; dashed lines, right wing. The shaded region around each line displays the s.d. over the wingbeats measured. The downstroke begins at t̂ = 0 and ends at the point denoted by the vertical line, which marks the mean timing of the start of the upstroke.
3.2. Angle of incidence
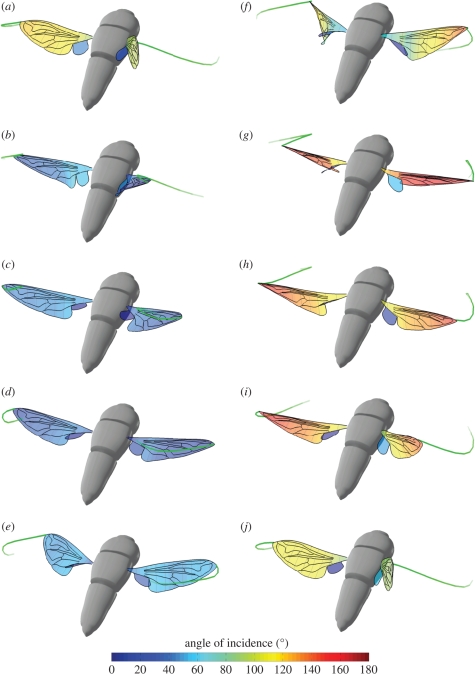
Figure 3 plots a three-dimensional projection of hoverfly H5 through 10 stages of a single wingbeat. The wings are coloured according to the local angle of incidence. The wing is twisted during all stages of the wingbeat, but is most noticeably twisted just after stroke reversal (figure 3f), when a torsional wave passes along the wing from wing-tip to wing root. Figure 4 plots the instantaneous angle of incidence at 50 per cent wing length through the stroke. During the downstroke, the angle of incidence decreases sharply until approximately t̂ = 0.15. After t̂ = 0.15, the angle of incidence recoils through approximately 5°. A similar recoil is also seen in the upstroke after a rapid increase in the angle of incidence up to approximately t̂ = 0.6. Although this recoil is typical of both the upstroke and the downstroke, hoverfly H1 does not show a recoil effect on the downstroke, so this is not a universal or necessary feature of the wingbeat.
Figure 3.
Three-dimensional projection of hoverfly H5 to show how the angle of incidence varies across the wings at 10 different stages of a single wingbeat. ((a) t̂ = 0.0; (b) t̂ = 0.1; (c) t̂ = 0.2; (d) t̂ = 0.3; (e) t̂ = 0.4; (f) t̂ = 0.5; (g) t̂ = 0.6; (h) t̂ = 0.7; (i) t̂ = 0.8; (j) t̂ = 0.9, where t̂ is the normalized time through the wingbeat.) The wings are coloured by the angle of incidence. A scaled model of the hoverfly body is also shown for reference. The green wisps at the wing tips show the immediate time history of the wing tip position to convey a sense of the wing's motion. The wing is twisted throughout the wingbeat, but is most noticeably twisted just after supination (f), when a torsional wave passes along the wing from wing-tip to wing root.
Figure 4.
Angle of incidence at 50% wing length plotted against normalized time through the wingbeat (t̂) for the (a) left and (b) right wings of the five hoverflies. The solid lines show the mean instantaneous angle of incidence for each hoverfly (red, H1; green, H2; blue, H3; black, H4; magenta, H5) and the shaded region around those lines displays the s.d. over the wingbeats measured. The vertical solid line indicates the mean timing of the start of the upstroke.
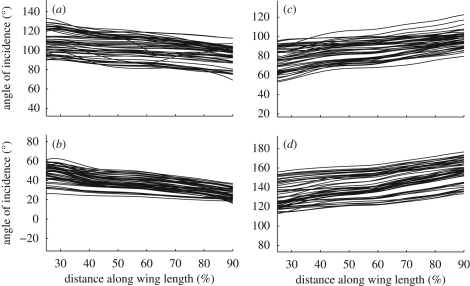
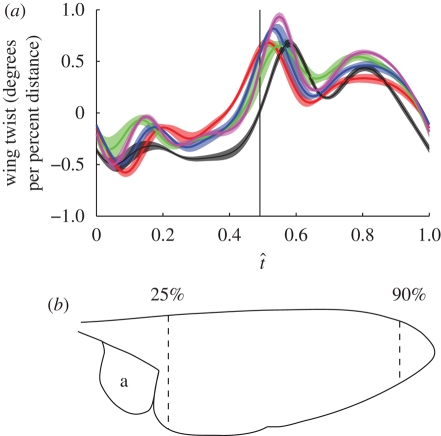
Figure 5 plots the angle of incidence across the wing at four different stages of every recorded wingbeat (start of downstroke, mid-downstroke, start of upstroke and mid-upstroke). At all four stages of the stroke there is considerable variation in the absolute values of the angle of incidence between different wingbeats. Nevertheless, at every stage of the wingbeat shown in figure 5, the angle of incidence varies approximately linearly with distance along the wing, and the slope of the line is similar between wingbeats. This was tested by regressing angle of incidence against distance along the wing at every measured instant and then plotting how the slopes of the regressions varied through the stroke (figure 6a). Figure 6a therefore shows how the strength and sign of the linear twist distribution varies through the wingbeat. The recoil observed in the instantaneous angle of incidence measurements (figure 4) is manifested in the pronounced changes in twist that occur near the start of each half-stroke (figure 6a). We have excluded portions of the wing near the root and tip from this analysis because the measurement error is inversely related to the chord, which tapers at the root and tip, and because of the presence of a hinged flap at the wing root (figure 6b; see §3.5). The mean R2 value of all of the linear regressions was 91.6 per cent, indicating that most of the span-wise variation in the angle of incidence at any instant is explained by a linear twist distribution.
Figure 5.
Angle of incidence across the wing at four different stages of every wingbeat ((a) start of downstroke; (b) mid-downstroke; (c) start of upstroke; (d) mid-upstroke) for the five hoverflies.
Figure 6.
(a) Average slope of linear regression of angle of incidence against distance along the wing, plotted against normalized time through the wingbeat (t̂) for each of the five hoverflies. The solid lines show the mean slope for both wings (red, H1; green, H2; blue, H3; black, H4; magenta, H5) and the shaded region around those lines displays the s.d. over the wingbeats measured. The vertical solid line indicates the mean timing of the start of the upstroke. (b) Outline of a hoverfly wing showing the location of the limits to the wing length used in the linear regression analysis. Distances near the wing root (under 25% wing length) and wing tip (over 90% wing length) were excluded from the regression analysis because the measurement error is inversely related to the chord length, and because the presence of a hinged flap at the base of the wing (alula: lettered a) causes discontinuities (see §3.5).
The changes in twist distribution are qualitatively similar between individuals, and the s.d.'s of the slope estimates are also small. This indicates that the periodic changes in linear twist distribution are consistent both within individuals and between left and right wings. The twist is negative during the downstroke (i.e. the angle of incidence decreases from root to tip) and positive during the upstroke (i.e. the angle of incidence increases from root to tip); however, both distributions would result in aerodynamic washout (i.e. the angle of attack decreases from root to tip) when taking account of the relative movement of the wing.
3.3. Timing of stroke reversal and wing rotation
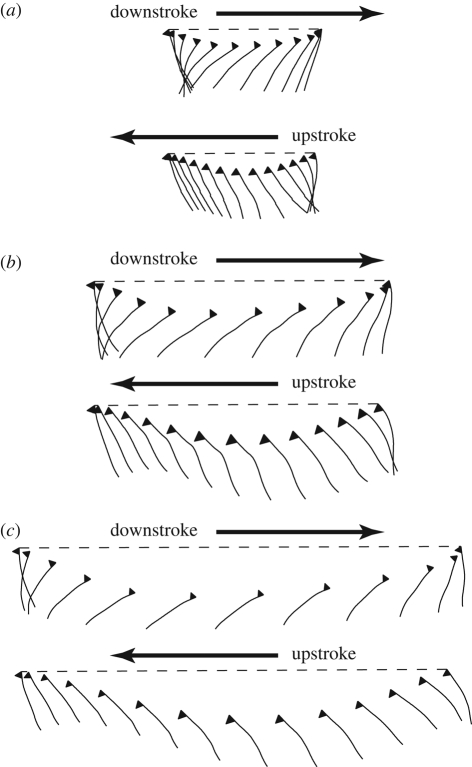
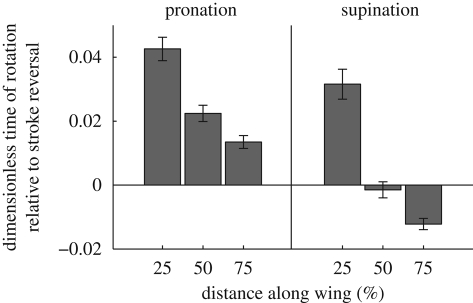
Figure 7 shows the wing motion diagrammatically for hoverfly H1, plotting the instantaneous wing profiles at three distances along the wing through a single wingbeat. The wing rotates rapidly at either end of the stroke, but reverses its translational direction before the angle of incidence has passed through 90° (‘delayed rotation’; Dickinson et al. 1999). This is most pronounced during pronation and near the wing root because of the torsional wave running down the wing, which causes the angle of incidence near the wing root to lag behind the wing-tip (figure 3). These results are quantified in figure 8, which shows the difference between the timing of wing rotation at pronation and supination (defined as the time when the angle of incidence of the wing passes through 90°) and the timing of the corresponding stroke reversal (defined as the time when the angular velocity of the wing in the stroke plane changes sign). As was illustrated already for a single wingbeat in hoverfly H5 (figure 7), rotation typically occurs after stroke reversal during pronation, and approximately at stroke reversal during supination.
Figure 7.
Diagram of wing motion showing the instantaneous wing profile at three distances along the wing through a single wingbeat of hoverfly H1 ((a) 25% wing length; (b) 50% wing length; (c) 75% wing length). The horizontal dashed lines indicate the stroke plane, which is close to horizontal for the wingbeat (stroke plane = 0.037°). The wing profiles are drawn as they would appear when projected onto the xwzw-plane of the rotating wing-axis system (i.e. they are how the airfoil section would appear when looking directly down the long-axis of the wing) but are spaced according to the distance moved in the x′z′-plane (i.e. they are spaced as they would appear when looking sideways onto the insect). The triangle on each profile is a symbol added to identify the dorsal side of the leading edge, and is not a part of the wing. Wing rotation (defined as the time when the local angle of incidence passes through 90° at the end of each half stroke) typically occurs after the start of the next half stroke (‘delayed rotation’; Dickinson et al. 1999).
Figure 8.
Bar chart showing mean and s.e. of timing of wing rotation relative to timing of stroke reversal at three distances along the wing during pronation and supination. The difference in the timing of the two events is shown normalized by wingbeat period. Wing rotation is defined as the time when the angle of incidence of the wing passes through 90° and wing stroke reversal is defined as the time when the angular velocity of the wing in the stroke plane changes sign.
3.4. Wing camber
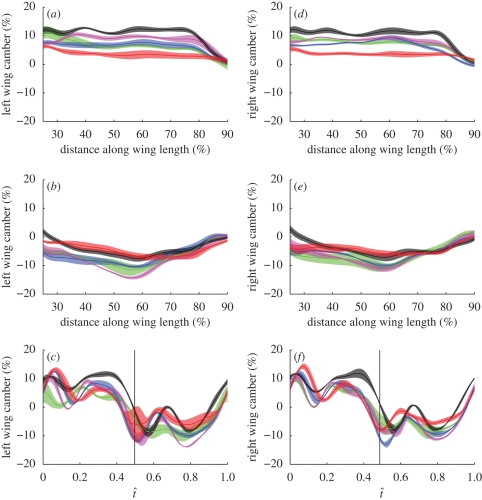
Figure 9 plots anatomical camber against distance along the wing at mid-downstroke (a,d) and mid-upstroke (b,e). At mid-downstroke, the camber is constant up to approximately 80 per cent wing length, beyond which it decreases. At mid-upstroke, the anatomical camber is negative and increases in magnitude along the wing up to approximately 60 per cent wing length, beyond which it decreases in magnitude. Note that because the wing is inverted on the upstroke, the sign of the anatomical camber is appropriate to give an effective positive camber on both half-strokes (i.e. the wing is always concave with respect to the oncoming flow). Each hoverfly has similar camber on the left and right wings, but different individuals have very different values of maximum and minimum camber. Figure 9c,f plots the mean instantaneous camber at 50 per cent wing length against normalized time for each hoverfly. Like the angle of incidence and angle of attack (figure 4), camber changes through the stroke in a qualitatively similar fashion in different individuals. Camber also shows a similar recoil effect to angle of incidence at the start of each half-stroke, visible in figure 9c,f at approximately t̂ = 0.15 and t̂ = 0.6.
Figure 9.
Average camber plotted against percentage distance along the wing and against normalized time through the wingbeat (t̂) for the (a–c) left and (d–f) right wings of the five hoverflies. The solid lines show the mean instantaneous camber for each hoverfly (red, H1; green, H2; blue, H3; black, H4; magenta, H5) and the shaded region around those lines displays the s.d. over the wingbeats measured. (a,d) Camber at mid-downstroke. (b,e) Camber at mid-upstroke. (c,f) Camber at 50% of wing length.
3.5. Alula
The alula is a hinged flap near the base of the hoverfly wing that is present in some Diptera and which varies greatly among species in its size relative to the rest of the wing (see e.g. Colyer & Hammond 1968; Stubbs & Falk 2002). The alula is particularly large in Eristalis, and can be seen clearly in frames taken from the high-speed video of hoverflies H3 and H5 (figure 10). The two hoverflies are using similar wing kinematics (table 1 and figure 4), but have the alula operating in quite different states. In hoverfly H3 (figure 10a–f), the alula operates at a similar angle of incidence to the rest of the wing, except at stroke reversal (figure 10c) when it lags behind the rest of the wing. In contrast, in hoverfly H5, the alula operates at a lower angle of incidence than the rest of the wing throughout the stroke (figure 10h–l). This is most apparent during the upstroke (figure 10i–k) when the alula of hoverfly H5 is flipped approximately perpendicular to the rest of the wing, causing the trailing edge of the alula actually to lead the stroke. Figure 11 shows this quantitatively, plotting the angle of incidence of the anal area of the main wing and the angle of incidence of the alula against time through the stroke. The alula of hoverfly H3 has an angle of incidence similar to that of the anal area except after supination when it lags behind the main wing. In contrast, the alula of hoverfly H5 is held at approximately 30° to the anal area during the downstroke and at up to 100° to the anal area during the upstroke.
Figure 10.

Dorsal views of two hoverflies from high-speed video of H3 (a–f) and H5 (g–l). Six stages of the stroke are shown, running from the mid-downstroke to the end of the upstroke. Hoverfly H3 (a–f) shows the alula operating in plane with the rest of the wing, except at supination, when it lags the rest of the wing (c). Hoverfly H5 shows the alula operating in its flipped state, in which it is held at a large angle to the rest of the wing at all stages of the wingbeat (white lettering: a = alula).
Figure 11.
Angle of incidence of the alula (dashed line) and angle of incidence of the anal area of the main wing (solid line) plotted against normalized time through the wingbeat (t̂) for (a) hoverfly H3 and (b) hoverfly H5. The shaded region around each line displays the s.d. over the wingbeats measured. The vertical solid line indicates the start of the upstroke.
4. Discussion
4.1. Stroke angle
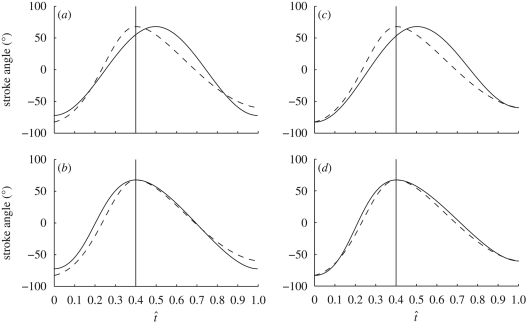
Changes in stroke angle are produced by the indirect flight muscles, which drive the thorax at or near resonance (Nachtigall & Wilson 1967; Miyan & Ewing 1985). Stroke angle is therefore expected to vary according to a simple harmonic function, the frequency and amplitude of which is under active control. In order to test this, we used a regression analysis to determine how much of the variation in stroke angle could be explained using four different models based on harmonic motion. The first model fitted stroke angle from the start of one downstroke to the end of the following upstroke as a simple cosine wave (figure 12a). In this model, the half-period and amplitude of the upstroke are constrained to be the same as the half-period and amplitude of the preceding downstroke. The second model fitted stroke angle as a half-cosine wave between the start and end of each half-stroke, where the half-period was free to vary between successive half-strokes, but the amplitude was constrained to be the same on the upstroke as on the preceding downstroke (figure 12b). The third model fitted stroke angle as a half-cosine wave between the start and end of each half-stroke, where the amplitude was free to vary between successive half-strokes, but the half-period was constrained to be the same on the upstroke as on the preceding downstroke (figure 12c). The fourth model fitted stroke angle as a half-cosine wave between the start and end of each half-stroke, allowing both the amplitude and half-period to vary freely between successive half-strokes (figure 12d).
Figure 12.
Diagrams demonstrating the four harmonic models used to predict how stroke angle varies with normalized time through the wingbeat (t̂). The dashed line represents the measured stroke angle of the wing and the solid line shows the model that is being fitted to the measured data. The vertical line shows the measured start of the upstroke. See text for details of the models fitted.
The first model explains 97.6 per cent of the variation in the stroke angle (based on the R2 value, using a general linear model with hoverfly included as a random factor). Both the second and third models explain a little more of the variation (R2 = 98.5% and 98.8%, respectively), while the fourth model explains almost all of the variation in stroke angle (R2 = 99.7%). We emphasize that all four models predict stroke angle as a simple harmonic function on each half-stroke: the differences between the models relate only to the constraints placed upon successive downstrokes and upstrokes. Our analysis indicates that the stroke angle is almost perfectly modelled as a simple harmonic motion, provided that both the amplitude and the half-period are allowed to vary from one half-stroke to the next. Although this result is not in itself sufficient to demonstrate that hoverflies use changes in half-period and amplitude to effect control of stroke angle, it suggests that a two-parameter model may be suitable for modelling how stroke angle is used to effect flight control. A much higher order model would be required to capture the changes we have measured in deviation angle, angle of incidence and camber (figures 2, 4 and 7). This difference presumably reflects the fact that whereas stroke angle is essentially governed by the resonant properties of the thorax, the deviation angle, angle of incidence and camber are controlled more subtly by direct flight muscles, and are subject to more complex aeroelastic effects.
4.2. Kinematic effects of wing rotation
The wing of a hoverfly rotates rapidly at either extreme of the stroke. Supination more or less coincides with stroke reversal, although distal wing elements pass through 90° before stroke reversal, whereas proximal wing elements pass through 90° after stroke reversal (figure 8). In contrast, pronation lags stroke reversal at all points along the wing (figure 8). This timing of rotation is intriguing as mechanical and numerical models of flapping flight (e.g. Dickinson et al. 1999; Sane & Dickinson 2001; Sun & Tang 2002; Walker 2002; Wang et al. 2004) have consistently shown that advanced wing rotation (when the wing passes through 90° before stroke reversal) results in higher lift than a symmetrical rotation (when the wing passes through 90° at stroke reversal), which in turn results in more lift than a delayed rotation (when the wing passes through 90° after stroke reversal). This suggests that the hoverflies we filmed were not using the highest possible lift, which is consistent with the timing of rotation being used as a control variable to alter the lift being produced (e.g. Ennos 1989). Since some aerodynamic force must be left in reserve for manoeuvres, it is possible that advanced rotation might be used only during ascending flight, accelerations or turns (Dickinson & Götz 1993).
Another possibility is that delayed rotation simply reflects the passive dynamics of the wing's inertial motion (Ennos 1988b; Ishihara et al. 2009). Figure 4 shows that the angle of incidence recoils just after stroke reversal. This has been observed previously in Eristalis, and has been attributed to the large inertial forces produced as the wing accelerates at the start of each half-stroke (Ellington 1984; Ennos 1988b; Liu & Sun 2008). The rotational axis of the wing lies close to the leading edge and ahead of the wing's centre of mass (Ennos 1988b), so the velocity of the trailing edge lags the velocity of the leading edge at stroke reversal (Fig. 7). Bos et al. (2008) used a two-dimensional numerical model to show that this recoil can improve the lift-to-drag ratio of a flapping wing by up to 15 per cent by lowering the effective angle of attack at the start of the downstroke, so that the leading edge vortex continues to generate a large amount of lift, but contributes less drag. The fact that the trailing edge lags the leading edge as the wing rotates also explains the direction of the torsional wave at stroke reversal. This wave passes from tip to root (figures 3 and 8), which is because the lag of the trailing edge increases from tip to root as a result of the wing's increasing chord (Ennos 1988b; see also figure 6b).
Our results show that wing camber also recoils just after stroke reversal (figure 9c,f). This is because of the lag of the trailing edge, which causes a transient increase in camber on a flexible wing (figures 7 and 8c,d). The camber then decreases as the trailing edge catches up with the leading edge, before increasing as the aerodynamic forces on the wing increase (Ennos 1988a). It is unknown whether this recoil in camber has a beneficial effect similar to the recoil in angle of incidence, although as the camber has been shown to be important in the unsteady aerodynamics of insect flight (Du & Sun 2008), it is tempting to speculate that it might.
4.3. Alula
The alula appears only to have been noted as an anatomical feature of the wing (Lowne 1890; Stubbs & Falk 2002) and its motion relative to the rest of the wing has not been described elsewhere. Of the five flight sequences described in detail here, only hoverfly H5 showed the alula operating in a ‘flipped’ state with respect to the rest of the wing. However, among the 78 recordings we made in which both wings were visible in at least two camera views, the alula was seen operating in a flipped state in 54 of the sequences, with five of six hoverflies observed displaying this behaviour. The alula slightly overlaps the wing at rest (Stubbs & Falk 2002), and was only ever flipped dorsally relative to the wing. The left and right alulae operate independently, as we recorded examples of all four possible combinations of state. In some sequences, the alula operated in plane with the wing on one wingbeat flipped with respect to the wing on the next, and returned to its original state on the wingbeat after.
The data we have presented here do not allow us to test whether the movements of the alula are a passive aeroelastic phenomenon, or whether they are subject to active muscular control. The peaked shape of its hinge suggests that the alula might be a bistable structure (see Wootton 1981), and the anatomy of higher Diptera is consistent with the notion that it might be actuated by movements of the third axillary sclerite, which contacts the anal area of the wing (see fig. 6 of Miyan & Ewing 1985). The alulae are hypertrophied in many Diptera, and their ubiquity in these most accomplished fliers is suggestive of an important and general aerodynamic function. We hypothesize that the alula acts as a flow-control device, modifying vortex behaviour in the basal regions of the wing. Future work will test whether the alula operates passively or actively, and will analyse the aerodynamic and kinematic consequences of its deployment.
Acknowledgements
This research was funded principally by the EPSRC and MoD under grant GR/S23049/01 to A.L.R.T. and G.K.T. Part of the research leading to these results has received funding from the European Research Council under the European Community's Seventh Framework Programme (FP7/2007-2013)/ERC grant agreement no. 204513 to G.K.T. G.K.T. is a Royal Society University Research Fellow and RCUK Academic Fellow. We thank Rafał Żbikowski, Andrew Moore, Kevin Knowles, Nicholas Lawson, Brian White, Iain Wallace and Salman Ansari for their contributions to collaborative aspects of this research project. We especially thank Iain Wallace for his assistance with technical aspects of the experimental work. We are also grateful to Charles Bibby for his advice on photogrammetry. We thank the EPSRC equipment loan pool and Nicholas Lawson for lending cameras and lighting.
References
- Bos F. M., Lentik D., van Oudheusden B. W., Bijl H. 2008. Influence of wing kinematics on aerodynamic performance in hovering insect flight. J. Fluid. Mech. 594, 341–368. ( 10.1017/S0022112007009172) [DOI] [Google Scholar]
- Bishop L. G. 1974. An ultraviolet photoreceptor in a dipteran compound eye. J. Comp. Physiol. 91, 267–275. [Google Scholar]
- Colyer C. N., Hammond C. O. 1968. Flies of the British Isles. London, UK: Warne. [Google Scholar]
- Dickinson M. H., Götz K. 1993. Unsteady aerodynamic performance of model wings at low Reynolds numbers. J. Exp. Biol. 174, 45–64. [DOI] [PubMed] [Google Scholar]
- Dickinson M. H., Lehman F. O., Sane S. 1999. Wing rotation and the aerodynamic basis of insect flight. Science 284, 1954–1960. ( 10.1126/science.284.5422.1954) [DOI] [PubMed] [Google Scholar]
- Du G., Sun M. 2008. Effects of unsteady deformation of flapping wings on its aerodynamic forces. Appl. Math. Mech.-Engl. Ed. 29, 731–741. ( 10.1007/s10483-008-0605-9) [DOI] [Google Scholar]
- Ellington C. P. 1984. The aerodynamics of hovering insect flight. iii. Kinematics. Phil. Trans. R. Soc. Lond. B 305, 67–78. ( 10.1098/rstb.1984.0051) [DOI] [Google Scholar]
- Ennos A. R. 1988a. The importance of torsion in the design of insect wings. J. Exp. Biol. 140, 137–160. [Google Scholar]
- Ennos A. R. 1988b. The inertial cause of wing rotation in diptera. J. Exp. Biol. 140, 161–169. [Google Scholar]
- Ennos A. R. 1989. The kinematics and aerodynamics of the free flight of some diptera. J. Exp. Biol. 142, 49–85. [Google Scholar]
- Fry S. N., Sayaman R., Dickinson M. H. 2003. The aerodynamics of free-flight maneuvers in Drosophila. Science 300, 455–505. ( 10.1126/science.1081944) [DOI] [PubMed] [Google Scholar]
- Fry S. N., Sayaman R., Dickinson M. H. 2005. The aerodynamics of hovering flight in Drosophila. J. Exp. Biol. 208, 2303–2318. ( 10.1242/jeb.01612) [DOI] [PubMed] [Google Scholar]
- Horridge G. A., Mimura K., Tsukahara Y. 1975. Fly photoreceptors. II. Spectral and polarized light sensitivity in the drone fly Eristalis. Proc. R. Soc. Lond. B 190, 225–237. ( 10.1098/rspb.1975.0089) [DOI] [PubMed] [Google Scholar]
- Ishihara D., Horie T., Denda M. 2009. A two-dimensional computational study on the fluid-structure interaction cause of wing pitch changes in dipteran flapping flight. J. Exp. Biol. 212, 1–10. ( 10.1242/jeb.020404) [DOI] [PubMed] [Google Scholar]
- Kurtulus D. F., David L., Farcy A. 2008. Aerodynamic characteristics of flapping motion in hover. Exp. Fluids 44, 23–36. ( 10.1007/s00348-007-0369-0) [DOI] [Google Scholar]
- Lehmann F.-O., Pick S. 2007. The aerodynamic benefit of wing-wing interaction depends on stroke trajectory in flapping insect wings. J. Exp. Biol. 210, 1362–1377. ( 10.1242/jeb.02746) [DOI] [PubMed] [Google Scholar]
- Liu Y., Sun M. 2008. Wing kinematics measurement and aerodynamics of hovering droneflies. J. Exp. Biol. 211, 2014–2025. ( 10.1242/jeb.016931) [DOI] [PubMed] [Google Scholar]
- Lowne B. T. 1890. The anatomy, physiology, morphology and development of the blowfly (Calliphora erythrocephala). London, UK: R. H. Porter. [Google Scholar]
- Lua K. B., Lim T. T., Yeo K. S. 2008. Aerodynamic forces and flow fields of a two-dimensional hovering wing. Exp. Fluids 45, 1047–1065. ( 10.1007/s00348-008-0527-z) [DOI] [Google Scholar]
- Miyan J. A., Ewing A. W. 1985. How diptera move their wings: a re-examination of the wing base articulation and muscle systems concerned with flight. Phil. Trans. R. Soc. Lond. B 311, 271–302. ( 10.1098/rstb.1985.0154) [DOI] [Google Scholar]
- Nachtigall W., Wilson D. M. 1967. Neuro-muscular control of dipteran flight. J. Exp. Biol. 47, 77–97. [DOI] [PubMed] [Google Scholar]
- Ramamurti R., Sandberg W. C. 2002. A three-dimensional computational study of the aerodynamic mechanisms of insect flight. J. Exp. Biol. 205, 1507–1518. [DOI] [PubMed] [Google Scholar]
- Sane S. P., Dickinson M. H. 2001. The control of flight force by a flapping wing: lift and drag production. J. Exp. Biol. 204, 2607–2626. [DOI] [PubMed] [Google Scholar]
- Shyy W., Berg M., Ljungqvist D. 1999. Flapping and flexible wings for biological and micro air vehicles. Progr. Aerospace Sci. 35, 455–505. ( 10.1016/S0376-0421(98)00016-5) [DOI] [Google Scholar]
- Stubbs A. E., Falk S. J. 2002. British hoverflies: an illustrated identification guide. Reading, UK: British Entomological and Natural History Society. [Google Scholar]
- Sun M., Tang J. 2002. Unsteady aerodynamic force generation by a model fruit fly wing in flapping motion. J. Exp. Biol. 205, 55–70. [DOI] [PubMed] [Google Scholar]
- Tang J., Viieru D., Shyy W. 2007. Effects of Reynolds number and flapping kinematics on hovering aerodynamics. AIAA 2007-129. [Google Scholar]
- Vanella M., Fitzgerald T., Preidikman S., Balaras E., Balachandran B. 2009. Influence of flexibility on the aerodynamic performance of a hovering wing. J. Exp. Biol. 212, 96–105. ( 10.1242/jeb.016428) [DOI] [PubMed] [Google Scholar]
- Walker J. A. 2002. Rotational lift: something different or more of the same? J. Exp. Biol. 205, 3783–3792. [DOI] [PubMed] [Google Scholar]
- Walker S. M., Thomas A. L. R., Taylor G. K. 2009. Photogrammetric reconstruction of high-resolution surface topographies and deformable wing kinematics of tethered locusts and free-flying hoverflies. J. R. Soc. Interface 6, 351–366. [DOI] [PMC free article] [PubMed] [Google Scholar]
- Walker S. M., Thomas A. L. R., Taylor G. K. Deformable wing kinematics in the desert locust: how and why do camber, twist and topography vary through the stroke? J. R. Soc. Interface. doi: 10.1098/rsif.2008.0435. In press. ( ) [DOI] [PMC free article] [PubMed] [Google Scholar]
- Wang Z. J. 2000. Vortex shedding and frequency selection in flapping flight. J. Fluid Mech. 410, 323–341. ( 10.1017/S0022112099008071) [DOI] [Google Scholar]
- Wang Z. J., Birch J. M., Dickinson M. H. 2004. Unsteady forces and flows in low Reynolds number hovering flight: two-dimensional computations vs. robotic wing experiments. J. Exp. Biol. 207, 449–460. ( 10.1242/jeb.00739) [DOI] [PubMed] [Google Scholar]
- Weis-Fogh T. 1972. Energetics of hovering flight in hummingbirds and in Drosophila. J. Exp. Biol. 56, 79–104. [Google Scholar]
- Weis-Fogh T. 1973. Quick estimates of flight fitness in hovering animals, including novel mechanism for lift production. J. Exp. Biol. 59, 169–230. [Google Scholar]
- Willmott A. P., Ellington C. P. 1997. The mechanics of flight in the hawkmoth Manduca sexta I. kinematics of hovering and forward flight. J. Exp. Biol. 200, 2705–2722. [DOI] [PubMed] [Google Scholar]
- Wootton R. J. 1981. Support and deformability in insect wings. J. Zool. Lond. 193, 447–468. [Google Scholar]
- Wu J. H., Sun M. 2004. Unsteady aerodynamic forces of flapping flight. J. Exp. Biol. 207, 1137–1150. ( 10.1242/jeb.00868) [DOI] [PubMed] [Google Scholar]
- Żbikowski R. 2002. On aerodynamic modelling of an insect-like flapping wing in hover for micro air vehicles. Phil. Trans. R. Soc. Lond. A 360, 273–290. [DOI] [PubMed] [Google Scholar]
- Żbikowski R., Galinski C., Pedersen C. 2006. Four-bar linkage mechanism for insectlike flapping wings in hover: Concept and an outline of its realization. J. Mech. Design 127, 817–824. ( 10.1115/1.1829091) [DOI] [Google Scholar]
- Zuo D., Chen W., Peng S., Zhang W. 2006. Modeling and simulation study of an insect-like flapping-wing micro aerial vehicle. Adv. Robot. 20, 807–824. ( 10.1163/156855306777681393) [DOI] [Google Scholar]


