Abstract
The relationship between skull shape and the forces generated during feeding is currently under widespread scrutiny and increasingly involves the use of computer simulations such as finite element analysis. The computer models used to represent skulls are often based on computed tomography data and thus are structurally accurate; however, correctly representing muscular loading during food reduction remains a major problem. Here, we present a novel approach for predicting the forces and activation patterns of muscles and muscle groups based on their known anatomical orientation (line of action). The work was carried out for the lizard-like reptile Sphenodon (Rhynchocephalia) using a sophisticated computer-based model and multi-body dynamics analysis. The model suggests that specific muscle groups control specific motions, and that during certain times in the bite cycle some muscles are highly active whereas others are inactive. The predictions of muscle activity closely correspond to data previously recorded from live Sphenodon using electromyography. Apparent exceptions can be explained by variations in food resistance, food size, food position and lower jaw motions. This approach shows considerable promise in advancing detailed functional models of food acquisition and reduction, and for use in other musculoskeletal systems where no experimental determination of muscle activity is possible, such as in rare, endangered or extinct species.
Keywords: muscle activation, multi-body modelling, skull loading, food handling, feeding
1. Introduction
The skull serves diverse mechanical, structural, protective, sensory and other functions. Significant regular mechanical loading arises from food acquisition and processing, and therefore skull morphology is thought largely to reflect mechanical adaptation to this key role (e.g. Dumont 2005; Witzel & Preuschoft 2005). Finite element analysis (FEA) represents a significant development in the investigation of skull biomechanics, and has been used to assess stress and strain distributions in skulls consequent upon diverse loadings designed to model aspects of food acquisition and processing (e.g. Rayfield et al. 2001; Grosse et al. 2007; Kupczik et al. 2007; McHenry et al. 2007; Wroe et al. 2007; Curtis et al. 2008; Moazen et al. 2008; Moreno et al. 2008). This technique has also been used to investigate the extent to which skull morphology is optimized to its mechanical functions by iteratively adapting initial simple geometries to stress patterns arising from diverse loading scenarios (Witzel & Preuschoft 1999, 2002, 2005; Preuschoft & Witzel 2004). Whereas most FEA studies load skulls by applying estimated peak muscle forces, a better approximation of skull loading may be achieved where experimental data on muscle activation exist (e.g. Hylander et al. 1987; Ross et al. 2005; Strait et al. 2005, 2007).
Theoretical optimization provides an alternative means of predicting muscle forces and activation patterns. This approach is advantageous because it can be used when experimental muscle data are unavailable, as they may be for endangered or extinct taxa, or in small animals that cannot be handled effectively. In general, muscle optimization techniques (e.g. Crowninshield & Brand 1981; Dul et al. 1984) find the muscle activation pattern for a particular movement or bite force that minimizes some quantity, such as overall muscle stress (e.g. Anderson & Pandy 2002; Thelen et al. 2003; Heintz & Gutierrez-Farewik 2007). However, different optimization criteria can result in different predicted muscle activations, and a single optimization approach may well find several equally optimal muscle activation patterns.
This paper describes and validates a different approach that models the activity and function of muscles in producing specific motions (here we use kinematic data as the target) depending on their geometric relationships to the structures on which they act. We refer to this approach as Dynamic Geometric Optimization or DGO. Our example concerns principally planar motions, but the general approach is readily extensible to three dimensions where appropriate. We begin with a target motion and activate muscles to generate this. When individual muscles are activated, they pull the lower jaw in a particular direction, depending on their origin and insertion points. The working assumption of DGO is that the orientation, or line of action, of a muscle is optimal for a specific movement of the lower jaw. Therefore, DGO uses the line of action of each muscle to define vertical and horizontal activation characteristics, activating each muscle to generate lower jaw motions according to kinematic data decomposed into the same vertical and horizontal components. The activation components in each direction are then used to estimate total activation at each point in the motion cycle. A detailed explanation of DGO is provided in §2.
In order to demonstrate DGO, we model a biting cycle of the lepidosaurian reptile Sphenodon (Gorniak et al. 1982) (tuatara of New Zealand) using a multi-body dynamics approach. This animal was chosen because it is the only living rhynchocephalian (Jones 2008) and therefore important for inferring the homology and evolution of soft tissues and behaviour in other amniotes (e.g. Schwenk 1988; Townsend et al. 2004; Vidal & Hedges 2005; Holliday & Witmer 2007; Ross et al. 2007). Sphenodon also possesses a unique feeding mechanism among living amniotes (Gorniak et al. 1982; Reilly et al. 2001; Schaerlaeken et al. 2008). Following jaw closure, the lower jaw slides forwards a few millimetres and shears food gripped between the teeth on the lower jaw and those on the upper jaw and palate (Robinson 1976).
Multi-body modelling or multi-body dynamics analysis (MDA) is principally an engineering tool that is now beginning to be used within biomechanical investigations (e.g. Peck et al. 2000; Sellers & Crompton 2004; Curtis et al. 2008; Moazen et al. 2008). In simple terms, MDA works by defining rigid-body motions or applying forces to an object or group of objects; this then returns resulting forces or motions. Software is commercially available to carry out MDA, where equations of motion for a particular problem are formulated through a system of rigid bodies and constraints. Initially, all parts possess six degrees of freedom, but this freedom can be easily reduced via pre-defined or customized constraints. During a dynamic analysis (applicable when a system has more than one degree of freedom), a set of nonlinear differential equations is obtained that describes the constraints, forces and/or motions that are applied to the system; these are then solved for each instant of time within the software. The results of such a procedure include motions, reaction forces and spring/muscle forces. Here we use MDA to examine muscle activity in Sphenodon and demonstrate the potential of this technique for addressing a wide range of issues in functional morphology.
2. Material and methods
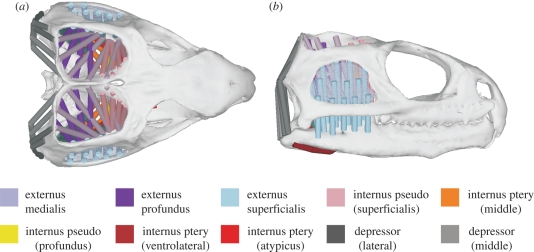
A highly detailed muscular model was created using ADAMS MDA software (MSC Software Corp., USA). Muscle anatomy and relations were derived from anatomical observations and incorporated into the model as 10 individual muscle groups. These muscle groups included the jaw-closing m. adductor mandibulae externus, internus and posterior and the jaw-opening m. depressor mandibulae (see figure 1). Each muscle group was represented by a series of muscle sections that correspond to anatomical data (e.g. Gorniak et al. 1982).
Figure 1.
(a) Dorsal and (b) lateral view of the multi-body muscle model. Pseudo is short for pseudotemporalis and ptery is short for pterygoideus.
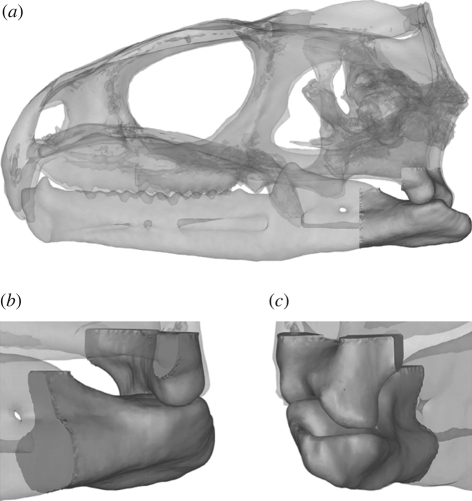
In this system, mass and inertial properties are assigned to all moveable objects, and forces can either be applied directly or be derived through spring (or spring-like) elements. With respect to the current study, a multi-body model of the skull of Sphenodon was constructed from micro-computed tomography (micro-CT) datasets. It consisted of a cranium and the left and right lower jaws (specimen LDUCZ x036; Grant Museum of Zoology, UCL). Unconstrained surface contact was specified at the quadrate–articular joints and also between different teeth of the lower and upper jaws. Accurate joint geometries were created from the micro-CT datasets, allowing the articular surface of the lower jaw to move freely, constrained only by the geometry of the contact surfaces, against the cranial (quadrate) articulating surface. For a view of the joint surfaces, see figure 2. The lower jaws of Sphenodon meet anteriorly at an unfused non-rigid symphysis connected by soft tissue (Robinson 1976), which allows the angle between the jaws in the horizontal plane to change. This is necessary in order for shearing to take place because of the geometric constraints of the jaw joint surfaces (see figure 2). Here the lower jaws were micro-CT scanned as disarticulated bones, and the resulting three-dimensional geometries were connected at their anterior symphysis via a simple hinge; this permitted medio-lateral displacements at the jaw joints.
Figure 2.
Three-dimensional representation of the quadrate–articular joint modelled in this study. (a) Lateral view of the full model; (b) enlarged anterolateral view of the joint; (c) enlarged posterolateral view of the joint.
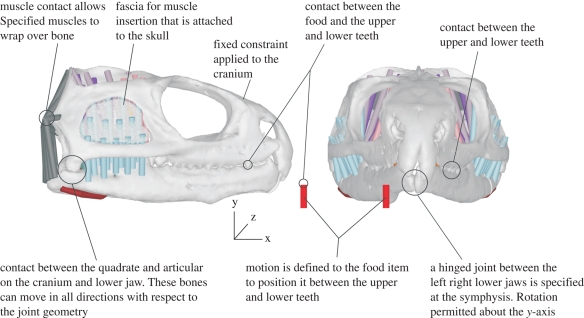
A fixation point was specified on the cranium, which orientated the model in space throughout all simulations. All other motions were dictated by the tensions in the muscles and the geometries of the jaw joints. All muscles were represented as force-generating elements (muscle sections shown in figure 1) attached to the cranium and the lower jaws. Some sections of the m. adductor mandibulae externus superficialis (blue in figure 1) attached to a sheet spanning the lower temporal fenestra, representing fasciae that for simplicity were rigidly attached to the cranium. Also note that in this model the m. depressor mandibulae, the m. pterygoideus atypicus and parts of the m. pterygoideus typicus wrapped around bony geometries, while all other muscle groups passed directly from origin to insertion linearly. Figure 3 presents the full model, highlighting all constraints and degrees of freedom.
Figure 3.
Lateral and anterior views of the MDA model highlighting constraints, contacts and freedom of movement of all parts.
2.1. Dynamic geometric optimization
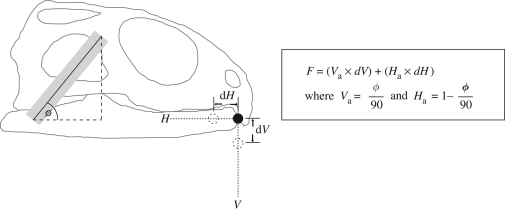
Here, we explain in detail how the MDA model generates muscle forces. In DGO, estimation of muscle activity is approached by making a key assumption—that the muscular anatomy, in terms of origin, insertion and any intervening structure that alters line of action, is optimized for function. Here, this function is related directly to the lower jaw motions. Working with this assumption, the geometry or more specifically the lines of action of the muscles of Sphenodon are first estimated through anatomical investigation. From the lateral view the instantaneous angulation (vector) of each individual muscle is found, and then used to derive ‘vertical’ and ‘horizontal’ activation factors (these activation factors are directly related to the components of the muscle vector, see figure 4). When a muscle wraps over bone, the vector acting directly on the lower jaw is the one used in calculations.
Figure 4.
Muscle force calculation. F, muscle force; Va, vertical activation factor; Ha, horizontal activation factor; dV, gap between tip of lower jaw and vertical motion reference point; dH, gap between tip of lower jaw and horizontal motion reference point. V and H represent the full vertical and horizontal paths of the kinematic data. Solid grey rectangle represents muscle; the dashed circles represent the motion reference positions and the solid circle represents the rostral tip of the lower jaw.
In vivo movements of the head are initiated and controlled through complex neural control mechanisms. In silico we reverse the situation by specifying that the tip of the lower jaw should follow a reference point on a pre-defined motion path. Two motion paths are derived from kinematic data, these being the decomposition of the whole motion into vertical and horizontal components. These kinematic data are derived from Gorniak et al. (1982), who plot vertical and horizontal displacements of the tip of the lower jaw throughout a biting cycle. Muscle forces are calculated based on location differences between the tip of the lower jaw and the motion reference points.
The reader is advised to consult figure 4. At time zero, when the jaws are shut the vertical reference point (V) and the horizontal reference point (H) are positioned at the tip of the lower jaw. As the simulation advances, V and H displace along their respective motion paths and a gap is formed between the reference points and the tip of the lower jaw. This gap is proportional to muscle force. As the gap increases, the force within the muscles increases, until it reaches a magnitude sufficient to move the lower jaw. Since the muscles are characterized by their line of action, each muscle reacts differently to V and H (i.e. a more horizontally aligned muscle will react more to the horizontal reference point). Muscle forces will increase until the lower jaw follows, as best it can, the reference points that are moving along the pre-defined motion paths. If movement of the lower jaw is obstructed (e.g. by food), then greater muscle forces are generated to allow the lower jaw to follow the reference points. This method of force generation is unique to this study, allowing investigations into muscle control and skull kinematics.
In the MDA model, each muscle section carries a specific combination of vertical and horizontal activation characteristics based on its orientation, in addition to a small passive tension. The passive tension within all muscle sections increases exponentially with muscle extension (Hill 1953; Gordon et al. 1966; Woittiez et al. 1983), up to a maximum value of 0.15 N. The main purpose of setting a passive tension in the simulations was to offer resistance to the jaw-opening muscles as the jaw opens. Investigative simulations (not published) revealed that a force of approximately 12 N was generated in the m. depressor mandibulae during opening when a maximum passive tension of 0.15 N was specified. This is comparable to estimates of peak muscle force based on cross-sectional area (formulated from muscle weight and fibre length data presented by Gorniak et al. 1982).
2.2. Simulations
As stated above, vertical and horizontal motion paths were defined at the tip of each lower jaw to describe a lower jaw-opening and -closing cycle representative of Sphenodon; these motion paths were derived from Gorniak et al. (1982), whose data are consistent with our own (unpublished) in vivo observations and video recordings of live animals eating. The vertical displacements increase to a maximum of 25 mm (equivalent gape of 25°) and a horizontal shearing occurs over a distance of approximately 3 mm at the end of the biting cycle.
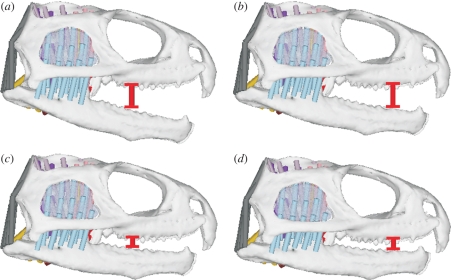
A representative food item was placed unilaterally in the mouth during the closing phase to induce a biting/crushing simulation. This ‘food item’ consisted of a resisting spring sandwiched between two rigid contact plates. Contact was specified between the food plates and the teeth and a resistance was assigned to the spring. This resistance was proportional to the bite force required to deform the food. For the purposes of this study, the food had a peak vertical resistance (to deformation) of 50 N, which was maintained until the food had almost fully deformed; at this stage the crushing phase of the biting cycle was complete. The food also carried a shear (horizontal) resistance of 5 N. The goal of applying a vertical and a horizontal food resistance was to initiate a crushing and a shearing response in the muscles. The exact magnitudes were not important in this study as long as they were sufficient to induce muscular activity. Food items with a thickness of 4 and 9 mm and bite positions approximately 30 and 20 mm from the rostral tip of the cranium were modelled (see figure 5). For the posterior (caudal) food position, crushing began at gapes of approximately 13° and 5° for the larger and smaller food items, respectively; for the anterior (rostral) food position, crushing began at gapes of approximately 10° and 4° for the larger and smaller food items, respectively. Shearing always began when the lower jaw was almost closed (approx. a 3 mm vertical gap between the teeth). An animation of a biting cycle is available as electronic supplementary information (see ESM1).
Figure 5.
Biting (a) a larger food item at a more posterior (caudal) position in the mouth; (b) a larger food item at a more anterior (rostral) position in the month; (c) a smaller food item at a more posterior (caudal) position in the mouth; (d) a smaller food item at a more anterior (rostral) position in the mouth.
3. Results
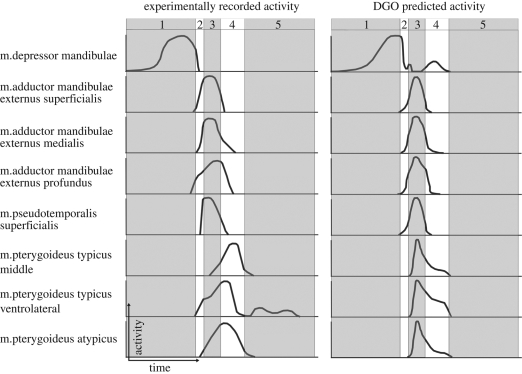
Figure 6 presents a comparison between the experimental muscle activation data of Gorniak et al. (1982) and the DGO predictions in this multi-body study (sample muscle activity from the more posterior bite position with the larger food item). For the purposes of this study, the most important aspect for comparison is the timing of the muscle activity throughout the biting cycle. Here we see that in both the real and predicted activations during jaw opening only the m. depressor mandibulae is active, and it retains some activity until the onset of the crushing phase (more so with DGO). The m. adductor mandibulae externus (superficialis, medialis and profundus) and the m. pseudotemporalis superficialis are predominately active during the crushing phase of the biting cycle. However, during the shearing phase, where horizontal motion was prevalent, m. pterygoideus shows the greatest activity. Figure 7 shows sample muscle activity plots when biting foods of varying size; figure 8 shows a sample muscle activity plot when biting foods of varying resistance; and figure 9 shows a sample muscle activity plot when biting at different positions in the mouth.
Figure 6.
Comparison of experimentally recorded activation data (adapted from Gorniak et al. (1982)) and activation data predicted through dynamic geometry optimization. 1, jaw-opening phase; 2, jaw-closing phase; 3, food-crushing phase; 4, anterior jaw-shearing phase; 5, resting phase. The bar chart data of Gorniak et al. (1982) have been redrawn as curves and all plots have been scaled to peak activity. y-axis relates to muscle activity and x-axis relates to time/biting phases.
Figure 7.
Muscle activity in the m. adductor mandibulae externus medialis and m. depressor mandibulae when biting a larger and a smaller food item. 1, jaw-opening phase; 2, jaw-closing phase; 3, food-crushing phase; 4, anterior jaw-shearing phase; 5, resting phase. Plots scaled so to peak muscle activity. y-axis relates to muscle activity and x-axis relates to time/biting phases.
Figure 8.
Muscle activity in the m. pterygoideus typicus middle when biting (a) a food item with a 50 N vertical and 5 N horizontal resistance and (b) a food item with a 30 N vertical and 15 N horizontal resistance. 1, jaw-opening phase; 2, jaw-closing phase; 3, food-crushing phase; 4, anterior jaw-shearing phase; 5, resting phase. Plots scaled so to peak muscle activity. y-axis relates to muscle activity and x-axis relates to time/biting phases.
Figure 9.
Muscle activity in the m. adductor mandibulae superficialis when biting at a more posterior (caudal) bite point and a more anterior (rostral) bite point in the mouth. 1, jaw-opening phase; 2, jaw-closing phase; 3, food-crushing phase; 4, anterior jaw-shearing phase; 5, resting phase. Plots scaled so to peak muscle activity. y-axis relates to muscle activity and x-axis relates to time/biting phases.
4. Discussion
The purpose of this investigation was to evaluate whether DGO could predict muscle activity within different muscle groups during a biting cycle. If successful, this novel approach could help generate a wealth of data on muscle performance, not only in skulls but potentially in any part of the musculoskeletal system. Unconstrained and anatomically accurate contact at the quadrate–articular joints and free contact at the bite points are used in a computer-based model for the first time. This represents a significant advance over previous models (e.g. Cleuren et al. 1995; Langenbach et al. 2002; Sellers & Crompton 2004; Curtis et al. 2008; Moazen et al. 2008) (see figure 2).
Experimentally in Sphenodon, Gorniak et al. (1982) reported that the m. depressor mandibulae was active only during jaw opening, whereas DGO predicts muscle activity during early jaw closing and shearing. However, activity has been recorded in this muscle during jaw closing in other animals (e.g. Throckmorton 1978; Herrel et al. 1995, 1997, 1999). The m. depressor mandibulae, the only major muscle group to oppose jaw closing in Sphenodon, would aid in controlling jaw-closing velocities and position. From figure 6 we see that DGO predicted activity in the m. depressor mandibulae during the shearing phase of the biting cycle, which directly corresponds to the increased activity in the m. pterygoideus (all sections). This agrees with EMG data (equivalent to the power stroke) from Uromastyx, Plocederma stellio and Corucia zebrata (Throckmorton 1978; Herrel et al. 1995, 1997, 1999). As these shearing muscles activate to move the lower jaw anteriorly (rostrally), they also apply a vertical component of force, and to stop the jaw closing too quickly, or to reduce the contact forces on the teeth, the m. depressor mandibulae is activated to add control and stability to the shearing motion.
When biting a larger food item, the crushing phase of the biting cycle occurs at a greater gape (compared with biting a smaller food item, see figure 5), and with activity in all jaw-closing muscles, a more posterior (caudal) lower jaw position is maintained until the onset of shearing. However, contact with a smaller food item occurs at a lower gape and requires additional activity in specific muscle groups (i.e. muscles with caudal origins with respect to their insertions) to maintain a posterior (caudal) lower jaw position in preparation for shearing. For example, figure 7 plots the activity of the m. adductor mandibulae externus medialis, showing increased activity during early jaw closing when biting smaller foods. Note that force generation in the m. adductor mandibulae externus medialis affects the activity of the m. depressor mandibulae.
With the initial food parameters, the activity predicted by DGO in the m. pterygoideus muscle groups differs from that measured experimentally in Sphenodon by Gorniak and co-workers (see figure 6). These differences can, however, be explained by varying food resistance properties. An increase in food shear resistance requires an increase in the activity of the shearing muscles, resulting in different activity plots as shown in figure 8. Bite point also has an effect on muscle activity, with a more posterior (caudal) bite requiring lower activation levels than a more anterior (rostral) bite (see figure 9). These data correspond to lever mechanics theory and experimental observations that bite forces are greater at the back of the mouth (e.g. Hylander 1975; Spencer 1998; Dumont & Herrel 2003).
DGO shows considerable promise as a tool to predict muscle activity in the skull, but also with regard to other aspects of functional morphology. A predicted sequence of muscle activity throughout the biting cycle in Sphenodon compares well with experimental data, and, where differences are found, additional models have shown that these can be attributed to differences in bite point and food resistance. Further investigations need to be carried out to assess the mechanisms of food capture and reduction in other reptiles, such as the quadrate-crank mechanism that has been associated with the skull of a gecko, for example. Mammals are also known to bite/chew differently from lepidosaurs (e.g. Ross et al. 2007), and as such may possess more complex or different muscle control mechanisms. These methods can be used to derive detailed functional models of food handling and should also be applicable to other bone/muscle complexes (e.g. limbs), especially where no experimental muscle activity data are available, such as in rare, endangered or extinct species.
Acknowledgements
This research was funded by BBSRC grants (BB/E007465/1, BB/E009204/1 and BB/E007813/1) awarded to S.E.E. (UCL), M.J.F. (University of Hull) and P.O'H. (Hull York Medical School), respectively. Funding for earlier projects that this work builds upon was provided by the Leverhulme Trust (F/00 224/I—The biomechanics of primate facial architecture: biology and evolution). We are always grateful to Mehran Moazen for his continuous support.
References
- Anderson F. C., Pandy M. G. 2002. Individual muscle contributions to support in normal walking. Gait Posture 17, 159–169. ( 10.1016/S0966-6362(02)00073-5) [DOI] [PubMed] [Google Scholar]
- Cleuren J., Aerts P., De Vree F. 1995. Bite and joint force analysis in Caiman crocodilus. Belg. J. Zool. 125, 79–94. [Google Scholar]
- Crowninshield R. D., Brand R. A. 1981. A physiologically based criterion of muscle force prediction in locomotion. J. Biomech. 14, 793–801. ( 10.1016/0021-9290(81)90035-X) [DOI] [PubMed] [Google Scholar]
- Curtis N., Kupczik K., O'Higgins P., Moazen M., Fagan M. J. 2008. Predicting skull loading: applying multibody dynamics analysis to a Macaque skull. Anat. Rec. 291, 491–501. ( 10.1002/ar.20689) [DOI] [PubMed] [Google Scholar]
- Dul J., Johnson G. E., Shiavi R., Townsend M. A. 1984. Muscular synergism—II. A minimum fatigue criterion for load sharing between synergistic muscles. J. Biomech. 17, 675–684. ( 10.1016/0021-9290(84)90121-0) [DOI] [PubMed] [Google Scholar]
- Dumont E. R. 2005. Finite-element analysis of biting behavior and bone stress in the facial skeletons of bats. Anat. Rec. Part A 238A, 319–330. ( 10.1002/ar.a.20165) [DOI] [PubMed] [Google Scholar]
- Dumont E. R., Herrel A. 2003. The effects of gape angle and bite point on bite force in bats. J. Exp. Biol. 206, 2117–2123. ( 10.1242/jeb.00375) [DOI] [PubMed] [Google Scholar]
- Gordon A. M., Huxley A. F., Julian F. J. 1966. The variation in isometric tension with sarcomere length in vertebrate muscle fibres. J. Physiol. 184, 170–192. [DOI] [PMC free article] [PubMed] [Google Scholar]
- Gorniak G. C., Rosenberg H. I., Gans C. 1982. Mastication in the tuatara, Sphenodon punctatus (Reptilia: Rhynchocephalia): structure and activity of the motor system. J. Morphol. 171, 321–353. ( 10.1002/jmor.1051710307) [DOI] [PubMed] [Google Scholar]
- Grosse I. R., Dumont E. R., Coletta C., Tolleson A. 2007. Techniques for modeling muscle-induced forces on finite element models of skeletal structures. Anat. Rec. 290, 1069–1088. ( 10.1002/ar.20568) [DOI] [PubMed] [Google Scholar]
- Heintz S., Gutierrez-Farewik E. M. 2007. Static optimization of muscle forces during gait in comparison to EMG-to-force processing approach. Gait Posture 26, 279–288. ( 10.1016/j.gaitpost.2006.09.074) [DOI] [PubMed] [Google Scholar]
- Herrel A., Cleuren J., De Vree F. 1995. Prey capture in the lizard Agama stellio. J. Morphol. 224, 313–329. ( 10.1002/jmor.1052240306) [DOI] [PubMed] [Google Scholar]
- Herrel A., Cleuren J., De Vree F. 1997. Quantitative analysis of jaw and hyolingual muscle activity during feeding in the lizard Agama stellio. J. Exp. Biol. 200, 101–115. [DOI] [PubMed] [Google Scholar]
- Herrel A., Verstappen M., De Vree F. 1999. Modulatory complexity of the feeding repertoire in scincid lizards. J. Comp. Physiol. 184, 501–518. ( 10.1007/s003590050350) [DOI] [Google Scholar]
- Hill A. V. 1953. Mechanics of active muscles. Proc. R. Soc. Lond. B 141, 104–117. ( 10.1098/rspb.1953.0027) [DOI] [PubMed] [Google Scholar]
- Holliday C. M., Witmer L. M. 2007. Archosaur adductor chamber evolution: integration of musculoskeletal and topological criteria in jaw muscle homology. J. Morphol. 268, 457–484. ( 10.1002/jmor.10524) [DOI] [PubMed] [Google Scholar]
- Hylander W. L. 1975. The human mandible: lever or link? Am. J. Phys. Anthropol. 43, 227–242. ( 10.1002/ajpa.1330430209) [DOI] [PubMed] [Google Scholar]
- Hylander W. L., Johnson K. R., Crompton A. W. 1987. Loading patterns and jaw movements during mastication in Macaca fascicularis: a bone-strain, electromyographic, and cineradiographic analysis. Am. J. Phys. Anthropol. 72, 287–314. ( 10.1002/ajpa.1330720304) [DOI] [PubMed] [Google Scholar]
- Jones M. E. H. 2008. Skull shape and feeding strategy in Sphenodon and other Rhynchocephalia (Diapsida: Lepidosauria). J. Morphol. 269, 945–966. ( 10.1002/jmor.10634) [DOI] [PubMed] [Google Scholar]
- Kupczik K., et al. 2007. Assessing mechanical function of the zygomatic region in macaques: validation and sensitivity testing of finite element models. J. Anat. 210, 41–53. ( 10.1111/j.1469-7580.2006.00662.x) [DOI] [PMC free article] [PubMed] [Google Scholar]
- Langenbach G. E. J., Zhang F., Herring S. W., Hannam A. G. 2002. Modelling the masticatory biomechanics of a pig. J. Anat. 201, 383–393. ( 10.1046/j.0021-8782.2002.00108.x) [DOI] [PMC free article] [PubMed] [Google Scholar]
- McHenry C. R., Wroe S., Clausen P. D., Moreno K., Cunningham E. 2007. Super-modeled sabercat, predatory behaviour in Smilodon fatalis revealed by high-resolution 3-D computer simulation. Proc. Natl Acad. Sci. USA 104, 16 010–16 015. ( 10.1073/pnas.0706086104) [DOI] [PMC free article] [PubMed] [Google Scholar]
- Moazen M., Curtis N., Evans S. E., O'Higgins P., Fagan M. J. 2008. Rigid-body analysis of a lizard skull: modelling the skull of Uromastyx hardwickii. J. Biomech. 41, 1274–1280. ( 10.1016/j.jbiomech.2008.01.012) [DOI] [PubMed] [Google Scholar]
- Moreno K., et al. 2008. Cranial performance in the Komodo dragon (Varanus komodoensis) as revealed by high-resolution 3-D finite element analysis. J. Anat. 212, 736–746. ( 10.1111/j.1469-7580.2008.00899.x) [DOI] [PMC free article] [PubMed] [Google Scholar]
- Peck C. C., Langenbach G. E. J., Hannam A. G. 2000. Dynamic simulation of muscle articular properties during human wide jaw opening. Arch. Oral Biol. 45, 963–982. ( 10.1016/S0003-9969(00)00071-6) [DOI] [PubMed] [Google Scholar]
- Preuschoft H., Witzel U. 2004. Functional structure of the skull in hominoidea. Folia Primatol. 75, 219–252. ( 10.1159/000078936) [DOI] [PubMed] [Google Scholar]
- Rayfield E. J., et al. 2001. Cranial design and function in a large theropod dinosaur. Nature 409, 1033–1037. ( 10.1038/35059070) [DOI] [PubMed] [Google Scholar]
- Reilly S. M., McBrayer L. D., White T. D. 2001. Prey processing in amniotes: biomechanical and behavioural patterns of food reduction. Comp. Biochem. Physiol. A128, 397–415. ( 10.1016/S1095-6433(00)00326-3) [DOI] [PubMed] [Google Scholar]
- Robinson P. L. 1976. How Sphenodon and Uromastix grow their teeth and use them. In Morphology and biology of the reptiles (eds Bellairs A. d'A., Cox C. B.), pp. 43–64. London, UK: Academic Press. [Google Scholar]
- Ross C. F., et al. 2005. Modeling masticatory muscle force in finite element analysis: sensitivity analysis using principal coordinates analysis. Anat. Rec. 283A, 288–299. ( 10.1002/ar.a.20170) [DOI] [PubMed] [Google Scholar]
- Ross C. F., et al. 2007. Modulation of intra-oral processing in mammals and lepidosaurs. Int. Comp. Biol. 47, 118–136. ( 10.1093/icb/icm044) [DOI] [PubMed] [Google Scholar]
- Schaerlaeken V., Herrel H., Aerts P., Ross C. F. 2008. The functional significance of the lower temporal bar in Sphenodon punctatus. J. Exp. Biol. 211, 3908–3914. ( 10.1242/jeb.021345) [DOI] [PubMed] [Google Scholar]
- Schwenk K. 1988. Comparative morphology of the lepidosaur tongue and its relevance to squamate phylogeny. In Phylogenetic relationships of the lizard families: essays commemorating Charles L. Camp (eds Estes R., Pregill G.), pp. 569–598. Palo Alto, CA: Stanford University Press. [Google Scholar]
- Sellers W. I., Crompton R. H. 2004. Using sensitivity analysis to validate the predictions of a biomechanical model of bite forces. Ann. Anat. 186, 89–95. [DOI] [PubMed] [Google Scholar]
- Spencer M. A. 1998. Force production in the primate masticatory system: electromyographic tests of biomechanical hypotheses. J. Hum. Evol. 34, 25–54. ( 10.1006/jhev.1997.0180) [DOI] [PubMed] [Google Scholar]
- Strait D. S., et al. 2005. Modeling elastic properties in finite element analysis: how much precision is needed to produce an accurate model? Anat. Rec. 283A, 275–287. ( 10.1002/ar.a.20172) [DOI] [PubMed] [Google Scholar]
- Strait D. S., Richmond B. G., Spencer M. A., Ross C. F., Dechow P. C., Wood B. A. 2007. Masticatory biomechanics and its relevance to early hominid phylogeny: an examination of palatal thickness using finite-element analysis. J. Hum. Evol. 52, 585–599. ( 10.1016/j.jhevol.2006.11.019) [DOI] [PubMed] [Google Scholar]
- Thelen D. G., Anderson F. C., Delp S. L. 2003. Generating dynamic simulations of movement using computed muscle control. J. Biomech. 36, 321–328. ( 10.1016/S0021-9290(02)00432-3) [DOI] [PubMed] [Google Scholar]
- Throckmorton G. S. 1978. Action of the pterygoideus muscle during feeding in the lizard Uromastix aegyptius (Agamidae). Anat. Rec. 190, 217–222. ( 10.1002/ar.1091900205) [DOI] [PubMed] [Google Scholar]
- Townsend T. M., Larson A., Louis E., Macey J. R. 2004. Molecular phylogenetics of squamates: the position of snakes, amphisbaenians and dibamids, and the root of the squamate tree. Syst. Biol. 53, 735–757. ( 10.1080/10635150490522340) [DOI] [PubMed] [Google Scholar]
- Vidal N., Hedges S. B. 2005. The phylogeny of squamate reptiles (lizards, snakes, and amphisbaenians) inferred from nine nuclear protein-coding genes. C. R. Biol. 328, 1000–1008. ( 10.1016/j.crvi.2005.10.001) [DOI] [PubMed] [Google Scholar]
- Witzel U., Preuschoft H. 1999. The bony roof of the nose in humans and other primates. Zool. Anz. 238, 103–115. [Google Scholar]
- Witzel U., Preuschoft H. 2002. Function-dependent shape characteristics of the human skull. Anthropol. Anz. 60, 113–135. [PubMed] [Google Scholar]
- Witzel U., Preuschoft H. 2005. Finite-element model construction for the virtual synthesis of the skulls in vertebrates: case study of Diplodocus. Anat. Rec. Part A 238A, 391–401. [DOI] [PubMed] [Google Scholar]
- Woittiez R. D., Huijing P. A., Rozendal R. H. 1983. Influence of muscle architecture on the length-force diagram of mammalian muscle. Pflugers Arch. Eur. J. Physiol. 399, 275–279. ( 10.1007/BF00652752) [DOI] [PubMed] [Google Scholar]
- Wroe S., Clausen P., McHenry C., Moreno K., Cunningham E. 2007. Computer simulation of feeding behaviour in the thylacine and dingo as a novel test for convergence and niche overlap. Proc. R. Soc. B 274, 2819–2828. ( 10.1098/rspb.2007.0906) [DOI] [PMC free article] [PubMed] [Google Scholar]


