Abstract
Study Design
This study demonstrated the diagnostic potential of sodium MRI for non-invasive quantification of PG in the intervertebral discs.
Objective
To determine the existence of a linear correlation between intervertebral disc [Na] measured from sodium MRI and [PG] measurement from DMMB assay.
Summary of Background Data
Previous studies have shown the possibility of quantifying [Na] in vivo using sodium MRI, however none has shown a direct linear correlation between [Na] measured from sodium MRI and [PG].
Methods
3D sodium MRI images of bovine discs were acquired and converted into [Na] maps. Samples were systematically removed from the discs for DMMB assay. The removal locations were photographically recorded and applied to the [Na] maps to extract the [Na] measurements for comparison. In vivo sodium MRI scans were also carried out on a pair of symptomatic and asymptomatic subjects.
Results
The linear regression fit of [Na] versus [PG] data yielded a significant linear correlation coefficient of 0.71. The in vivo sodium MRI image of the symptomatic subject showed significant [Na] decrease when compared to that of the asymptomatic subject.
Conclusion
Sodium MRI's specificity for PG in the intervertebral discs makes it a promising diagnostic tool for the earlier phase of disc degeneration.
Keywords: Intervertebral disc, proteoglycan, sodium MRI
Introduction
Degenerative disc disease (DDD) of the intervertebral disc (IVD) is the most common cause of back-related disability among North American adults1, costing the United States $100 billions annually in both medical expenditures and work productivity2. The current gold standard in DDD clinical diagnosis is discography, which is an invasive procedure which could yield up to 10% false positive amongst healthy subjects with no history of back problems and back pain3, and approximately 50% of patients continued to experience pain after the removal of their discography identified pain-causing discs4.
Magnetic resonance imaging (MRI) is a non-invasive technique with excellent soft tissue contrast, and has been used extensively for studying structural features of the discs. T2–weighted MR images have been used to grade disc degeneration according to the Pfirrmann grading scale5. Intravenous injection of gadolinium has been shown to enhance T1 relaxation in degenerated disc6. Conventional T1 and T2 imaging techniques are useful for observing morphological changes to the intervertebral disc. However, these MRI findings are results of decreased disc hydration as well as structural changes, typical in the later stages of DDD7. The initial phase of disc degeneration is primarily marked by the breakdown of large proteoglycan (PG) aggrecans, the most common form of PG in the extracellular matrix of the nucleus pulposus (NP), leading eventually to decreases in disc hydration and hydrostatic pressure8,9. The initial phase of disc degeneration presents itself as subtle biochemical changes, which are difficult for conventional MRI to detect.
Instead, other MRI techniques that are more specific to the biochemistry of PG can be utilized to detect PG depletion. In healthy discs, PG molecules aggregate together and form large PG aggrecans with around 100 glycoaminoglycan (GAG) side chains. These side chains are extensively sulfated and carboxylated, which makes the whole molecule highly negatively charged at physiological pH10. This negative charge attracts cations (primarily Na+), therefore a measurement of [Na] directly estimates [PG]. Previous researches on sodium MRI have focused on sodium MRI based [Na] quantification techniques, such as sodium MRI of ex vivo bovine articular cartilage samples11, correlation of [Na] measured from sodium MRI and PG assay on bovine articular cartilage samples12, in vivo measurement of articular cartilage [Na] in a porcine osteoarthritis model13, in vivo sodium MRI of human wrist articular cartilage14, and sodium MRI and subsequent [Na] quantification of intervertebral disc in vivo15. Earlier biochemistry study demonstrated a positively linear correlation between GAG measurements obtained with 1, 9-dimethylmethylene blue (DMMB) assay and [Na] in human intervertebral disc samples10. However, a direct link between disc [Na] measured from sodium MRI and actual [PG] remains to be determined, and this relationship is critical for the validation of sodium MRI as a non-invasive diagnostic tool for the initial stage of DDD. Early diagnosis of DDD could promote development and testing of new therapeutics aimed at modifying the disease progression as well as preventive care.
The objectives of this study were as follows: 1) Determine whether disc [Na] measured by sodium MRI correlates with [PG] determined from the gold-standard DMMB assay, 2) Characterize the distribution of Na and PG in different regions of the discs, and 3) Demonstrate feasibility of quantitative sodium MRI in vivo.
Materials and Methods
Bovine Specimen MRI
Two intact veal lumbar spines were obtained from a local abattoir (Beirig's Brothers, Vineland NJ), within a few hours of slaughter. From each spine specimen, the last two intact caudal discs from the lower lumbar region were surgically harvested. The bones on each side of the disc were trimmed with a bone saw to include the endplate and approximately 1 cm of bony tissue, thus each disc specimen contained a single caudal disc sandwiched between vertebral endplates, preserving the integrity of the motion segment. MRI was performed on a 3T Siemens Trio clinical MRI scanner (Erlangen, Germany) equipped with a broadband amplifier and receiver at the Hospital of the University of Pennsylvania. Tissue samples were placed inside a custom-made low-pass quadrature birdcage RF coil tuned to sodium frequency (32.6 MHz) at 3 T. The RF coil was 17cm in diameter and 12.5cm long, and contained 16 struts. The two receiver ports are inductively coupled to the coil and oriented 90° relative to each other. Five 10% agarose gel phantoms containing 100mM, 150mM, 200mM, 250mM, and 300mM [Na] were imaged alongside each specimen for eventual [Na] calibration.
The vendor's 3D FLASH MRI pulse sequence was used to acquire all sodium images. Imaging parameters were as follows: TE/TR = 6/30 ms, flip angle = 90°, FOV = 15 × 15 cm, matrix size = 128 × 128, slices = 128, slice thickness = 1.2 mm, BW = 60 Hz/Pixel, signal average = 75. These parameters were chosen to obtain a minimum signal-to-noise ratio (SNR) of 15:1 for an isotropic voxel size of 1.2mm3. The isotropic voxel size allowed us to reconstruct images in any orientation from a single 3D data set. Due to the T2* decay during signal acquisition, the resulting image has an apparent voxel dimension in the frequency encoding direction of five times that of the nominal voxel dimension.
Mapping [Na]
The pixel-wise [Na] calculation based on sodium phantom signals was carried out according to the method described by Shapiro, et al 12. The sodium signals from disc and phantoms were corrected separately for T1 and T2* decays according to the following equation:
| 1 |
where FA is the flip angle, and So is the original sodium signal intensity. Sodium T1 and T2* of the disc and phantoms were computed from results of progressive saturation experiments, yielding T1 of 22ms and 23ms for disc and phantom, respectively. The T2* of disc and phantom were computed as 16ms and 8ms, respectively. After compensating for T1 and T2* relaxation, the average sodium signal from each phantom of known [Na] was plotted on a calibration curve of [Na] versus sodium signal. The slope and y-intercept of the linear fit of the calibration curve was then used to compute a 3D [Na] map of the disc.
Mapping FCD
FCD is directly calculated from [Na] measurements by solving the electroneutrality equations of tissue and fluid while assuming ideal Donnan equilibrium condition16, resulting in the following
| 2 |
Subscript t implies tissue, and subscript f implies surrounding fluid. In the context of this study, [Na+]f was assumed to be the serum sodium concentration of 150 mM, and [Na+]t was the previously computed [Na] map. Application of equation 2 pixel-wise to the [Na] map yielded a 3D FCD map of the spine.
PG Assay
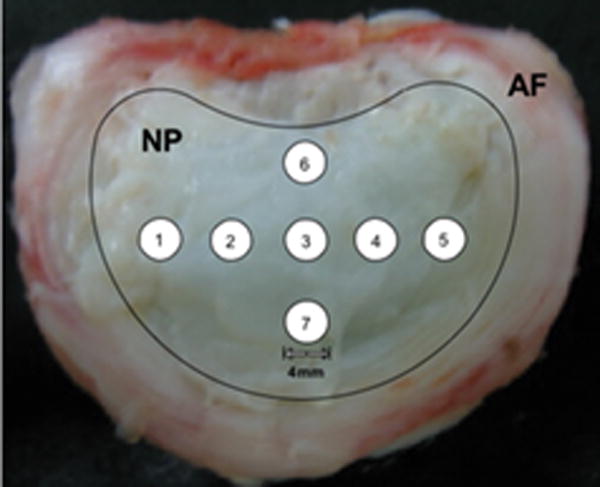
After sodium MRI, the intervertebral discs were isolated via sharp dissection, leaving the AF and NP intact as shown in Figure 1. A series of ordered 4-mm diameter punches were harvested from the NP indicated in the overlay on Figure 1 for DMMB PG assay. After punches were removed, the discs were photographed against a dark background using a digital camera. These photographs were used later to generate image masks for reporting [Na] values from the exact region where the hole punches were located. The wet weight was determined and samples were then digested in 1 mL of 150 μg/mL papain (Sigma Chemicals, St. Louis, MO) for 16-24 hours at 60°C. Solutions were diluted and determination of sulfated–glycosaminoglycan content was performed using DMMB in microplate reader assay. Absorbance at 525 nm was measured using a SpectraMax M5 microplate reader (Molecular Devices, Sunnyvale, CA). In a 96-well plate, 50 μL of each sample was added in duplicates and 200 μL of DMMB solution was added to each well. The plate was read immediately after addition of the DMMB solution. Concentration was calculated from a standard curve of shark chondroitin sulfate C (Sigma Chemicals, St. Louis, MO), which ranged from 0-100 μg/mL.
Figure 1.
Dissected disc, with an overlay of the regions of the nucleus pulposus (NP) and annulus fibrosus (AF) and the numbered locations of the hole punches for the PG assay.
Image Processing and Data Analyses
All sodium MR images and photographs were transferred to a Mac Mini computer (Apple, Cupertino, CA). Subsequent data processing and analysis were carried out using algorithms developed with MATLAB software (Mathworks, Natick, MA). Photographs of each dissected disc were interpolated to the same spatial resolution as the sodium MR images (1.2 mm2). Intensity thresholding of the photographs resulted in binary masks show the region of interest (ROI) where punches were removed. The location of each ROI was used to report average [Na] from the maps. An automatic co-registration routine applied step-wise in-plane rotation and translation while optimizing the linear regression fit of [Na] map ROIs and the PG assay results. The standard deviation of [Na] for each ROI was recorded as the error. Linear regression analysis by least-square-fit was carried out on the 28 pairs of [PG] and [Na] measurements, with the [PG] measurement assigned as the independent variable. The correlation coefficient as well as the y-intercept of the fit was computed.
Mapping [Na] in vivo
All experiments involving human subjects were carried out with approval of the Institutional Review Board at our institution. Two young male subjects were recruited for this study (mean age = 24.5 years). One subject was asymptomatic while the second subject has a history of lower back pain. Subjects were instructed to read and sign the pertinent consent forms prior to scan. The subjects were imaged on the same Siemens Trio 3 T clinical scanner with a custom-built 20 cm diameter surface coil tuned to sodium frequency. Each subject lay supine on top of the coil, and was positioned such that his lower lumbar region was directly above the coil. The same sodium MRI protocol was followed as that of the specimen imaging with the following changes: FOV = 40cm × 40 cm, matrix size = 128 × 64, slices = 32, slice thickness = 12 mm, average = 22, orientation = sagittal, for a total imaging time of under 30 minutes. Image analysis was performed on the desktop computer using the same analysis software as before. The 128 × 64 image matrix was interpolated bilinearly to 128 × 128. Images were corrected for surface coil B1 inhomogeneity. This task was accomplished by acquiring the image of a large sodium agarose phantom using the same surface coil and imaging parameters. Sodium MRI of the subjects were normalized at each pixel location using the phantom image after the two data sets had been manually co-registered. [Na] maps were computed from the corrected sodium MR image by referencing cerebral spinal fluid (CSF) [Na] as 150 mM.
Results
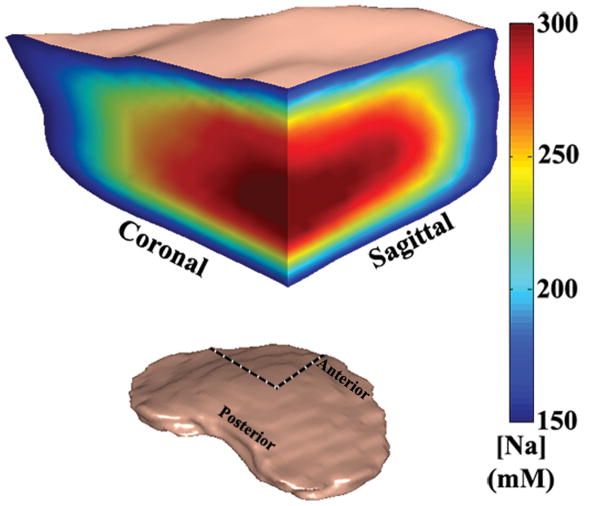
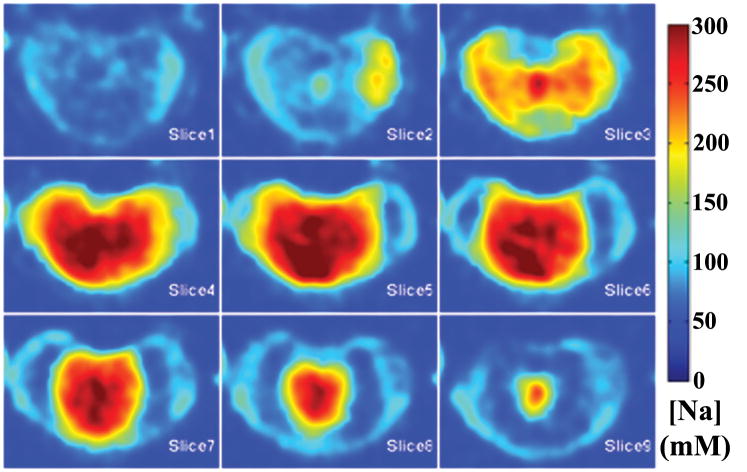
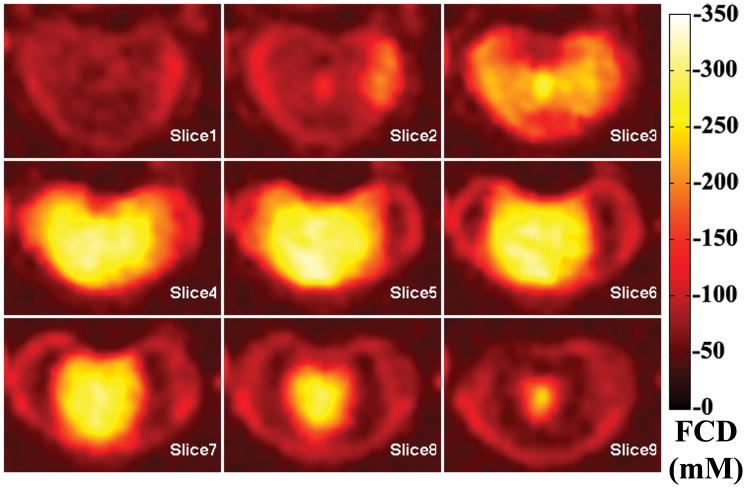
A 3D rendered representation of a typical disc was shown in Figure 2, along with an anterior cutaway section depicting both coronal and sagittal planes of the [Na] color map. The dashed lines showed where the cutaway section was extracted from the whole disc. A series of axial plane [Na] color maps are shown in Figure 3. From the [Na] maps of the coronal, sagittal and axial planes, it was clear that the center of the disc had an average [Na] of approximately 300 mM, while the average [Na] fell to approximately 150 mM near the AF. The axial FCD maps were shown in Figure 4, and it followed the same trend as the [Na] maps, with the center of the NP having the most negative FCD. In the process of FCD calculation according to equation 2, we assumed a serum [Na] of 150 mM. Therefore any tissue with [Na] below 150 mM would yield a positive FCD measurement. As stated previously, the apparent voxel dimension in the frequency encoding direction was five time larger than the nominal dimension, as a result of T2* decay during signal acquisition. This blurring introduced partial voluming effects to the voxels near the edge of the disc, resulting in [Na] measurement of less than 150 mM and corresponding positive FCD values. These voxels were removed from the FCD map using a simple threshold.
Figure 2.
A 3D rendered volumetric representation of a disc, followed by an anterior cutaway section depicting both coronal and sagittal [Na] variation of the disc. The dashed lines shows where the cutaway section was extracted from the whole disc.
Figure 3.
A series of consecutive axial [Na] maps of a disc. Note the variation of [Na] from high values (>300mM) in the NP to <100mM in the AF and was observed in all three planes of all samples.
Figure 4.
A series of consecutive axial FCD maps of the same disc from previous figure. Note higher FCD (more negative) is correlated with higher [Na], as shown in the previous figure.
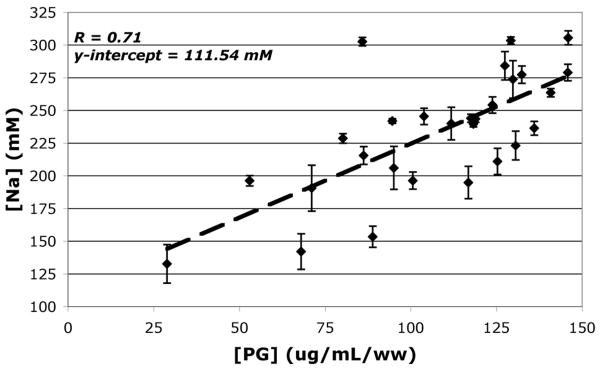
A plot (Figure 5) of [Na] measured by sodium MRI vs. [PG] measured by DMMB assay produced a positive linear trend with a significant correlation coefficient of 0.71. The linear regression analysis was carried out using the [Na] and [PG] measurements of 28 NP punch samples, at a significance level of p<0.05. Given the sample size and corresponding significance level, the computed correlation coefficient demonstrated a strong linear relationship between IVD NP [Na] and [PG] measurements. The linear regression fit's y-intercept of 111.54 mM represents [Na] at a zero PG concentration, which approximated the result obtained by earlier biochemical experiments on human cadaver discs10.
Figure 5.
Plot of [Na] vs. [PG], the standard deviation of each ROI measurement is graphed as the error bar and unit of [PG] is μg/mL/ww, this concentration was normalized against sample wet weight (ww). The dashed line represents the linear regression fit. The linear regression fit yielded a significant correlation (r=0.71 and p<0.05).
The average [PG] and [Na] profiles in the left-to-right (Figure 6A) and anterior-to-posterior (Figure 6B) directions were summarized in Figure 6. The left-to-right and anterior-to-posterior [PG] profiles exhibited the same trend, with the center of the NP having the highest [PG] and tapering off approaching toward the AF. The [Na] profiles in both directions followed closely with the [PG] profiles.
Figure 6.
The averaged disc zonal profile (averaged across all four discs) of the PG assay and the [Na] map computed from sodium MRI in A.) left-to-right direction and B.) anterior-to-posterior direction. The inter-disc standard deviations are graphed as the error.
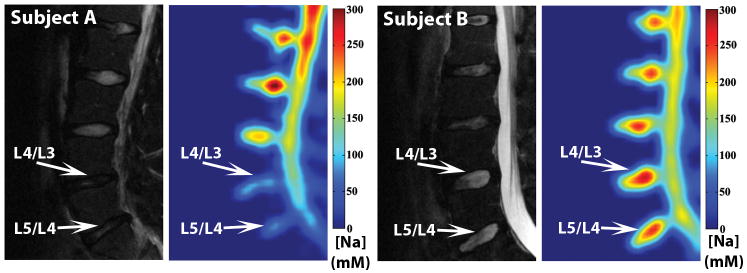
The feasibility of using sodium MRI to quantify [Na] in a clinical setting was shown in Figure 7. A conventional clinical T2 –weighted proton MRI of a symptomatic young subject (subject A) exhibited decreased signal in the L5/L4 and L4/L3 discs. In the corresponding [Na] maps, the same discs showed significantly lower [Na] when compared to the normal-appearing disc within the same subject as well as the discs of the asymptomatic subject (subject B).
Figure 7.
Subject A is a 22-year-old subject with history of lower back trauma. His gray-scale T2–weighted MRI was shown on the left and his colored [Na] map was shown on the right. Subject B is a 26-year-old asymptomatic subject.
Discussion
Variability in disc [Na] values was important in the determination of the relationship between [Na] measured from sodium MRI and [PG] measurement from standard DMMB assay. This was achieved by utilizing the intrinsic inhomogeneity of [Na] distribution within a disc, as demonstrated by the color [Na] maps of Figure 2. By removing punches for PG assay and locating the same punches from the [Na] maps computed from sodium MR images, we demonstrated the feasibility of using sodium MRI to non-invasively assess [PG], as shown by the linear regression fit of [Na] vs. [PG] scatter plot in Figure 5.
The higher [PG] in the center of NP compared to the periphery NP and the AF was well known, but has never been characterized as shown in Figure 6 in an intact disc specimen before. The similar shapes of [PG] and [Na] profiles also suggested that sodium MRI can measure [Na] and hence [PG], making it possible to extend this sodium MRI based [PG] measurement technique to in vivo applications when discs tissues cannot be extracted for PG assay.
In the in vivo experiment, the symptomatic subject (subject A) had two lumbar discs with significantly lower [Na] (Figure 7), which suggests that the PG content of the subject's discs was depleted. While proton T2 MRI reflects disc tissue hydration, sodium MRI is highly specific to PG content of the tissue. A loss of both water and PG suggested a more advanced stage of disc degeneration and could be the cause of lower back pain in this individual. The in vivo sodium MR images were primarily meant to demonstrate the feasibility of conducting sodium MRI in a clinical setting. Due to the limited sample size as well as the lack of clinical confirmation, we did not extract any statistically relevant information from the in vivo images.
The subjects' FCD maps were not shown in the figure since they mostly demonstrated the same information as the [Na] maps. In a simulated experiment, the linear regression fit of FCD versus [Na], calculated over a physiological range of [Na] from 150 mM to 350 mM, yielded a linear correlation coefficient of 0.998. As a result, FCD can be seen as a linearly scaled version of [Na].
Sodium MRI offers specificity in quantifying disc PG content, which is not available in standard proton MRI. Our results suggested that sodium MRI can be used to study disc degeneration and other disc pathologies that are relate to changes in [PG]. However, there are some technical challenges to routine clinical use of sodium MRI. Sodium MRI has an inherently lower signal-to-noise ratio (SNR) compared to proton MRI as a result of three factors: 1) the low gyromagnetic ratio of 23Na nuclei results in a smaller measurable equilibrium magnetization, 2) the short T2 relaxation times produces a rapid signal decay, 3) inherent low biological concentration (∼300 mM) when compared to proton (110M). For these reasons we had to either sacrifice spatial resolution or increase total MRI scan time in order to boost SNR. In the clinical setting, scan times are often limited to <45 minutes, therefore the spatial resolution of sodium MRI has to be lower than that of conventional proton MRI. Moreover, sodium MRI requires the MRI scanner to be equipped with broadband RF transmitter and receiver, which are not standard to all clinical scanners. Recent advances in parallel imaging techniques and the proliferation of high field MRI (>3T) should alleviate some of the issue with low SNR and may allow greater application of sodium MRI techniques for routine diagnostic imaging.
In conclusion, our results demonstrated the feasibility of quantifying disc [Na] and thus [PG] using sodium MRI. We found a strong linear correlation between [Na] measured by sodium MRI and [PG] determined using DMMB assay. In the in vivo section of our experiment, we demonstrated that sodium MRI was able to detect abnormally low disc [Na] in a young symptomatic subject. Although we could not verify the clinical significance of the abnormality, however given the subject's age and history of lower back pain, the low disc [Na] may reflect an underlying disc pathology. To the best of our knowledge, this is the first validation of sodium MRI as a method for assessing disc [PG] non-invasively, and thus we demonstrated that sodium MRI has the potential to be used in a clinical setting for diagnosing the depletion of PG typical of initial stage of disc degeneration.
Key Points.
Earlier phase of intervertebral disc degeneration occurs as proteoglycan concentration decrease
Sodium MRI is capable of quantifying [Na] of the discs in a non-invasive fashion
[Na] measured from sodium MRI is shown to be correlated to [PG] measurement in discs
Sodium MRI has potential to become a diagnostic tool for early phase disc degeneration
Acknowledgments
The following grants funded this project: NIH-NCRR RR02305, AOSpine Research grant, and NIBIB T32 training grant (T32-EB000814).
References
- 1.Errico TJ. Lumbar disc arthroplasty. Clinical Orthopaedics and Related Research. 2005:106–17. doi: 10.1097/01.blo.0000165718.22159.d9. [DOI] [PubMed] [Google Scholar]
- 2.Katz JN. Lumbar disc disorders and low-back pain: socioeconomic factors and consequences. J Bone Joint Surg Am. 2006;88 (Suppl 2):21–4. doi: 10.2106/JBJS.E.01273. [DOI] [PubMed] [Google Scholar]
- 3.Carragee EJ, Tanner CM, Khurana S, et al. The rates of false-positive lumbar discography in select patients without low back symptoms. Spine. 2000;25:1373–80. doi: 10.1097/00007632-200006010-00009. [DOI] [PubMed] [Google Scholar]
- 4.Carragee EJ, Lincoln T, Parmar VS, et al. A gold standard evaluation of the “discogenic pain” diagnosis as determined by provocative discography. Spine. 2006;31:2115–23. doi: 10.1097/01.brs.0000231436.30262.dd. [DOI] [PubMed] [Google Scholar]
- 5.Pfirrmann CW, Metzdorf A, Zanetti M, et al. Magnetic resonance classification of lumbar intervertebral disc degeneration. Spine. 2001;26:1873–8. doi: 10.1097/00007632-200109010-00011. [DOI] [PubMed] [Google Scholar]
- 6.Niinimaki JL, Parviainen O, Ruohonen J, et al. In vivo quantification of delayed gadolinium enhancement in the nucleus pulposus of human intervertebral disc. Journal of Magnetic Resonance Imaging. 2006;24:796–800. doi: 10.1002/jmri.20693. [DOI] [PubMed] [Google Scholar]
- 7.Saifuddin A, Mitchell R, Taylor BA. Extradural inflammation associated with annular tears: demonstration with gadolinium-enhanced lumbar spine MRI. European Spine Journal. 1999;8:34–9. doi: 10.1007/s005860050124. [DOI] [PMC free article] [PubMed] [Google Scholar]
- 8.Antoniou J, Steffen T, Nelson F, et al. The human lumbar intervertebral disc - Evidence for changes in the biosynthesis and denaturation of the extracellular matrix with growth, maturation, ageing, and degeneration. Journal of Clinical Investigation. 1996;98:996–1003. doi: 10.1172/JCI118884. [DOI] [PMC free article] [PubMed] [Google Scholar]
- 9.Urban JPG, McMullin JF. Swelling pressure of the lumbar intervertebral disks - ifnluence of age, spinal level, composition, and degeneration. Spine. 1988;13:179–87. doi: 10.1097/00007632-198802000-00009. [DOI] [PubMed] [Google Scholar]
- 10.Urban JP, Winlove CP. Pathophysiology of the intervertebral disc and the challenges for MRI. J Magn Reson Imaging. 2007;25:419–32. doi: 10.1002/jmri.20874. [DOI] [PubMed] [Google Scholar]
- 11.Shapiro EM, Borthakur A, Dandora R, et al. Sodium visibility and quantitation in intact bovine articular cartilage using high field (23)Na MRI and MRS. J Magn Reson. 2000;142:24–31. doi: 10.1006/jmre.1999.1932. [DOI] [PubMed] [Google Scholar]
- 12.Shapiro EM, Borthakur A, Gougoutas A, et al. 23Na MRI accurately measures fixed charge density in articular cartilage. Magn Reson Med. 2002;47:284–91. doi: 10.1002/mrm.10054. [DOI] [PMC free article] [PubMed] [Google Scholar]
- 13.Wheaton AJ, Borthakur A, Dodge GR, et al. Sodium magnetic resonance imaging of proteoglycan depletion in an in vivo model of osteoarthritis. Acad Radiol. 2004;11:21–8. doi: 10.1016/s1076-6332(03)00574-9. [DOI] [PubMed] [Google Scholar]
- 14.Borthakur A, Shapiro EM, Akella SV, et al. Quantifying sodium in the human wrist in vivo by using MR imaging. Radiology. 2002;224:598–602. doi: 10.1148/radiol.2242011039. [DOI] [PubMed] [Google Scholar]
- 15.Insko EK, Clayton DB, Elliott MA. In vivo sodium MR imaging of the intervertebral disk at 4 T. Acad Radiol. 2002;9:800–4. doi: 10.1016/s1076-6332(03)80350-1. [DOI] [PubMed] [Google Scholar]
- 16.Lesperance LM, Gray ML, Burstein D. Determination of fixed charge density in cartilage using nuclear magnetic resonance. J Orthop Res. 1992;10:1–13. doi: 10.1002/jor.1100100102. [DOI] [PubMed] [Google Scholar]


