

Abstract
The mechanisms and biological implications of coordinated receptor tyrosine kinase coactivation remain poorly appreciated. Epidermal growth factor receptor (EGFR) and c-Met are frequently coexpressed in cancers, including those associated with hepatocyte growth factor (HGF) overexpression, such as malignant astrocytoma. In a previous analysis of the HGF-induced transcriptome, we found that two EGFR agonists, transforming growth factor-α and heparin-binding epidermal growth factor–like growth factor (HB-EGF), are prominently up-regulated by HGF in human glioma cells. We now report that stimulating human glioblastoma cells with recombinant HGF induces biologically relevant EGFR activation. EGFR phosphorylation at Tyr845 and Tyr1068 increased 6 to 24 h after cell stimulation with HGF and temporally coincided with the induction of transforming growth factor-α (~5-fold) and HB-EGF (~23-fold) expression. Tyr845 and Tyr1068 phosphorylation, in response to HGF, was inhibited by cycloheximide and actinomycin D, consistent with a requirement for DNA transcription and RNA translation. Specifically, blocking HB-EGF binding to EGFR with the antagonist CRM197 inhibited HGF-induced EGFR phosphorylation by 60% to 80% and inhibited HGF-induced S-G2-M transition. CRM197 also inhibited HGF-induced anchorage-dependent cell proliferation but had no effect on HGF-mediated cytoprotection. These findings establish that EGFR can be activated with functional consequences by HGF as a result of EGFR ligand expression. This transcription-dependent cross-talk between the HGF receptor c-Met and EGFR expands our understanding of receptor tyrosine kinase signaling networks and may have considerable consequences for oncogenic mechanisms and cancer therapeutics.
Introduction
Receptor tyrosine kinase (RTK) and their ligands control a diverse array of contextually modulated biological processes, such as cell proliferation, migration, death, and differentiation (1). The aberrant activation of RTKs plays an important and, sometimes, central role in the development and/or malignant progression of many malignancies (2). The overactivation of RTKs in cancer can result from multiple mechanisms. These include the aberrant expression of specific receptor ligands by the tumor cells or by nonmalignant tumor-infiltrating cells, the overexpression of receptors through gene amplification or defects in receptor degradation pathways, and ligand-independent constitutive receptor activation as a consequence of either receptor gene deletion or mutation (3-5). These ligand-dependent and ligand-independent receptor effects alter multiple downstream signaling cascades that ultimately drive the malignant phenotype by enhancing tumor cell proliferation, tumor cell survival, invasion/metastasis, and angiogenesis (6). Despite the fact that RTKs are rarely, if ever, expressed or activated in isolation, the mechanisms and biological implications of coordinated RTK coactivation remain poorly appreciated.
Of the many currently characterized RTKs, the ErbB family member epidermal growth factor receptor (EGFR) has a particularly prominent role in the malignancy of numerous systemic and brain cancers (1). For example, malignant astrocytoma commonly expresses wild-type EGFR and EGFR gene amplification occurs at a frequency of ~40% to 50% (7). A constitutively active EGFR variant (EGFRvIII) lacking extracellular amino acids 6 to 273, as the result of the deletion of exons 2 to 7, is expressed in ~40% of glioblastomas (7). The expression of EGFR ligands is relevant to the malignant phenotype of cancers that express wild-type ligand-responsive EGFRs. Among the cognate ligands for EGFR, transforming growth factor-α (TGF-α) and heparin-binding epidermal growth factor–like (HB-EGF) growth factor have been most strongly implicated in oncogenesis (8, 9). Cell biological, in vitro and in vivo transgenic, clinical correlative, and therapeutic evidence point to a role for EGFR and its downstream cell signaling pathways, such as phosphoinositide 3-kinase/Akt and Ras/mitogen-activated protein kinase (MAPK) in the generation and malignant progression in various cancer subsets, including the astroglial malignancies (10). There are currently multiple Food and Drug Administration–approved EGFR kinase inhibitors for cancer therapy (11).
The RTK c-Met and its only known ligand hepatocyte growth factor (HGF)/scatter factor function in development and disease through autocrine and paracrine loops that contextually stimulate cell proliferation, motility and invasion, angiogenesis, and survival (4, 12, 13). Aberrant activation of c-Met is also strongly associated with the initiation and/or malignant progression of multiple malignancies (4, 13). In the context of cancer, c-Met activation results primarily through activating mutations in its kinase domain, c-Met overexpression, or HGF overexpression by cancer cells and/or tumor-infiltrating stromal cells (4). HGF and c-Met overexpression predicts poor prognosis in certain systemic cancers and correlates with malignant grade and angiogenesis in glial neoplasms and with poor survival in medulloblastoma (14). Inhibiting HGF/c-Met signaling using receptor-specific kinase inhibitors, ribozyme-based gene expression inhibition, and neutralizing monoclonal antibodies has potent antitumor effects in vivo and sensitizes experimental glioma xenografts to radiation therapy (15-16). Therapeutic agents that specifically inhibit HGF and c-Met function are currently under development (16, 20, 22).
EGFR and c-Met are frequently coexpressed in cancers including those associated with HGF overexpression, such as lung, head and neck, breast, colon, and the most common primary brain tumors, malignant astrocytoma. Khoury et al. have shown that signaling pathways downstream of c-Met and ErbB2/Neu can cooperate to enhance the malignant phenotype (23). This raises the question of whether coordinated coactivation of EGFR and c-Met occurs, and if so, by what mechanisms. EGFR is commonly transactivated by a diverse array of cell surface receptor families (1). Jo et al. have described an HGF-independent mechanism in which tumor c-Met is transactivated by TGF-α via direct EGFR/c-Met interactions (24). In a previous analysis of the HGF-induced transcriptome, we found that two EGFR agonists, TGF-α and HB-EGF, are prominently up-regulated by HGF in human glioma cells (25). In this current study, we show that this transcriptional response to c-Met activation results in a wave of transcription-dependent EGFR activation, which contributes to HGF-induced glioma cell proliferation.
Results
HGF Induces Expression of EGFR Ligands
Previous gene expression microarray analyses of the glioma cell transcriptional response to HGF identified two EGFR ligands, TGF-α and HB-EGF, among the prominent HGF-inducible gene products (25). This led us to hypothesize that c-Met activation by HGF generates a delayed activation of EGFR, mediated by the induction of EGFR ligands. To test this hypothesis, we first defined the time course and magnitude of TGF-α and HB-EGF gene expression and protein production in response to HGF. Human U373MG and SNB19 glioma cell lines were treated with HGF (20 ng/mL), after which, total cellular RNA, total cellular protein, and conditioned media were isolated for Northern analysis, immunoblot analysis, and enzyme-linked immunoabsorbant assay. In U373MG cells, gene expression was induced with similar kinetics for both TGF-α and HB-EGF (Fig. 1A and B) as evidenced by a clear increase in mRNA by 2 h and peak levels at 6 h after stimulation with HGF. TGF-α mRNA levels increased by a maximum of ~5-fold at 6 h (P < 0.001), and HB-EGF mRNA levels increased to a maximum of ~23-fold at 6 h (P < 0.001). TGF-α and HB-EGF protein levels also increased in response to HGF with a time course consistent with the mRNA response (Fig. 1C and D). TGF-α protein increased in both cell layers and conditioned medium in response to HGF. In contrast, HB-EGF protein increased in the cell layer and on the cell surface (Fig. 1D and E) with no HB-EGF detectable in conditioned medium by either immunoblot or ELISA analyses (not shown). The cell membrane–associated pool of HB-EGF increased ~7-fold in response to HGF and represented ~90% of the total cell-associated HB-EGF at 2 and 6 h after HGF stimulation (Fig. 1D). Flow cytometry of live cells and immunofluorescence of nonpermeabilized cells confirmed that HGF induced cell-associated HB-EGF, which is likely on the cell surface (Fig. 1E-G). The induction of TGF-α and HB-EGF also occurred in SNB19 cells. Gene expression was found to be increased ~2.5-fold for TGF-α and ~60-fold for HB-EGF at 6 h (Fig. 1H). ELISA analyses detected increased TGF-α and HB-EGF protein in cell layers at ~6 to 8 h after cell stimulation with HGF (Fig. 1I and J).
FIGURE 1.
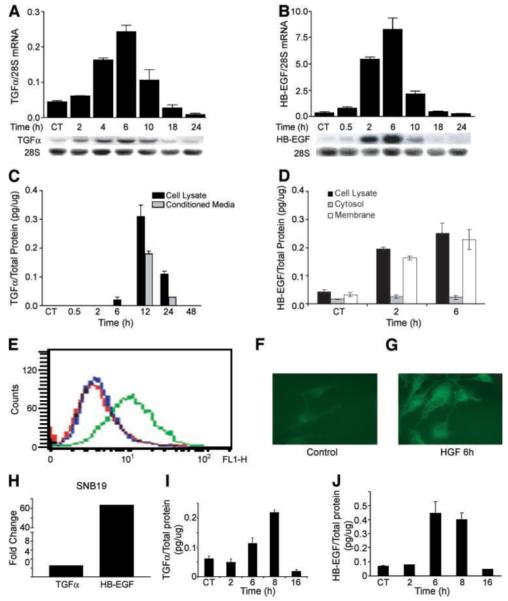
HGF induces TGF-α and HB-EGF mRNA and protein expression in human glioma cells. A and B. U373MG cell monolayers were acclimated to low serum conditions (0.1% FBS) overnight then treated with recombinant human HGF (20 ng/mL) for the indicated times, and then total cellular RNA was isolated. Northern analysis, as described in Materials and Methods, reveals induction of TGF-α (A) and HB-EGF (B) gene expression. Data represents the increase of TGF-α and HB-EGF normalized to 28S rRNA. C and D. U373MG cells were treated ±HGF as in A. At the indicated times, conditioned medium and cell layers, as well as membrane fractions, were isolated and subjected to ELISA for TGF-α (C) or HB-EGF (D) as described in Materials and Methods. TGF-α or HB-EGF concentrations are normalized to total cell layer protein. E-G. Cell surface HB-EGF was determined by flow cytometric analysis of live cells (E) and by immunofluorescence of nonpermeabilized cells (F and G) 6 h after stimulation with HGF. For flow cytometry, cells analyzed with control primary antibody are shown in red and cells analyzed with anti-HB-EGF monoclonal antibody after incubation with buffer only or with HGF are shown in blue and green, respectively. Immunofluorescence in nonpermeablized cells confirms that, when compared with control cells (F), HGF induces cell-associated, likely cell surface, HB-EGF (G; n = 3). Experiments were repeated thrice at a minimum. H-J. SNB19 glioma cells were treated ±HGF as described above. Total cellular RNA was isolated 6 h after cell stimulation with HGF assayed for TGF-α and HB-EGF mRNA (H), and cell layer protein was isolated at the indicated time points and assayed by ELISA for TGF-α (I) and HB-EGF (J) as described above.
HGF Induces EGFR Phosphorylation That Is Dependent upon Both Transcription and Translation
The kinetics of HGF-induced TGF-α and HB-EGF protein production suggested that if EGFR is activated by a mechanism dependent upon the induction of these EGFR ligands, then activation would most likely occur >2 h after cell stimulation with HGF. We examined the kinetics of HGF-induced EGFR phosphorylation at Tyr1068, the site of principal importance for Gab1 and growth factor receptor binding protein 2 docking (26), and at Tyr845, a Src-dependent phosphorylation site in the kinase domain activation loop implicated in EGFR-mediated mitogenesis (27). Low levels of phosphorylation at Tyr845 and Tyr1068 were found in U373MG cells before HGF exposure, and these remained relatively stable up to 2 h after exposure to HGF (20 ng/mL). An equivocal increase in Tyr1068 phosphorylation relative to total EGFR was perceived 2 h after treatment with HGF. EGFR phosphorylation at both Tyr845 and Tyr1068 was increased at 6 h and peaked at 16 h after the addition of HGF (Fig. 2A). In SNB19 cells, total EGFR was increased in response to HGF treatment and phosphorylation at both Tyr845 and Tyr1068 relative to total EGFR was increased 2.1 and 1.7 fold, respectively, at 6 h after HGF treatment (Fig. 2B). This time course of EGFR activation, in response to HGF, strongly implicated a transactivation mechanism involving a cascade of TGF-α and/or HB-EGF expression after c-Met activation by HGF.
FIGURE 2.

HGF induces EGFR activation in a transcription-dependent manner. U373MG cells (A) and SNB19 cells (B) were acclimated to low serum (0.1% FBS) overnight and then treated with HGF (20 ng/mL) for the indicated times. Total cell protein was isolated and subjected to Western analysis for total EGFR, Tyr845 p-EGFR, and Tyr1068 p-EGFR. EGFR phosphorylation is shown to appear between 2 and 6 h after addition of HGF. C-E. U373MG cells were treated as described in A with the exception that either actinomycin D (AcD, 3 μg/mL; B), cycloheximide (CHD, 3 μg/mL; C), or the c-Met inhibitor PHA-665752 (PHA, 100 nmol/L; D) was added 1 h before the addition of HGF. The ratios of phosphorylated EGFR to total EGFR were quantified by computerized densitometry. Both actinomycin D and CHD completely inhibited HGF-mediated phosphorylation of EGFR at Tyr845 and Tyr1068 (P < 0.001). PHA inhibited EGFR phosphorylation by 60% to 80% (P < 0.01). Data shown is representative of the multiple replicate determinations; n = 3.
EGFR can be transactivated by G protein–coupled growth receptor ligands via a posttranslational mechanism involving metalloprotease activation and release of cell surface HB-EGF (e.g., ectodomain shedding; refs. 28, 29). This mechanism of EGFR transactivation rapidly follows G protein–coupled growth factor receptor activation (i.e., within minutes) and is independent of RNA and protein synthesis. To rule out a related mechanism in the delayed EGFR response to HGF, we examined the effects of RNA synthesis and protein synthesis inhibition on HGF-induced EGFR phosphorylation. U373 cells were treated with HGF in the presence of either actinomycin D or cycloheximide at concentrations previously determined to inhibit RNA and protein synthesis by ~75% to 90% (30). Total cell protein was collected 16 h later, the point of maximum HGF-induced EGFR phosphorylation (see Fig. 2A), and analyzed for total and phosphorylated EGFR. Both cycloheximide and actinomycin D potently inhibited HGF-induced EGFR phosphorylation at Tyr845 and Tyr1068 without effecting basal EGFR levels (Fig. 2C and D) or cell viability (not shown). The c-Met tyrosine kinase inhibitor PHA-665752 (19) abrogated HGF-induced EGFR phosphorylation at Tyr845 by ~60% and at Tyr1068 by ~80%, consistent with a signaling cascade requiring c-Met kinase activation by HGF (Fig. 2E).
HGF Induces EGFR-Dependent p44/42 MAPK Activation
Activation of Erk/MAPK represents a major second messenger signaling pathway downstream of both c-Met and EGFR. The time course of MAPK activation (i.e., phosphorylation) after cell stimulation with HGF was examined to determine if HGF-induced EGFR activation generated downstream second messenger events. We detected two peaks of MAPK phosphorylation after stimulating cells with HGF — an early peak consistent with a direct response to c-Met activation and a delayed peak at ~8 h (Fig. 3A). Based on the time course of EGFR activation after HGF stimulation (Fig. 2A), we proposed that the second peak of MAPK phosphorylation resulted from EGFR transactivation by HGF. To test this, we examined the effect of the EGFR inhibitor BIBX1382 on HGF-induced MAPK phosphorylation. BIBX1382 did not inhibit the early wave of MAPK phosphorylation after HGF stimulation (Fig. 3B, 2 h point) and, in contrast, blocked the delayed peak of MAPK phosphorylation (Fig. 3B, 8 h point). Thus, EGFR activation accentuates the HGF-induced MAPK response.
FIGURE 3.

HGF induces EGFR-dependent MAPK activation. A. U373MG cells were acclimated to low serum (0.1% FBS) overnight and then treated with HGF (20 ng/mL) for the indicated times. Total cell protein was isolated and subjected to Western analysis for total MAPK and p44/p42 p-MAPK. MAPK phosphorylation was maximally increased at 2 h and then again at 8 h. B. U373MG cells were treated as described in A with the exception that the EGFR inhibitor BIBX1382 (1.5 μmol/L) was added, beginning 30 min before HGF and every 4 h thereafter. BIBX1382 was shown to specifically inhibit the 8-h peak of MAPK phosphorylation. Data shown is representative of the multiple replicate determinations; n = 3.
Contributions of TGF-α and HB-EGF to HGF-Induced Tyr845 and Tyr1068 EGFR Phosphorylation
We directly asked if TGF-α, HB-EGF, or both were required for HGF-induced EGFR phosphorylation at the Tyr845 and Tyr1068 sites. TGF-α small interfering RNA (siRNA) was used under conditions that achieved near-complete inhibition of HGF-induced TGF-α expression (Fig. 4A). ELISA of total cell protein showed that TGF-α siRNA completely abrogated the increase in TGF-α protein induced by HGF (not shown). HB-EGF function was inhibited using purified CRM197, a nontoxic diphtheria toxin mutant that binds to HB-EGF and specifically inhibits HB-EGF binding to EGFR (31). A number of controls were done to show that CRM197 acts specifically on HB-EGF function. CRM197 at 10 μg/mL inhibited EGFR activation in response to purified HB-EGF by ~95% (Fig. 4B) and had no effect on EGFR activation in response to purified TGF-α (Fig. 4C). CRM197 also had no effect on c-Met activation in response to HGF (Fig. 4D).
FIGURE 4.

Inhibition of TGF-α expression and HB-EGF function. A. U373MG cells were transfected with 10 nmol/L TGF-α siRNA or control siRNA, SiPort lipid only, or left untreated (control) as described in Materials and Methods. After ~48 h, cells were treated with HGF or buffer only (control). Six hours later, total RNA was isolated and subjected to Northern analysis for TGF-α and 28s RNA. Specific hybridization was quantified by phosphoimaging. TGF-α siRNA inhibited HGF-induced TGF-α expression (n = 3, P < 0.001). Representative lanes are shown. B-D. U373MG cells were incubated with the HB-EGF antagonist CRM197 (10 μg/mL) for 1 h before addition of either recombinant HB-EGF (30 ng/mL; B), recombinant TGF-α (30 ng/mL; C), or recombinant HGF (20 ng/mL; D). Ten minutes later, cells were lysed and cellular protein subjected to Western blotting for total and Tyr1068 phosphorylated EGFR (B and C) and for total and phosphorylated c-Met (D). Reaction products were quantified by computer-assisted densitometry. CRM197 inhibited HB-EGF–induced EGFR phosphorylation (phosphorylated/total ratio) by ~95% (n = 4, P < 0.01) and had no effect on EGFR phosphorylation in response to TGF-α or on c-Met phosphorylation by HGF. Representative immunoblots are shown.
We examined the effects of TGF-α siRNA and CRM197 on the induction of EGFR Tyr845 and Tyr1068 phosphorylation in response to HGF in U373MG cells. TGF-α siRNA had a small, statistically insignificant inhibitory effect on HGF-induced Tyr845 phosphorylation (20% inhibition; P > 0.05) and no effect on Tyr1068 phosphorylation. CRM197 inhibited HGF-induced EGFR phosphorylation by ~50% at Tyr845 and ~60% at Tyr1068 (P < 0.01; Fig. 5A and B). The role of HB-EGF on EGFR activation was also shown in SNB19 cells. CRM197 inhibited HGF-induced EGFR phosphorylation by ~90% at Tyr845 and ~85% at Tyr1068 (P < 0.01; Fig. 5C and D). These results show a dominant role for HB-EGF in HGF-induced EGFR phosphorylation. Of the two agonists, HB-EGF was most critical for both Tyr845 and Tyr1068 phosphorylation under our experimental conditions. TGF-α alone had only a modest effect on HGF-induced EGFR Tyr845 phosphorylation and no effect on Tyr1068 phosphorylation.
FIGURE 5.

Effects of TGF-α siRNA and CRM197 on EGFR transactivation by HGF. A and B. U373MG cells were treated with TGF-α siRNA (10 nmol/L) or CRM197 (10 g/mL). Cells were then treated with HGF (20 ng/mL), and 16 h later, total cell protein was isolated and subjected to Western analysis for total EGFR, Tyr845 p-EGFR, and Tyr1068 p-EGFR (n = 3). Immunoreactive bands were quantified by computer-assisted densitometry to determine the ratio of phosphorylated/total EGFR. TGF-α siRNA modestly and statistically insignificantly reduced HGF-induced Tyr845 or Tyr1068 phosphorylation (P > 0.05). CRM197 significantly inhibited Tyr845 or Tyr1068 phosphorylation by ~50% or ~60%, respectively (P < 0.01). C and D. SNB19 cells were treated with CRM197 (10 g/mL) before HGF (20 ng/mL), and total cell protein was isolated and subjected to Western analysis for total EGFR, Tyr845 p-EGFR, and Tyr1068 p-EGFR (n = 3) as described above. CRM197 significantly inhibited HGF-induced Tyr845 or Tyr1068 phosphorylation by ~90% or ~85%, respectively (P < 0.01). Representative immunoblots are shown.
EGFR Activation Contributes to Proliferative but not Cytoprotective Responses to HGF
HGF induces DNA synthesis and cell cycle progression in numerous cell types, including glioma (32). We asked if these biological responses to HGF are mediated by HB-EGF because it was found to be the dominant factor that activates EGFR in our experimental models. Two cell proliferation end points, cell cycle progression as quantified by flow cytometry and anchorage-dependent cell growth, were used in these experiments. Cell monolayers were preestablished in 0.1% serum and then treated with HGF alone, CRM197 alone, or HGF + CRM197. Cells were harvested 24 h later and subjected to flow cytometric cell cycle analysis. In the U373 cell line, HGF alone induced ~33% decrease in the percentage of cells residing in G1-G0, ~200% increase in the percentage of cells in S phase, and ~100% increase in the percentage of cells in G2-M. The HB-EGF inhibitor CRM197 had no effect on the cell cycle distribution of control, unstimulated cells. CRM197 statistically, significantly altered the cell cycle response to HGF. Compared with cells treated with HGF alone, cells treated with HGF + CRM197 displayed an ~20% increase in the percentage of cells in S phase (P < 0.001), ~30% decrease in the percentage of cells in G2-M (P < 0.05), and no change in the percentage of cells residing in G1-G0 (Fig. 6A-C). Similar responses were observed in the SNB19 cell line (Fig. 6E-G). These results show that inhibiting HB-EGF and its effects on EGFR activation partially inhibits the S-G2-M transition in HGF-treated cells. The effects of CRM197 on the 5-day proliferative response to HGF were also determined. Basal cell proliferation was modest under the low serum conditions used in these experiments. HGF induced prominent cell proliferation as previously reported by others and us (32). CRM197 had no effect on basal cell proliferation and inhibited HGF-induced cell growth by ~65% in U373 cells (P < 0.05) and by ~80% in SNB19 cells (P < 0.01; Fig. 6D and H). CRM197 did not induce apoptosis based on the absence of light microscopic evidence of cell toxicity and no detectable sub-G0 flow cytometry peak in cells treated with either CRM197 or CRM197 + HGF (not shown). Taken together, these cell cycle and proliferation results show that HB-EGF partially mediates the glioma cell growth response to HGF.
FIGURE 6.

Inhibition of HGF-induced cell proliferation by TGF-α siRNA and CRM197. A-C. U373MG cells were acclimated overnight in low serum (0.1% FBS), then stimulated with 20 ng/mL HGF ± CRM197 for 24 h before cells were fixed and labeled with propidium iodide. Cell cycle analyses were done via flow cytometry. Antagonizing HB-EGF function with CRM197 had no effect on the percentage of cells residing in G1-G0 (% G1-G0; A). CRM197 enhanced the HGF-induced increase in the percentage of cells in S phase by ~20% (P < 0.001; B) and reduced the percentage of cells in G2-M cells by ~30% (P < 0.05, n = 6; C). D. U373MG cells were plated at 3 × 10⁵ cells per well in 24-well plates and acclimated to low serum–containing medium (0.1% FBS). On day 1, cells were counted in a subset of wells. The remaining wells were treated with low-serum medium only (control), HGF only (20 ng/mL), CRM197 only (10 μg/mL), or HGF + CRM197. CRM197 was added to the appropriate wells every other day. On day 5, cells in all remaining wells were trypsinized and counted and expressed as percentage of control on day 1. Blocking HB-EGF with CRM197 inhibited HGF-induced cell growth by ~65% (P < 0.05). E-G. SNB19 cells were stimulated with 20 ng/mL HGF ± CRM197 and subjected to cell cycle analysis as described above. CRM197 had no effect on the percentage of cells residing in G1-G0 (E) but enhanced the HGF-induced increase in the percentage of cells in S phase by ~45% (P < 0.01; F), as well as reduced the percentage of cells in G2-M cells by ~30% (P < 0.05, n = 6; G). H. SNB19 cells were acclimated to low serum–containing medium (0.1% FBS) and treated as in D. On days 1 and 5, cells were trypsinized, counted, and expressed as percentage of control on day 1. CRM197 inhibited HGF-induced cell growth by ~80% (P < 0.01). n = 6.
HGF is a multifunctional cytokine with cytoprotective actions in addition to its mitogenic properties examined above. We have previously shown that HGF protects against glioma cell death induced by DNA-damaging agents (33). Using our previously reported methodology, we asked if HB-EGF was required for HGF-mediated U373MG protection against cisplatin (CDDP)-induced cell death (Fig. 7). CDDP (100 μmol/L, 18 h exposure) induced ~45% death in control U373MG cells as measured by 3-(4,5-dimethylthiazol-2-yl)-2,5-diphenyltetrazolium bromide assay (P < 0.001). Pretreating cells with HGF (100 ng/mL) for 48 h before CDDP exposure reduced cell toxicity to 20% (~50% reduction in cell death; P < 0.001). CRM197 slightly enhanced CDDP-induced cell toxicity in control and HGF-pretreated cells but had no effect on the magnitude of HGF-mediated cytoprotection. In contrast to the cell proliferative response, EGFR transactivation by HB-EGF is not required for HGF-induced glioma cytoprotection.
FIGURE 7.
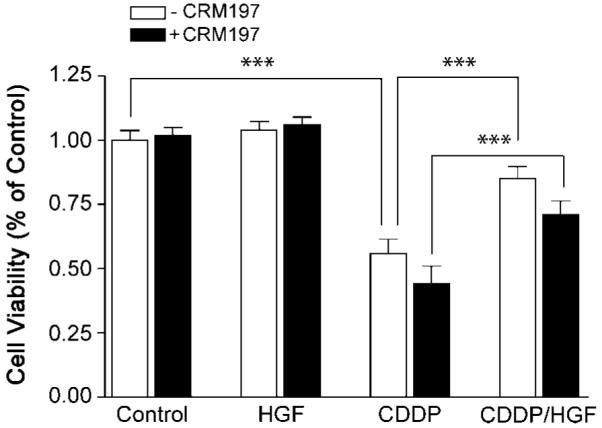
HB-EGF does not mediate HGF-induced cytoprotection against DNA damage. U373MG cells were treated ±CRM197 as described in Fig. 5D and Materials and Methods. At beginning of 1 h after the first addition of CRM197, cells were then treated with HGF (100 ng/mL) or PBS as control for 48 h, followed by an additional 48 h + cisplatin (CDDP, 100 μmol/L). Cell survival was then determined by 3-(4,5-dimethylthiazol-2-yl)-2,5-diphenyltetrazolium bromide assay as described in Materials and Methods. Consistent with our previous report, HGF partially protected control cells from CDDP-induced cytotoxicity (P < 0.01, n = 10). CRM197 did not alter the magnitude of HGF-induced cytoprotection. There was a statistically insignificant trend toward increased CDDP cytotoxicity in CRM197-treated cells.
Discussion
RTK cross-talk or transactivation refers to a mechanism by which a ligand indirectly activates an RTK for which it does not serve as a direct agonist. Multiple RTKs, such as platelet-derived growth factor receptor, EGFR, and c-Met, are potential targets of receptor transactivation by diverse ligand/receptor families (24, 29, 34). G protein-coupled receptors for ligands, such as thombin, angiotensin, lysophosphoatidic acid, and endothelin, probably represent the best example of a receptor family that participates in EGFR family transactivation (29, 35). Janus tyrosine kinase pathway agonists, such as leptin, growth hormone, and prolactin, and the frizzled receptor agonist Wnt have also been found to activate EGFR-dependent cell signaling (36-38). Exclusively cytoplasmic mechanisms of transactivation include the direct phosphorylation of EGFR tyrosines by Jak2 or by non-RTKs, such as Src (39, 40). Direct transphosphorylation of kinase domain tyrosines can also result from RTK heterodimerization (e.g., platelet-derived growth factor receptor/EGFR, c-Met/EGFR; refs. 24, 41). Non-EGFR ligands can also stimulate matrix metalloproteinases and heparinases that activate HB-EGF sequestered at the cell surface that in turn binds EGFR extracellular ligand binding domains via classic ligand-receptor interactions (28, 29). In vitro analyses show that these posttranslational mechanisms of receptor transactivation characteristically occur relatively quickly, within minutes, after activating the initiating receptor. Transactivation by these mechanisms may involve the formation of a caveolin-dependent “signalplex” where participating receptors, nonreceptor kinases, docking proteins, scaffolding proteins, and proteolytic enzymes colocalize (42).
In this report, we describe for the first time transcription-dependent EGFR transactivated by HGF, the ligand for the c-Met RTK. We further show that EGFR transactivation by HGF occurs via a novel mechanism distinct from the posttranslational mechanisms of EGFR transactivation discussed above. We show that EGFR transactivation by HGF is both transcription-dependent and translation-dependent and associated with the induction of two EGFR ligands — TGF-α and HB-EGF. Of these two ligands, HB-EGF was most strongly induced by HGF and seemed to have the dominant role in EGFR transactivation under our in vitro experimental conditions. We found that the HB-EGF antagonist CRM197 potently inhibited HGF-induced EGFR phosphorylation, whereas inhibiting TGF-α gene expression induction with siRNA had only a modest effect. Consistent with the requirement for gene expression and protein synthesis, HGF-induced EGFR activation is shown to occur on a time frame (i.e., hours) that is substantially slower and more prolonged than the posttranslational receptor transactivation that takes place within seconds to minutes of ligand-dependent activation of the initiating receptor (28, 43). EGFR transactivation by c-Met is not likely to require the colocalization of c-Met and EGFR (42), because the EGFR ligands secreted and/or sequestered at the cell surface in response to HGF have the potential to function at some distance from the c-Met receptor. Our finding that HGF induces TGF-α secretion and HB-EGF accumulation almost exclusively at the cell surface suggests that the former would be capable of both autocrine and paracrine EGFR activation whereas the latter is limited to autocrine effects.
It is of particular interest that HGF was found to stimulate EGFR phosphorylation at both Tyr845 and Tyr1068. Tyr1068 is a classic RTK autophosphorylation site and potentiates docking of growth factor receptor binding protein 2 and Gab1 to EGFR and subsequent activation of MAPK/extracellular signal-regulated kinase and phosphoinositide 3-kinase/Akt signaling cascades, respectively (26). EGFR Tyr845 resides within the kinase domain activation loop, and its phosphorylation, while dependent upon EGFR stimulation, is mediated by Src kinase via a mechanism potentially independent of MAPK (27). Src activation can occur downstream of either c-Met and EGFR, and it is possible that one or both of these potential paths to Src activation contribute to HGF-induced EGFR Tyr845 phosphorylation. Parsons and colleagues have shown that Tyr845 phosphorylation is required for EGFR-induced DNA synthesis (44). HGF induces cell cycle progression, proliferation, and DNA synthesis in glioma cells arrested by contact inhibition and serum deprivation (32). We report here that inhibiting HGF-induced EGFR transactivation partially blocks HGF-induced cell cycle progression at the S-G2-M transition. Based on these effects from antagonizing HB-EGF, it seems that EGFR transactivation acts relatively specifically at the S-G2-M transition, because CRM197 had no effect on G1-S transition that is potently stimulated by HGF. We show that this cell cycle response is biologically relevant because inhibiting EGFR transactivation partially inhibited HGF-induced cell proliferation. In contrast to cell proliferation, inhibiting EGFR transactivation with either CRM197 had no effect on the cytoprotective actions of HGF. Thus, EGFR transactivation differentially contributes to HGF-induced cell growth and survival responses.
Our results are also interesting with regard to the apparent stability of EGFR phosphorylation after c-Met activation by HGF. Phosphorylated EGFR was easily detected between 6 and 24 h after cell stimulation with HGF, unlike the relatively rapid EGFR turnover that follows acute receptor activation by exogenously applied EGFR agonists. There are multiple potential explanations for this. The unique kinetics of autocrine receptor transactivation induced by HGF might inefficiently induce receptor down-regulation. The glioma cells used in this study might be defective in adaptor proteins, such as Cbl that mediate EGFR turnover (45). Alternatively, c-Met activation might alter the expression/function of adaptor proteins that actively stabilize EGFR (e.g., Alix; ref. 46). Experiments examining these and other possibilities are currently under way.
c-Met, EGFR, and their prospective ligands are overexpressed in multiple malignancies. Each receptor/ligand system is currently recognized as a potential target for anticancer therapy. EGFR inhibitors have recently been found to be clinically active in subsets of non–small cell lung cancer and glioblastoma multiforme that contain activating EGFR mutations and deletions, respectively (10, 47, 48). Efficacy in tumors overexpressing wild-type EGFR has not been firmly established. HGF/c-Met pathway inhibitors are effective in preclinical animal cancer models, and clinical trials are just being initiated to test the safety and efficacy of pathway targeting in cancer patients (16, 19, 22). Whereas c-Met and EGFR share multiple cell signaling mechanisms and activate common downstream second messenger cascades (e.g., Ras/MAPK, phosphoinositide 3-kinase/AKT, Stat) and biological responses (mitogenesis, motogenesis, cytoprotection), ample differences exist to support cooperative contributions to oncogenesis (4). The previous report from Jo et al. describing posttranslational EGFR→Met receptor transactivation in hepatocytes and our current results showing transcription-dependent c-Met→EGFR transactivation in glioma cells establish that EGFR and c-Met can be coordinately coactivated through multiple mechanisms (24). Engelman et al. have recently found that c-Met amplification promotes lung cancer resistance to EGFR inhibitors via a mechanism involving ERBB3/phosphoinositide 3-kinase pathway activation (22). Coordinated receptor coactivation via multiple mechanisms may have considerable consequences on developmental biology and disease mechanisms. It also has implications in our understanding of RTK signaling networks and the design of therapeutic RTK-targeting strategies in diseases including cancer.
Materials and Methods
Cell Culture and Reagents
U373MG cells were originally purchased from American Type Culture Collection and grown in DMEM (Mediatech, Inc.) supplemented with 10% fetal bovine serum (FBS; Gemini Bioproducts, Inc.), 20 mmol/L HEPES (Mediatech, Inc.), and penicillin-streptomycin (Mediatech, Inc.). SNB19 cells were a gift of J. Rao, University of Illinois College of Medicine at Peoria, and were grown in DMEM-F12 (Life Technologies-Bethesda Research Laboratories, Inc.) supplemented with 10% FBS, 20 mmol/L HEPES, and penicillin-streptomycin. All cells were grown at 37°C in a humidified incubator with 5% CO2. Recombinant human HGF was provided as a gift from Genentech, Inc. EGFR inhibitor II BIBX1382 was purchased from Calbiochem-EMD. PHA-665752 was kindly provided by James Christensen (Pfizer Pharmaceutical).
Antibodies
Antibodies were obtained from the following sources and used at the indicated dilutions: Cell Signaling Technology p-MAPK (1:1,000), p-Met (1:1,000), p-EGFR Tyr845 (1:1,500), p-EGFR Tyr1068 (1:750), and EGFR (1:1,000); Santa Cruz Biotechnology actin (C-11; 1:1,000), c-Met (C-12, 1:1,000); and BD Biosciences MAPK (1:3,000). Secondary antibodies conjugated to horseradish peroxidase and FITC were purchased from Jackson Immunoresearch Laboratories.
Cell Cycle Analysis
Cells growing as a monolayer on 100-mm-diameter tissue culture dishes (Corning) were trypsinized, pelleted by centrifugation, washed with PBS, resuspended in 1 mL of ice-cold PBS, and fixed by the addition of 4 mL of ice-cold ethanol under gentle vortexing. Fixed cells were stored up to 1 week in 80% ethanol at −20°C until ready for labeling. For analysis, fixed cells were collected by centrifugation, washed with PBS, resuspended in 1 mL of PBS, and treated with 20 μg of DNase-free RNase (Roche Diagnostics) for 30 min at 37°C. Cells were labeled with propidium iodide (Sigma) at a final concentration of 100 μg/mL for 10 min at room temperature. Analyses were done on a FACSCalibur flow cytometer (Becton Dickinson). Raw data were gated to exclude doublets and cellular debris. The resultant cell cycle histograms were analyzed with CellQuest software (Becton Dickinson), and the area under the curve was integrated for each peak.
Immunoflow Cytometry and Immunofluorescence
U373 cells were cultured in 10-cm-diameter dishes and harvested by trypsin digestion. After blocking with 0.5% bovine serum albumin/PBS for 10 min, cells were incubated with primary goat anti–HB-EGF (1:20; R&D Systems) for 1 h. Cells were washed with 0.5% bovine serum albumin/PBS blocking buffer. Donkey anti-goat FITC-conjugated secondary antibody (Jackson Immunoresearch Laboratories) was diluted in blocking buffer and incubated with cells for 30 min. Normal goat serum was used as negative control. All the procedures were done at room temperature. After washing thrice with PBS, cells were subjected to flow cytometric analysis using a Becton Dickinson FACSCalibur. The data were processed using CellQuest software.
For immunofluorescence, U373 cells were cultured on glass coverslips. All the staining procedures were done at room temperature. Cells were fixed with 4% formaldehyde for 15 min, rinsed, and then incubated with blocking buffer consisting of 0.5% bovine serum albumin/PBS for 10 min. The primary goat anti–HB-EGF (1:80) was incubated with cells for 1 h, followed by washing with 0.5% bovine serum albumin/PBS. FITC donkey anti-goat IgG secondary antibody (1:100) was incubated with cells for 30 min. After washing, the coverslips were mounted with mounting medium (Vectorshield). Photomicrographs were taken using Axiovision software under identical exposure variables for all conditions.
Northern Analysis
Total RNA was harvested from the cells using Qiagen RNeasy kits according to manufacturer’s recommendations. Ten micrograms of RNA per sample were denatured with deionized glyoxal, combined with RNA loading buffer, and run in either duplicate or triplicate on a 1.0% agarose gel containing ethidium bromide for 2.5 h at 60 V. RNA was transferred to a nylon membrane (Nytran; Schleicher & Schuell Bioscience) overnight in 10 × SSC (1.5 mol/L NaCl plus 0.15 mol/L sodium citrate). The cDNA probe for TGF-α was synthesized using oligonucleotide primers designed from accession NM_003236 to amplify a 748-bp region corresponding to mRNA bases 59 to 807. The cDNA probe for HB-EGF was synthesized using oligonucleotide primers designed from accession NM_001945 to amplify a 691-bp region corresponding to mRNA bases 1358 to 2049. Reverse transcription–PCR was conducted using U373MG RNA as a template, and PCR products were subcloned in TOPO PCR cloning vectors (Invitrogen, Inc.) and sequenced before use. Northern blot probes were generated for TGF-α, HB-EGF, and 28S rRNA with [32P]dCTP (Amersham-Pharmacia) using a random priming labeling kit (Roche Diagnostics) according to manufacturer’s specifications. Membranes were prehybridized for 4 h at 42°C and then hybridized overnight at 42°C in a rotating oven. Membranes were washed thrice in 1× SSC 0.1% SDS at 50°C. Radioactivity was quantified by phosphoimaging using the Bio-Imaging analyzer BAS 2500 (Fuji Medical Systems). All blots were stripped and then rehybridized with cDNA probe specific for 28S rRNA. Results are expressed relative to 28S rRNA. Each figure derived from these methods represents data from a single blot and single exposure condition. Representative lanes (shown below quantitative data) that most closely approximate the mean quantitative values were selected and repositioned from the original single blots to eliminate replicate lanes.
Immunoblotting
SDS-PAGE and immunoblotting were done by the method of Towbin et al. (49) with some modifications. Cells growing in a monolayer on 100-mm-diameter tissue culture dishes were washed thrice with ice-cold PBS and placed on ice. Cultures used to examine phosphorylated proteins received arsine oxide (20 μmol/L) 30 min before rinsing in PBS. Eight hundred microliters of ice-cold PBS were added to each plate, and cells were scraped and collected. After 5-min 4°C centrifugation at 3,000 × g, cells were placed on ice and lysed in 60 μL of radioimmunoprecipitation assay buffer (1% Igepal, 0.5% sodium deoxycholate, and 0.1% SDS in PBS) containing fresh 1× protease and 1× phosphatase inhibitors (Calbiochem). Cells were kept on ice for 20 min, sonicated to shear DNA, and centrifuged at 10,000 × g at 4°C for 10 min. Supernatant protein concentrations were determined for each sample by Coomassie protein assay (Pierce; ref. 50). Aliquots of 25 μg of total protein were combined with Laemmli loading buffer containing β-mercaptoethanol and heated at 100°C for 5 min. The proteins were loaded in either duplicate or triplicate and separated on SDS-PAGE gels (Cambrex) at 130 V for 105 min. Proteins were electrophoretically transferred to nitrocellulose with a semidry transfer apparatus at 50 mA per gel stack for 60 min. Membranes were incubated for 1 h in TBS containing 0.1% Tween 20 with 5% nonfat dried milk at room temperature. Incubation with primary antibody was done overnight at 4°C in 5% bovine serum albumin in TBS containing 0.1% Tween 20 at the concentrations indicated above for all proteins except p-EGFR. Membranes were incubated with anti–p-EGFR for 36 h to enhance signal. Membranes were then washed thrice with TBS containing 0.1% Tween 20, incubated with secondary antibody for 1 h in TBS containing 0.1% Tween 20-milk, washed 3× with TBS containing 0.1% Tween 20, and developed with an enhanced chemiluminescence detection kit (GE Healthcare) as per the manufacturer’s instructions. Blots were then stripped and reprobed for either actin or total EGFR for normalization as previously described (51). Bands were quantified by computer-assisted densitometry as previously described (52). Each figure derived from these methods represents data from a single blot and single exposure condition. Representative lanes (shown below quantitative data) that most closely approximate the mean quantitative values were selected and repositioned from the original single blots to eliminate replicate lanes.
ELISA
U373MG cells and SNB19 cells were acclimated to low serum (0.1% FBS) overnight, HGF was added at a concentration of 20 ng/mL, and cells and medium were collected at indicated time points. Conditioned medium was subjected to centrifugation at 1,000 × g for 5 min to remove floating cells. Medium was transferred to fresh tubes containing protease inhibitors and kept on ice. Medium used for the ELISA was concentrated at 4°C using centriplus YM-3 centrifugal filter devices (Millipore) overnight at 2,000 × g. Filter devices were rinsed with 200 μL of fresh unsupplemented medium to collect the concentrate. Whole-cell extracts were obtained as described above using immunoprecipitation lysis buffer (10 mmol/L sodium phosphate, 100 mmol/L NaCl, 1% Triton X-100) containing 1× phosphatase inhibitors and 1× protease inhibitor mixture (Calbiochem). For TGF-α, 50 μL of both cell lysate and concentrated medium were added to a TGF-α ELISA plate (R&D Systems), and the assay was completed as per the manufacturer’s instructions. For detection of HB-EGF in whole-cell lysate, cell membrane, and cytosol fractions, cells were lysed in 1 mL of homogenization buffer [10 mmol/L Tris-HCl (pH 7.4), 1 mmol/L EDTA, 200 mmol/L sucrose, containing 1× phosphatase inhibitors and 1× protease inhibitor mixture]. Cell nuclei and debris were removed by centrifugation at 900 × g for 10 min at 4°C, and the resulting supernatant was centrifuged at 110,000 × g for 30 min at 4°C. The supernatant was collected as cytosol, and the pellet (membrane fraction) was suspended in immunoprecipitation lysis buffer for a minimum of 1 h at 4°C. Aliquots were subjected to ELISA for HB-EGF quantification (R&D Systems) using the manufacturer’s instructions. The working concentrations of capture antibody and detection antibody were 0.4 μg/mL and 100 ng/mL, respectively. Total protein was quantified by the Coomassie protein assay (50).
Cell Proliferation Assay
U373MG cells and SNB19 cells were plated into 12-well tissue culture plates (30,000 cells per well) in medium supplemented with 10% FBS. On postplating day 2, medium was removed and replaced with medium supplemented with 0.1% FBS. CRM197 (Calbiochem) was added at 10 μg/mL on postplating day 3, followed 0.5 h later by HGF at a concentration of 20 ng/mL. Six wells for each experimental condition were trypsinized and harvested on postplating days 3 and 7. The cell number was determined by manual counting with a hemacytometer, and the mean number of cells per well and SE were generated at each time point.
TGF-α siRNA
Predesigned siRNA’s for TGF-α were obtained from Ambion, Inc. Three siRNA’s (ID 12747, ID 12927, and ID 12838; NM_003236) were screened for optimal efficiency by Northern blotting as described above. SiRNA ID 12747 was ultimately used for experimental studies. U373 cells were plated in 100-mm-diameter tissue culture dishes at 5 × 10⁵ cells per plate in medium supplemented with 10% FBS. On the following day, medium was removed and replaced with medium supplemented with 0.1% FBS. siRNA were prepared using siPort Lipid (Ambion, Inc.) as instructed by manufacturer to obtain a final working concentration of 10 nmol/L. Approximately 1 h after replacing medium, siRNA complexes were added to cells and allowed to incubate for 48 h.
3-(4,5-Dimethylthiazol-2-yl)-2,5-Diphenyltetrazolium Bromide Cytotoxicity Assay
3-(4,5-Dimethylthiazol-2-yl)-2,5-diphenyltetrazolium bromide assays were done and analyzed according to our previously described methods (33, 53). U373MG cells were plated at 5 × 10³ cells per well in groups of 10 in 96-well culture plates in standard medium or in medium containing CRM197 alone, recombinant HGF alone (100 ng/mL), or both as indicated. After 48 h, cells were exposed to cisplatin (100 μmol/L) as indicated. After an additional 48 h, 3-(4,5-dimethylthiazol-2-yl)-2,5-diphenyltetrazolium bromide (1 mg/mL; Sigma) was added to each well and incubated for 2 h at 37°C. Medium was then removed, and 100 μL of DMSO were added to each well. Absorbance at 570 nm was measured by a microtiter plate reader (Dynatech). Mean cell survival was calculated by absorbance units of samples from treated cells / mean absorbance units of samples from control cells.
Stastical Analysis
Statistical analysis was done using GraphPad Prism version 3.03. Evaluation of significance was determined using ANOVA with Bonferonni posttest for multiple simultaneous comparisons. All data represent mean ± SE. P values of <0.05 were considered statistically significant; * is P < 0.05, ** is P < 0.01, and *** is P < 0.001.
Acknowledgments
We thank Angela Williams for secretarial assistance.
Grant support: NIH grants NS32148 (J. Laterra), NS43987 (J. Laterra), and ES09169 (E.M. Rosen).
References
- 1.Normanno N, De Luca A, Bianco C, et al. Epidermal growth factor receptor (EGFR) signaling in cancer. Gene. 2006;366:2–16. doi: 10.1016/j.gene.2005.10.018. [DOI] [PubMed] [Google Scholar]
- 2.Krause DS, Van Etten RA. Tyrosine kinases as targets for cancer therapy. N Engl J Med. 2005;353:172–87. doi: 10.1056/NEJMra044389. [DOI] [PubMed] [Google Scholar]
- 3.Wislez M, Rabbe N, Marchal J, et al. Hepatocyte growth factor production by neutrophils infiltrating bronchioloalveolar subtype pulmonary adenocarcinoma: role in tumor progression and death. Cancer Res. 2003;63:1405–12. [PubMed] [Google Scholar]
- 4.Birchmeier C, Birchmeier W, Gherardi E, Vande Woude GF. Met, metastasis, motility and more. Nat Rev Mol Cell Biol. 2003;4:915–25. doi: 10.1038/nrm1261. [DOI] [PubMed] [Google Scholar]
- 5.Mischel PS, Cloughesy TF. Targeted molecular therapy of GBM. Brain Pathol. 2003;13:52–61. doi: 10.1111/j.1750-3639.2003.tb00006.x. [DOI] [PMC free article] [PubMed] [Google Scholar]
- 6.Barbieri MA, Ramkumar TP, Fernadez-Pol S, Chen PI, Stahl PD. Receptor tyrosine kinase signaling and trafficking-paradigms revisited. Curr Top Microbiol Immunol. 2004;286:1–20. [PubMed] [Google Scholar]
- 7.Heimberger AB, Suki D, Yang D, Shi W, Aldape K. The natural history of EGFR and EGFRvIII in glioblastoma patients. J Transl Med. 2005;3:38. doi: 10.1186/1479-5876-3-38. [DOI] [PMC free article] [PubMed] [Google Scholar]
- 8.Miyamoto S, Yagi H, Yotsumoto F, Kawarabayashi T, Mekada E. Heparin-binding epidermal growth factor-like growth factor as a novel targeting molecule for cancer therapy. Cancer Sci. 2006;97:341–7. doi: 10.1111/j.1349-7006.2006.00188.x. [DOI] [PMC free article] [PubMed] [Google Scholar]
- 9.Tang P, Jasser SA, Sung JC, Shi Y, Steck PA, Yung WK. Transforming growth factor-α antisense vectors can inhibit glioma cell growth. J Neurooncol. 1999;43:127–35. doi: 10.1023/a:1006272019933. [DOI] [PubMed] [Google Scholar]
- 10.Mellinghoff IK, Wang MY, Vivanco I, et al. Molecular determinants of the response of glioblastomas to EGFR kinase inhibitors. N Engl J Med. 2005;353:2012–24. doi: 10.1056/NEJMoa051918. [DOI] [PubMed] [Google Scholar]
- 11.Ciardiello F. Epidermal growth factor receptor inhibitors in cancer treatment. Future Oncol. 2005;1:221–34. doi: 10.1517/14796694.1.2.221. [DOI] [PubMed] [Google Scholar]
- 12.Matsumoto K, Nakamura T. Hepatocyte growth factor (HGF) as a tissue organizer for organogenesis and regeneration. Biochem Biophys Res Commun. 1997;239:639–44. doi: 10.1006/bbrc.1997.7517. [DOI] [PubMed] [Google Scholar]
- 13.Corso S, Comoglio PM, Giordano S. Cancer therapy: can the challenge be MET? Trends Mol Med. 2005;11:284–92. doi: 10.1016/j.molmed.2005.04.005. [DOI] [PubMed] [Google Scholar]
- 14.Abounader R, Laterra J. Scatter factor/hepatocyte growth factor in brain tumor growth and angiogenesis. Neuro-oncol. 2005;7:436–51. doi: 10.1215/S1152851705000050. [DOI] [PMC free article] [PubMed] [Google Scholar]
- 15.Lal B, Xia S, Abounader R, Laterra J. Targeting the c-Met pathway potentiates glioblastoma responses to γ-radiation. Clin Cancer Res. 2005;11:4479–86. doi: 10.1158/1078-0432.CCR-05-0166. [DOI] [PubMed] [Google Scholar]
- 16.Kim KJ, Wang L, Su YC, et al. Systemic anti-hepatocyte growth factor monoclonal antibody therapy induces the regression of intracranial glioma xenografts. Clin Cancer Res. 2006;12:1292–8. doi: 10.1158/1078-0432.CCR-05-1793. [DOI] [PubMed] [Google Scholar]
- 17.Cao B, Su Y, Oskarsson M, et al. Neutralizing monoclonal antibodies to hepatocyte growth factor/scatter factor (HGF/SF) display antitumor activity in animal models. Proc Natl Acad Sci U S A. 2001;98:7443–8. doi: 10.1073/pnas.131200498. [DOI] [PMC free article] [PubMed] [Google Scholar]
- 18.Abounader R, Lal B, Luddy C, et al. In vivo targeting of SF/HGF and c-met expression via U1snRNA/ribozymes inhibits glioma growth and angiogenesis and promotes apoptosis. FASEB J. 2001 November 29; doi: 10.1096/fj.01-0421fje. 101096/fj01 – 0421fje ( http://wwwfasebjorg/cgi/doi/101096/fj01-0421fje) 2001. [DOI] [PubMed] [Google Scholar]
- 19.Christensen JG, Schreck R, Burrows J, et al. A selective small molecule inhibitor of c-Met kinase inhibits c-Met-dependent phenotypes in vitro and exhibits cytoreductive antitumor activity in vivo. Cancer Res. 2003;63:7345–55. [PubMed] [Google Scholar]
- 20.Burgess T, Coxon A, Meyer S, et al. Fully human monoclonal antibodies to hepatocyte growth factor with therapeutic potential against hepatocyte growth factor/c-Met-dependent human tumors. Cancer Res. 2006;66:1721–9. doi: 10.1158/0008-5472.CAN-05-3329. [DOI] [PubMed] [Google Scholar]
- 21.Martens T, Schmidt NO, Eckerich C, et al. A novel one-armed anti-c-Met antibody inhibits glioblastoma growth in vivo. Clin Cancer Res. 2006;12:6144–52. doi: 10.1158/1078-0432.CCR-05-1418. [DOI] [PubMed] [Google Scholar]
- 22.Engelman JA, Zejnullahu K, Mitsudomi T, et al. MET amplification leads to gefitinib resistance in lung cancer by activating ERBB3 signaling. Science. 2007;316:1039–43. doi: 10.1126/science.1141478. [DOI] [PubMed] [Google Scholar]
- 23.Khoury H, Naujokas MA, Zuo D, et al. HGF converts ErbB2/Neu epithelial morphogenesis to cell invasion. Mol Biol Cell. 2005;16:550–61. doi: 10.1091/mbc.E04-07-0567. [DOI] [PMC free article] [PubMed] [Google Scholar]
- 24.Jo M, Stolz DB, Esplen JE, Dorko K, Michalopoulos GK, Strom SC. Cross-talk between epidermal growth factor receptor and c-Met signal pathways in transformed cells. J Biol Chem. 2000;275:8806–11. doi: 10.1074/jbc.275.12.8806. [DOI] [PubMed] [Google Scholar]
- 25.Abounader R, Reznik T, Colantuoni C, Martinez-Murillo F, Rosen EM, Laterra J. Regulation of c-Met-dependent gene expression by PTEN. Oncogene. 2004;23:9173–82. doi: 10.1038/sj.onc.1208146. [DOI] [PubMed] [Google Scholar]
- 26.Rojas M, Yao S, Lin YZ. Controlling epidermal growth factor (EGF)-stimulated Ras activation in intact cells by a cell-permeable peptide mimicking phosphorylated EGF receptor. J Biol Chem. 1996;271:27456–61. doi: 10.1074/jbc.271.44.27456. [DOI] [PubMed] [Google Scholar]
- 27.Tice DA, Biscardi JS, Nickles AL, Parsons SJ. Mechanism of biological synergy between cellular Src and epidermal growth factor receptor. Proc Natl Acad Sci U S A. 1999;96:1415–20. doi: 10.1073/pnas.96.4.1415. [DOI] [PMC free article] [PubMed] [Google Scholar]
- 28.Prenzel N, Zwick E, Daub H, et al. EGF receptor transactivation by G-protein-coupled receptors requires metalloproteinase cleavage of proHB-EGF. Nature. 1999;402:884–8. doi: 10.1038/47260. [DOI] [PubMed] [Google Scholar]
- 29.Gschwind A, Prenzel N, Ullrich A. Lysophosphatidic acid-induced squamous cell carcinoma cell proliferation and motility involves epidermal growth factor receptor signal transactivation. Cancer Res. 2002;62:6329–36. [PubMed] [Google Scholar]
- 30.Laterra J, Indurti RR, Goldstein GW. Regulation of in vitro glia-induced microvessel morphogenesis by urokinase. J Cell Physiol. 1994;158:317–24. doi: 10.1002/jcp.1041580214. [DOI] [PubMed] [Google Scholar]
- 31.Shah BH, Farshori MP, Catt KJ. Neuropeptide-induced transactivation of a neuronal epidermal growth factor receptor is mediated by metalloprotease-dependent formation of heparin-binding epidermal growth factor. J Biol Chem. 2004;279:414–20. doi: 10.1074/jbc.M309083200. [DOI] [PubMed] [Google Scholar]
- 32.Walter KA, Hossain MA, Luddy C, Goel N, Reznick TE, Laterra J. Scatter factor/hepatocyte growth factor stimulation of glioblastoma cell cycle progression through G1 is c-Myc dependent, and independent of p27 suppression, cdk2 activation, or E2F1-dependent transcription. Mol Cell Biol. 2002;22:2703–15. doi: 10.1128/MCB.22.8.2703-2715.2002. [DOI] [PMC free article] [PubMed] [Google Scholar]
- 33.Bowers DC, Fan S, Walter K, et al. Scatter factor/hepatocyte growth factor activates AKT and protects against cytotoxic death in human glioblastoma via PI3-kinase and AKT-dependent pathways. Cancer Res. 2000;60:4277–83. [PubMed] [Google Scholar]
- 34.Wang L, Cummings R, Zhao Y, et al. Involvement of phospholipase D2 in lysophosphatidate-induced transactivation of platelet-derived growth factor receptor-β in human bronchial epithelial cells. J Biol Chem. 2003;278:39931–40. doi: 10.1074/jbc.M302896200. [DOI] [PubMed] [Google Scholar]
- 35.Carpenter G. EGF receptor transactivation mediated by the proteolytic production of EGF-like agonists. Sci STKE. 2000;15:PE1. doi: 10.1126/stke.2000.15.pe1. [DOI] [PubMed] [Google Scholar]
- 36.Civenni G, Holbro T, Hynes NE. Wnt1 and Wnt5a induce cyclin D1 expression through ErbB1 transactivation in HC11 mammary epithelial cells. EMBO Rep. 2003;4:166–71. doi: 10.1038/sj.embor.embor735. [DOI] [PMC free article] [PubMed] [Google Scholar]
- 37.Eisenberg A, Biener E, Charlier M, et al. Transactivation of erbB2 by short and long isoforms of leptin receptors. FEBS Lett. 2004;565:139–42. doi: 10.1016/j.febslet.2004.03.089. [DOI] [PubMed] [Google Scholar]
- 38.Chen CH, Cheng TH, Lin H, et al. Reactive oxygen species generation is involved in epidermal growth factor receptor transactivation through the transient oxidization of Src homology 2-containing tyrosine phosphatase in endothelin-1 signaling pathway in rat cardiac fibroblasts. Mol Pharmacol. 2006;69:1347–55. doi: 10.1124/mol.105.017558. [DOI] [PubMed] [Google Scholar]
- 39.Yamauchi T, Yamauchi N, Ueki K, et al. Constitutive tyrosine phosphorylation of ErbB-2 via Jak2 by autocrine secretion of prolactin in human breast cancer. J Biol Chem. 2000;275:33937–44. doi: 10.1074/jbc.M000743200. [DOI] [PubMed] [Google Scholar]
- 40.Slomiany BL, Slomiany A. Src-kinase-dependent epidermal growth factor receptor transactivation in salivary mucin secretion in response to β-adrenergic G-protein-coupled receptor activation. Inflammopharmacology. 2004;12:233–45. doi: 10.1163/1568560042342329. [DOI] [PubMed] [Google Scholar]
- 41.Saito Y, Haendeler J, Hojo Y, Yamamoto K, Berk BC. Receptor heterodimerization: essential mechanism for platelet-derived growth factor-induced epidermal growth factor receptor transactivation. Mol Cell Biol. 2001;21:6387–94. doi: 10.1128/MCB.21.19.6387-6394.2001. [DOI] [PMC free article] [PubMed] [Google Scholar]
- 42.Neve KA. Double feature at the signalplex. Mol Pharmacol. 2005;68:275–8. doi: 10.1124/mol.105.015263. [DOI] [PubMed] [Google Scholar]
- 43.Yang X, Zhu MJ, Sreejayan N, Ren J, Du M. Angiotensin II promotes smooth muscle cell proliferation and migration through release of heparin-binding epidermal growth factor and activation of EGF-receptor pathway. Mol Cells. 2005;20:263–70. [PubMed] [Google Scholar]
- 44.Boerner JL, Biscardi JS, Silva CM, Parsons SJ. Transactivating agonists of the EGF receptor require Tyr 845 phosphorylation for induction of DNA synthesis. Mol Carcinog. 2005;44:262–73. doi: 10.1002/mc.20138. [DOI] [PubMed] [Google Scholar]
- 45.Ettenberg SA, Rubinstein YR, Banerjee P, Nau MM, Keane MM, Lipkowitz S. cbl-b inhibits EGF-receptor-induced apoptosis by enhancing ubiquitination and degradation of activated receptors. Mol Cell Biol Res Commun. 1999;2:111–8. doi: 10.1006/mcbr.1999.0157. [DOI] [PubMed] [Google Scholar]
- 46.Schmidt MH, Hoeller D, Yu J, et al. Alix/AIP1 antagonizes epidermal growth factor receptor downregulation by the Cbl-SETA/CIN85 complex. Mol Cell Biol. 2004;24:8981–93. doi: 10.1128/MCB.24.20.8981-8993.2004. [DOI] [PMC free article] [PubMed] [Google Scholar]
- 47.Paez JG, Janne PA, Lee JC, et al. EGFR mutations in lung cancer: correlation with clinical response to gefitinib therapy. Science. 2004;304:1497–500. doi: 10.1126/science.1099314. [DOI] [PubMed] [Google Scholar]
- 48.Lynch TJ, Bell DW, Sordella R, et al. Activating mutations in the epidermal growth factor receptor underlying responsiveness of non-small-cell lung cancer to gefitinib. N Engl J Med. 2004;350:2129–39. doi: 10.1056/NEJMoa040938. [DOI] [PubMed] [Google Scholar]
- 49.Towbin H, Staehelin T, Gordon J. Electrophoretic transfer of proteins from polyacrylamide gels to nitrocellulose sheets: procedure and some applications. Proc Natl Acad Sci U S A. 1979;76:4350–4. doi: 10.1073/pnas.76.9.4350. [DOI] [PMC free article] [PubMed] [Google Scholar]
- 50.Bradford MM. Rapid and sensitive method for the quantitation of microgram quantities of protein utilizing the principle of protein-dye binding. Anal Biochem. 1976;72:859–64. doi: 10.1016/0003-2697(76)90527-3. [DOI] [PubMed] [Google Scholar]
- 51.Li Y, Lal B, Kwon S, et al. The scatter factor/hepatocyte growth factor: c-met pathway in human embryonal central nervous system tumor malignancy. Cancer Res. 2005;65:9355–62. doi: 10.1158/0008-5472.CAN-05-1946. [DOI] [PubMed] [Google Scholar]
- 52.Abounader R, Ranganathan S, Lal B, et al. Reversion of human glioblastoma malignancy by U1 small nuclear RNA/ribozyme targeting of scatter factor/hepatocyte growth factor and c-met expression. J Natl Cancer Inst. 1999;91:1548–56. doi: 10.1093/jnci/91.18.1548. [DOI] [PubMed] [Google Scholar]
- 53.Fan S, Ma YX, Wang J, et al. The cytokine scatter factor inhibits apoptosis and enhances DNA repair by a common mechanism involving signaling through phosphatidyl inositol 3′ kinase. Oncogene. 2000;19:2212–23. doi: 10.1038/sj.onc.1203566. [DOI] [PubMed] [Google Scholar]