Abstract
MRI has been used extensively to noninvasively track the location of cells labeled with superparamagnetic iron-oxide nanoparticles (SPIOs) in vivo. Typically, SPIOs are employed as a negative contrast agent which makes it difficult to differentiate labeled cells from extraneous sources of inhomogeneity and actual voids in the image. As a result, several novel approaches have been put forth to obtain positive contrast from SPIOs. One technique proposed by Cunningham et al. utilizes spectrally selective pulses to excite and refocus spins in the vicinity of the SPIOs. Although the frequency selectivity of this technique provides effective positive contrast, the lack of slice selectivity results in interfering signal from sources of off-resonance outside the slice of interest. We have developed a self-refocused spatial-spectral (SR-SPSP) pulse to achieve slice-selective spin-echo imaging of off-resonant spins. Using a self-refocused pulse affords flexibility in echotime selection since the spin echo may be placed at any time after the end of the pulse. The spatial selectivity achieved by the SR-SPSP RF pulse eliminates background signal from out-of-slice regions and reduces the on-resonant water suppression requirements. Phantom and in vivo data demonstrate that positive contrast and slice-selectivity are achieved using this novel RF pulse.
Keywords: self-refocused, slice-selective, RF pulse, positive contrast, SPIO, cell-tracking, short-echo
Cells labeled with superparamagnetic iron-oxide nanoparticles (SPIOs) may be noninvasively imaged in vivo using MRI (1). One of the main applications is the visualization and tracking of stem cells (2–7). When using standard imaging sequences, SPIOs are used as a negative contrast agent; that is, their presence is indicated by signal voids. This effect occurs due to signal dephasing caused by field variation induced by the SPIOs. An inherent disadvantage of using SPIOs as a negative contrast agent is that dark spots due to the SPIOs cannot be differentiated from voids in the object or other sources of inhomogeneity such as air or water–fat interfaces. In addition, the technique is susceptible to partial volume effects as the chosen voxel volume should be smaller than the SPIO-induced signal void for the particles to be effectively detected (8). To avoid these errors, several techniques have been proposed for positive contrast imaging of SPIO-labeled cells (8–13). These approaches include GRadient echo Acquisition for Superparamagnetic particles with Positive contrast (GRASP), which uses a slice gradient designed to dephase background signal while conserving signal in the region near the SPIOs (9,10), Inversion-Recovery with ON-resonant water suppression (IRON) (11), and fast low angle positive contrast with steady-state free precession (FLAPS) (12,14).
Positive contrast has also been achieved through the use of spectrally selective pulses to excite and refocus off-resonant water in regions near SPIO-labeled cells (8). One advantage of this method is that it does not require application of dephasing gradients or saturation pulses as on-resonant spins are not excited in the first place. In addition, it achieves very high suppression efficiency. Finally, it allows flexible selection of the excited frequency band which may be shifted to encompass spins in the vicinity of the SPIOs and exclude other sources of off-resonance, such as fat. However, although the spectrally selective 90° and 180° pulses used for excitation and refocusing in the sequence enable frequency selectivity, they are not slice-selective, resulting in interfering background signal. Integrating slice selectivity into the sequence would allow regions of greater susceptibility to be excluded from the selected slice, resulting in less background signal. In addition, there would be less on-resonant signal to suppress, allowing for more flexibility in RF pulse design. Finally, slice selectivity would enable a multislice approach to positive contrast imaging which, when combined with individually shimmed slices, would result in considerably less erroneous off-resonant signal. One way to extend this sequence to achieve both frequency and slice-selectivity is to utilize spatial-spectral (SPSP) pulses (15) for excitation and refocusing. However, when sampling a spectral pulse with spatial subpulses to create an SPSP pulse, the RF amplitude of the pulse is increased by a factor proportional to the time-bandwidth (TBW) of the subpulses. To remain below RF peak amplitude limits of the RF amplifier/coil combination, the SPSP pulse needs to be lengthened, resulting in a greater minimum echo-time (TE). Longer echo-times result in increased signal loss due to diffusion of water through the steep local gradients in the field near the SPIOs (8).
We have developed a self-refocused spatial-spectral (SR-SPSP) pulse to enable slice-selective, spin-echo imaging of off-resonant spins without an increase in TE. A self-refocused SPSP pulse is essentially a phase-matched 90° SPSP pulse and 180° SPSP pulse combined into one pulse. This results in a considerably shorter TE than possible with two separate pulses (16). The simultaneous spatial and spectral selectivity allows the imaging of off-resonant spins while selecting a single slice. In this work, we designed and implemented an SR-SPSP pulse for positive contrast imaging of SPIO-labeled cells and tested the pulse with phantom and in vivo experiments.
METHODS
Pulse Design
Spectral Self-Refocused Pulse Design
A spectral self-refocused pulse was designed using the Shinnar Le-Roux (SLR) algorithm (17) to be the envelope for the final SR-SPSP pulse. Using the SLR algorithm, each RF pulse can be described by a pair of complex polynomials (B(z), A(z)). It is convenient to work with the transforms of the these polynomials given by (α(ω), β(ω)) or just (α, β) for notational convenience. The spectral profile of the transverse magnetization generated by a sequence of RF pulses described by α and β is given by
| [1] |
where the complex conjugate is denoted by “∗.”
As a first step, we designed the polynomials for a single pulse that would produce transverse magnetization equivalent to that generated by a pair of separate 90° and 180° pulses (18,19). The composite α and β for a spin echo pulse sequence can be found by sequentially multiplying the 2×1 complex vector of initial α and β values by rotation matrices corresponding to a 90° and 180° pulse, followed by periods of free precession. The vector with elements αse and βse at the time of the spin echo, in terms of these rotation matrices, is given by
| [2] |
where β90 and α90 describe the 90° excitation pulse, and β180 and α180 describe the 180° refocusing pulse. ε is given by
| [3] |
where ω is the spectral frequency and ΔT is the period of time between the peak of the 90° pulse and 180° pulse. Evaluating the matrix product in Eq. [2] yields the expressions for αse and βse given in Eq. [4]. We may set αsr and βsr for the self-refocused pulse equal to αse and βse, so that the self-refocused pulse produces transverse magnetization equivalent to a spin echo.
| [4] |
When utilizing Eq. [1] to compute the transverse magnetization produced by the self-refocused pulse described by αsr and βsr, the unrefocused, parasitic, and desired spin echo terms are equivalent to those produced by a pulse pair. The expression for the transverse magnetization is
| [5] |
The term in Eq. [5] that is independent of ε is the desired spin echo term,
| [6] |
To obtain a linear phase at the echo, we compensate the phase of by the phase of β90. If we take into account the magnitude targets in the passband, a simple and easy solution would be to pose
| [7] |
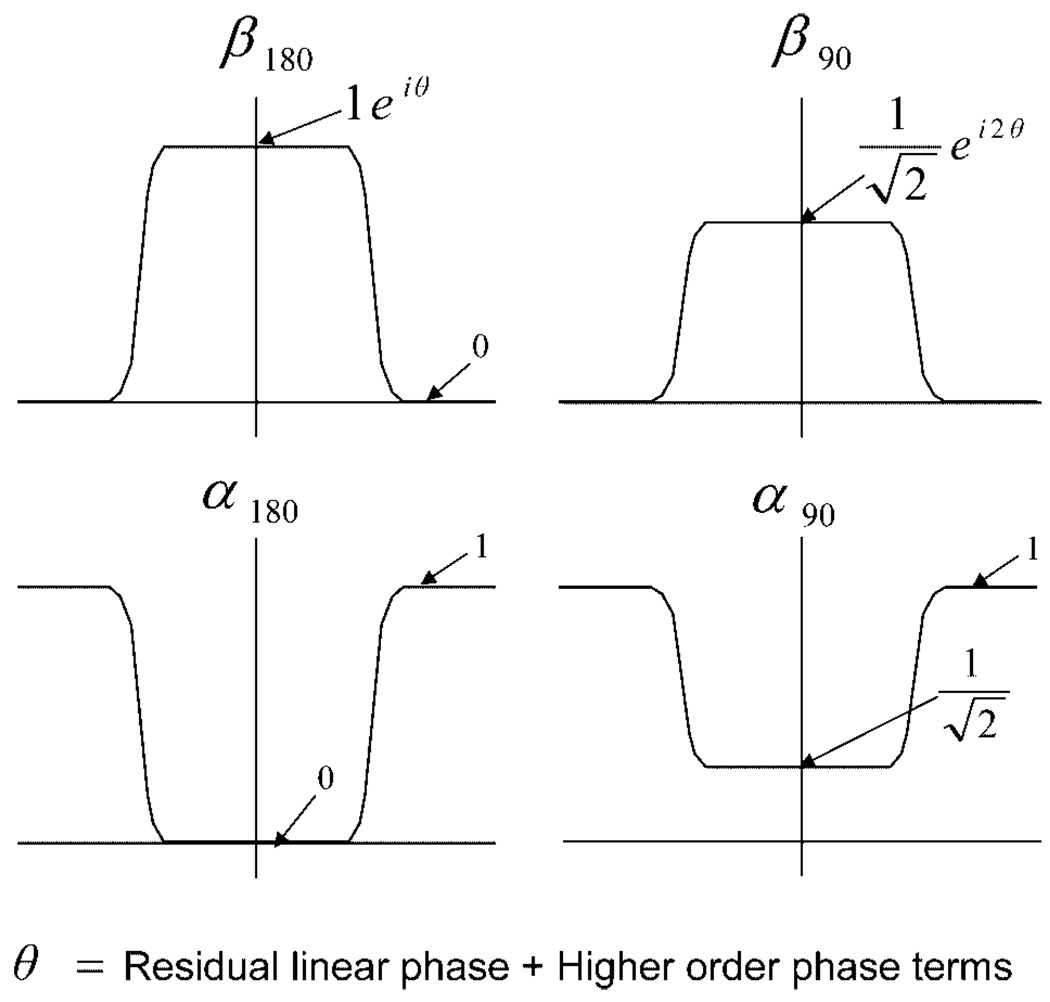
The approximate profiles, including passband and stopband values, for β180, β90, α180, and α90 are illustrated in Fig. 1. When utilizing the β90 in Eq. [7], the phase in the passband of β90 will be twice the phase of β180 in the passband. Not shown in Fig. 1 is the small phase of α90 which we are neglecting for this design. Theoretically, the small phase contribution of α90 could be compensated by adjusting the phase of β90. This may be implemented in a future iteration of the pulse.
FIG. 1.
Target profiles for β180, β90, α180, and α90 showing magnitude and phase values in the passbands and stopbands. θ is the sum of any residual linear phase as well as higher order phase components. Since we are setting , the phase of β90 is twice the phase of β180, resulting in the compensation of this phase in the final spin echo. Although there is no phase shown for α90 in the passband, there exists a small phase component that is being approximated to zero in this design.
We extend Eq. [7] to include the parameter ϕ which allows us to adjust the final echo phase
| [8] |
When using the the β90 in Eq. [8], the expressions for αsr and βsr in Eq. [4] can be closely approximated as
| [9] |
The parameter ε determines the echo delay given by ΔT in Eq. [3]. In particular, ΔT is the time between the end of the self-refocused pulse and the occurrence of the spin echo.
The approximation used in Eq. [9] utilizes the fact that the terms in Eq. [4] are products of α and β profiles that have equal passband and transition band widths but differ in passband magnitude. For example, we can approximate α90α180 in the expression for αsr by α180 because, as shown in Fig. 1, α180 has the same profile shape as α90 and is approximately equal to zero in the passband, resulting in a product that is zero in the passband.
The approximated expressions in Eq. [9] provide a more simplified design than those in Eq. [4], with similar behavior in the passband and stopbands of the spectral profile. However, if the behavior in the transition bands is important, the pulse designer may choose to use the β and α values in Eq. [4].
A minimum-phase β180 and corresponding α180 were used in Eq. [9] so that the resultant self-refocused pulse would have minimum TE. An equiripple, linear-phase FIR filter was generated using the firpm function in MATLAB (The Mathworks, Natick, MA) and then factored into its minimum- and maximum-phase components using the algorithm in (20). The polynomial, β180, was represented by the resultant minimum-phase FIR filter. A matching minimum-phase, minimum-power α180 polynomial was calculated. Once β180 is designed, β90 can be set to the value in Eq. [8]. However, this relationship is implicit in the approximation of Eq. [9], therefore α90 and β90 do not actually have to be generated. The echo delay can be set to any value greater than or equal to zero. For this design, a ΔT of 3.7 ms was used to leave sufficient time for the phase encoding and readout gradients. Once the polynomials for the self-refocused pulse were calculated using Eq. [9], they were used as inputs to the inverse SLR transform to generate the self-refocused RF pulse envelope.
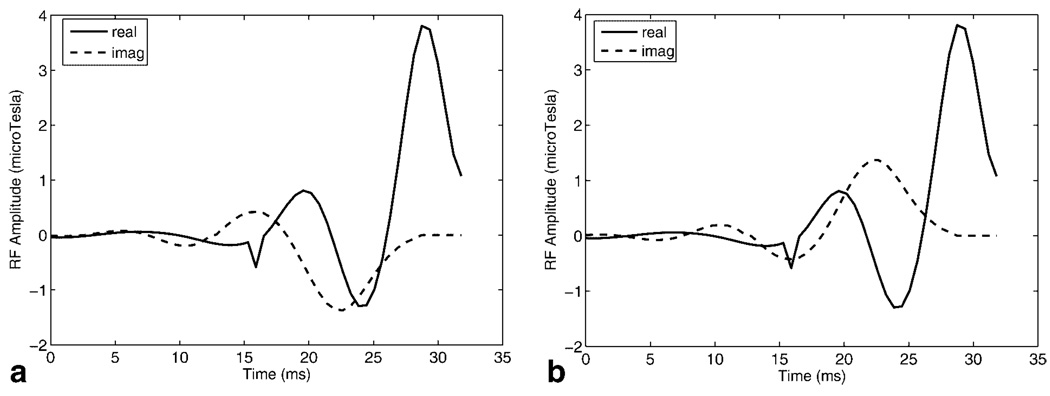
Merging a 90°–180° pulse pair into a single pulse leaves no room for the placement of crushers around the 180° pulse to eliminate unrefocused and parasitic components of the magnetization. Consequently, acquisitions from two different self-refocused pulses are required: pulse 1, with the echo phase ϕ = −90° is shown in Fig. 2a and pulse 2 with ϕ = 90° is shown in Fig. 2b. If the profile of pulse 2 is subtracted from the profile of pulse 1, the component of the magnetization that is not refocused is eliminated. The gain in signal-to-noise ratio (SNR) is equivalent to that obtained when using two averages. The final spectral profile is given by
| [10] |
FIG. 2.
Real and imaginary components of (a) self-refocused spectral RF pulse 1 with the echo phase ϕ = −90° and (b) self-refocused spectral RF pulse 2 with the echo phase ϕ = 90°. Echoes produced by the two pulses are subtracted to obtain the final spectral profile.
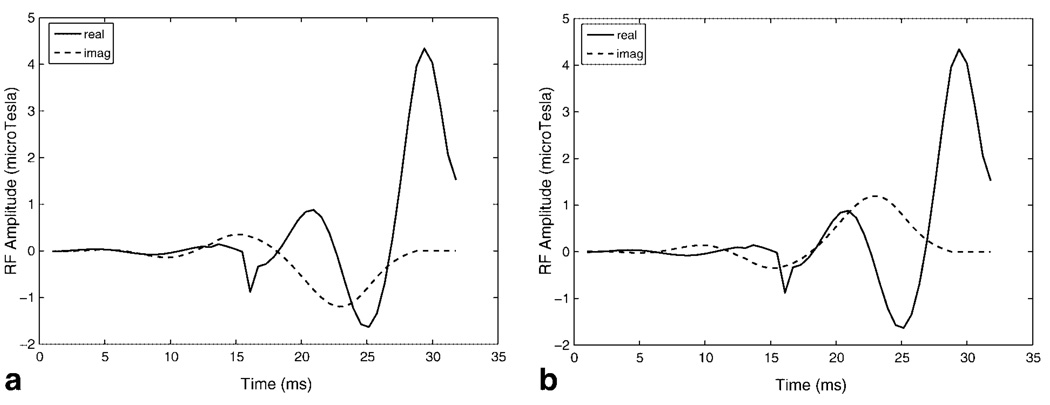
We also generated RF pulses using the exact expressions for the self-refocused α and β polynomials in Eq. [4]. Figure 3a,b show the real and imaginary components of the self-refocused pulses with ϕ = −90° and ϕ = 90° that were generated using the exact solution. The pulses in Fig. 3 are very similar to the approximate solution in Fig. 2 and achieve similar spectral profiles. We prefer the approximate solution as it provides a design algorithm that is simpler to implement and more intuitive.
FIG. 3.
Real and imaginary components of (a) self-refocused spectral RF pulse 1 with the echo phase ϕ = −90° and (b) self-refocused spectral RF pulse 2 with the echo phase ϕ = 90° generated using the exact expressions for α and β in Eq. [4]. Pulses are very similar to those resulting from the approximate solution in Fig. 2 and produce similar spectral profiles. The peak RF amplitude of the pulses is greater than the pulses in Fig. 2.
Self-Refocused Spatial-Spectral Pulse Design
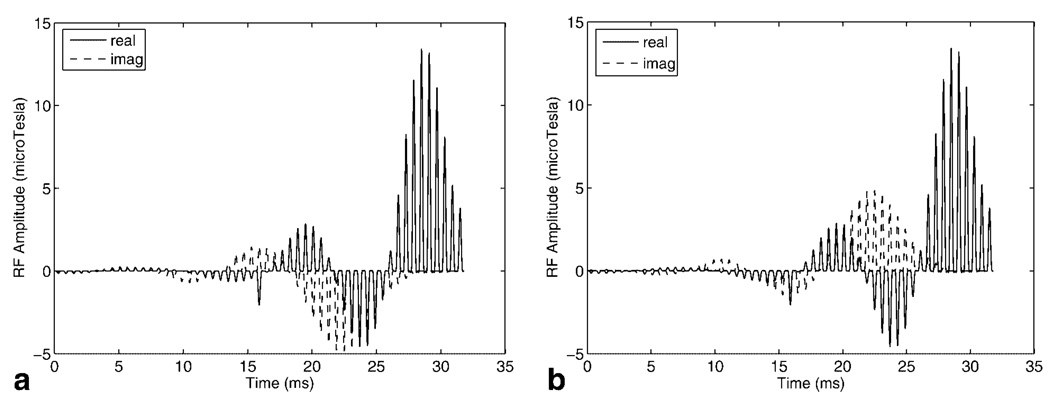
The self-refocused pulses 1 and 2 in Fig. 2 were sampled with 53 samples based on a trade off between sideband distance and minimum slice thickness. The final SR-SPSP pulses comprised 53 conventional small tip-angle subpulses scaled by the sampled values of the spectral self-refocused pulse envelopes. The subpulses were a least-squares Fourier design generated using the firls function in MATLAB. The spectral sidebands had to be placed at a sufficient distance away from the main passband to prevent erroneous excitation of signal from sources such as fat or on-resonant water once the spectral profile was shifted. Clearly, it would be desirable to have the sidebands as far out as possible, but increased sideband spacing required shorter subpulse duration and hence faster gradient refocusing for the same slice thickness. Thus, sideband spacing was limited by available gradient amplitude and slew rate. A minimum slice thickness of 4 mm was calculated using the gradient amplitude and slew rate limits of 40 mT/m and 150 T/m/s offered by the 1.5T GE CV/i scanner. If insert gradients with higher amplitude and slew rate limits are used, as is the case in many animal scanners, more gradient area may be accrued during the subpulses enabling much thinner slices and making subpulse duration less of a limitation. The final SR-SPSP pulses shown in Fig. 4 had a duration of 31.8 ms, a spectral bandwidth of 216 Hz, and a spatial bandwidth of 4,000 Hz.
FIG. 4.
Real and imaginary components of (a) SR-SPSP RF pulse 1 and (b) SR-SPSP RF pulse 2. The SPSP pulses are obtained by sampling the spectral pulse envelopes in Figs. 2a,b with small-tip angle spatial subpulses.
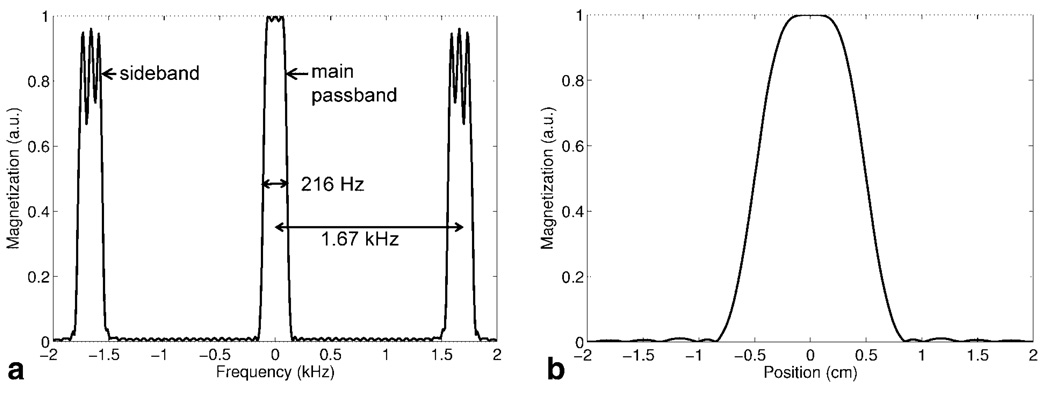
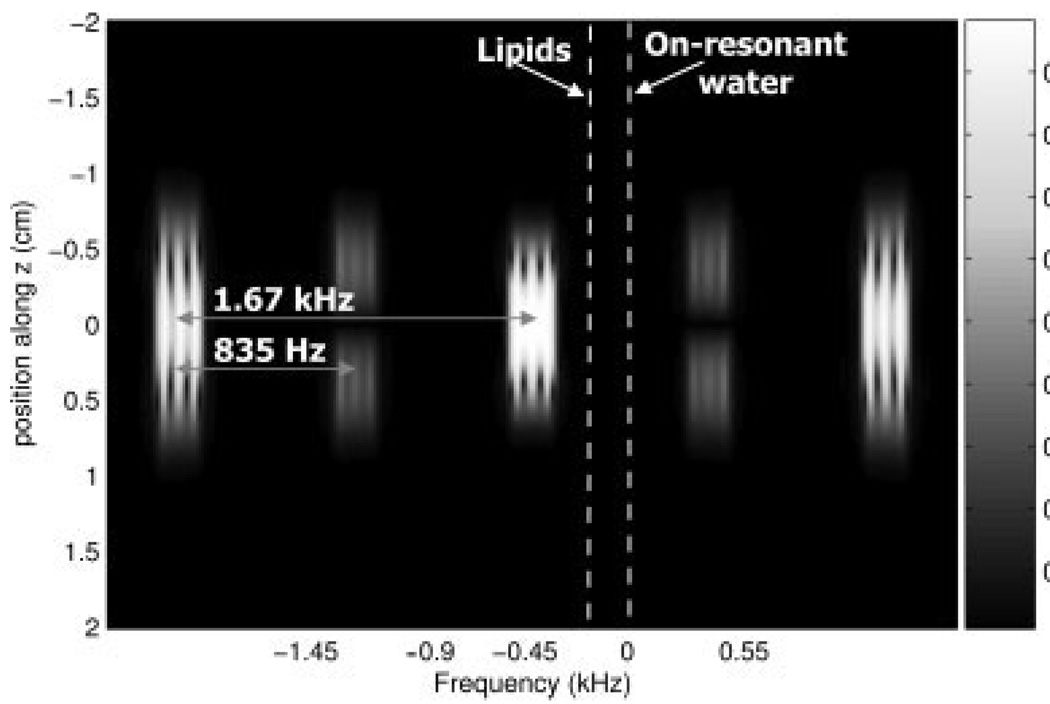
Simulations were performed in MATLAB by explicitly multiplying the rotation matrices to obtain the spectral and spatial profiles of the pulse. T1 and T2 effects were neglected. The spectral profile obtained after subtracting the simulated profiles of pulse 1 and pulse 2 is plotted in Fig. 5a. The profile shows the main spectral passband and sidebands located at ±1.67 kHz. Figure 5b is the simulated spatial profile. Simultaneous spatial and spectral selectivity as well as the chemical shift immunity of the pulse profile is demonstrated in the simulated 2D spatial-spectral profile shown in Fig. 6. The main spectral passband, sidebands as well as opposing sidebands are visible in this 2D profile. In the final implementation, the transmit frequency of the pulses is shifted off-center to allow positive contrast imaging. The profile in Fig. 6 has been shifted by −450 Hz. At this offset frequency, signal from on-resonant water and fat is excluded from the main passband as well as the sidebands and opposing sidebands. Opposing sidebands exist in the spectral profile because a SPSP pulse does not exactly trace out a rectilinear excitation k-space trajectory.
FIG. 5.
Simulated subtracted magnetization profiles for the spin echo produced by the SR-SPSP pulses. (a) Spectral profile showing the main passband with a bandwidth of 216 Hz and sidebands spaced ±1.67 kHz from the main passband. (b) Spatial profile for slice selected within the main passband.
FIG. 6.
2D spatial-spectral profile showing selected slice for a range of frequencies. In addition to the sidebands at ±1.67 kHz, opposing sidebands are visible at ±835 Hz. Ideally, the spectral offset of the pulse should be chosen such that both sidebands and opposing sidebands do not erroneously excite on-resonant water or lipids.
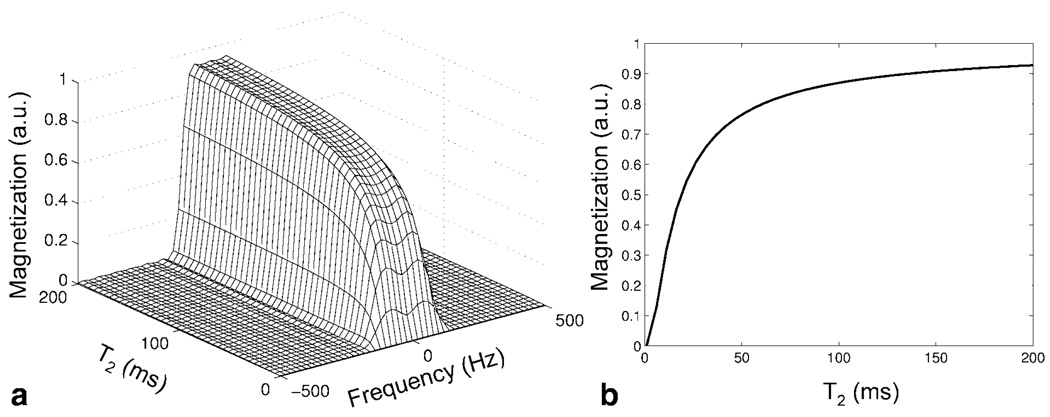
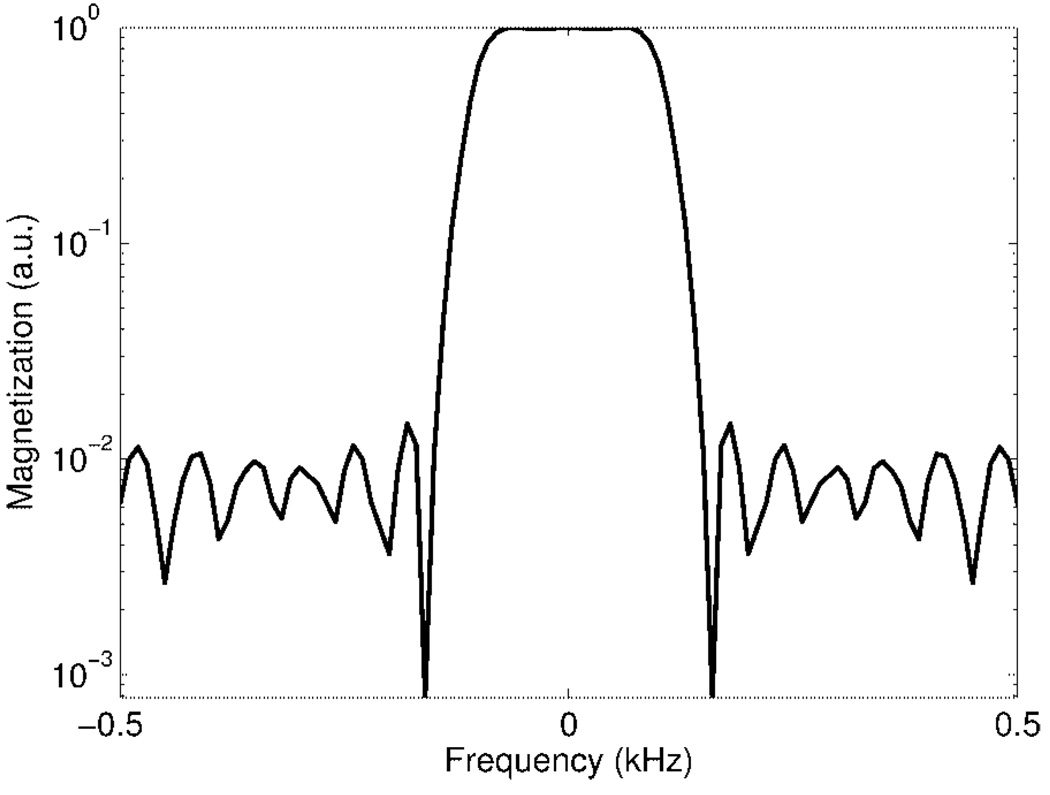
To determine the behavior of the SR-SPSP pulse when exciting and refocusing spins with short relaxation times, the spectral profile was generated using a Bloch simulator for a range of T2 values. The results are shown in Fig. 7a. Significant signal loss at the center of the spectral passband as well as loss of passband selectivity occurs at T2 values less than 30 ms. This is expected because of the long duration of the pulse. However, decay due to is refocused by the SR-SPSP pulse as it achieves a spin-echo. Our simulations showed that the T2 value at which the profile begins to degrade decreases when smaller values are chosen for the echo delay ΔT. A cross section along the T2 direction through the center of the spectral band is shown in Fig. 7b. Figure 8 is a log plot of the simulated spectral passband demonstrating that a 100-fold or 40 dB suppression efficiency for on-resonant water may be achieved using these pulses.
FIG. 7.
(a) Simulated spectral profile of the 31.8 ms SR-SPSP pulse for a range of T2 values. Significant degradation of the main spectral profile begins for T2 values shorter than ~30 ms. (b) Cross-section through center of spectral profile showing signal loss due to T2 decay.
FIG. 8.
Main passband of simulated spectral profile drawn on a log scale. The pulse achieves 100-fold or 40 dB suppression efficiency.
Final Pulse Sequence
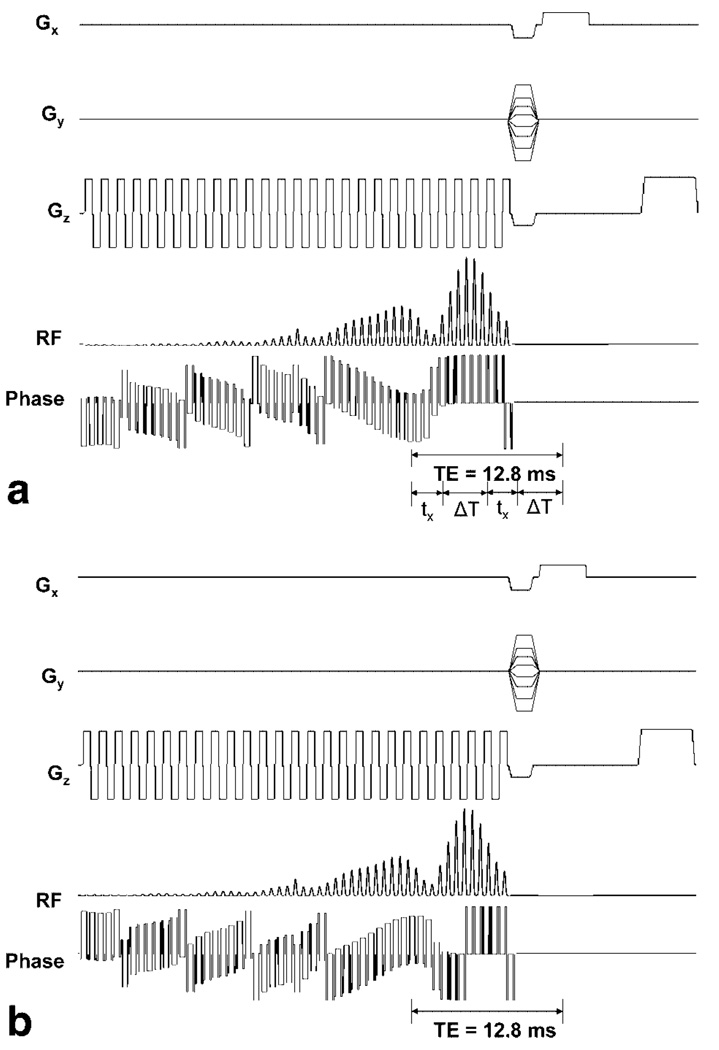
Figure 9 shows the RF amplitude, RF phase, and gradient waveforms for the sequences which utilize version 1 (Fig. 9a) and 2 (Fig. 9b) of the SR-SPSP pulse to create a spin echo. RF amplitude waveforms are identical for the two pulses; however, the phase waveforms differ. The pulses are played in conjunction with an oscillating gradient waveform. Although the pulse duration is long, most of the energy is concentrated toward the end of the pulse. If tx is the time between the peak of the pulse and the end of the pulse and ΔT is the delay between the end of the pulse and the occurrence of the echo, then the effective TE is given by 2(tx + ΔT). For a 31.8 ms pulse, 1.7 ms phase encode and 4 ms readout gradient, a minimum TE of 12.8 ms can be achieved. tx and ΔT for this pulse are 2.7 and 3.7 ms, respectively. The transmit frequency of the pulses is offset by ±450 Hz to selectively acquire signal from off-resonant spins in the vicinity of the SPIO nanoparticles.
FIG. 9.
RF, phase, and gradient waveforms for pulse sequence used for the (a) first acquisition and (b) second acquisition using a SR-SPSP pulse. Spin echoes created by the two sequences have 180° difference in phase and are subtracted from each other to remove unrefocused components of the magnetization.
Phantom and In Vivo Experiments
Labeled Cell Preparation
We used ferumoxides (Feridix IV; Berlex Laboratories, Wayne, NJ), which had a total iron content of 11.2 mg Fe/mL, and clinical-grade protamine sulfate (PS; American Pharmaceuticals Partner, Schaumburg, IL), which was prepared as a stock solution of 1 mg/mL in distilled water, for labeling human bone marrow stromal cells (hBMSC; courtesy of Cognate BioServices, Sunnyvale, CA) (21,22). The original ferumoxide solution was added into a tube containing hBMSC complete media (Cognate), then PS was applied into the ferumoxides mixed media, and shaken well for 5 min. Finally, the labeling media was combined with equal amounts of hBMSC complete media and the hBMSC were incubated in the labeling media for 12–15 h. The final concentration of Fe and PS was 50 and 6 µg/mL, respectively. In our experiment, we estimated that a maximum of 1,500 µg of Fe was used.
Phantom Experiments
Data was obtained from a cylindrical phantom composed of agar gel (1.0% copper sulfate and 0.7% agarose in distilled water) with vials containing varying populations (0.5×10⁶, 1×10⁶, 3×10⁶, 5×10⁶) of SPIO-labeled human bone marrow stromal cells. The phantom was scanned with a standard birdcage head coil at 1.5 T (Echospeed whole-body magnet; GE Healthcare, Waukesha, WI). Positive contrast images of a 4-mm slice, chosen to include the labeled cells, were obtained using the sequence in Fig. 9 and compared to a conventional GRE sequence. Two positive contrast images were obtained: One with a spectral offset of 450 Hz and a second with a spectral offset of −450 Hz. Acquisition parameters were as follows: TE/TR = 12.8/500 ms, matrix size = 256×128, and scan time = 2:08 min (for two 64 s scans). SNR values were estimated for the positive contrast image with a spectral offset of 450 Hz. The standard deviation (SD) and mean of the noise in a region of interest in the background were calculated using the method in (23,24). Two values for SNR were computed. The first value, SNR1, was the mean of all positive signal computed by thresholding at 3 SDs above the mean of the background noise, divided by the SD of the background noise. The second value, SNR2, was the magnitude of the brightest pixel divided by the SD of the noise.
To test slice selectivity, through-plane images of the cylindrical phantom were obtained by changing the readout gradient to the slice-select or z dimension. A projection image of the phantom along the z dimension was obtained using a GRE sequence to show the extent of the phantom in this dimension. An image was then acquired using the sequence in Fig. 9 with the spectral offset set to zero to show the extent of the selected slice. Acquisition parameters remained the same (i.e., slice thickness = 4 mm, TE/TR = 12.8/500 ms, matrix size = 256 × 128, and scan time = 2:08 min).
In Vivo Experiments
A total of 3 million and 1 million SPIO-labeled human bone marrow stromal cells were injected into the hind legs of a mouse. The study was performed under a protocol approved by the Stanford University Administrative Panel on Laboratory Animal Care. The mouse was anesthetized using an intraperitoneal injection of 100 mg/kg ketamine (Wyeth, Madison, NJ) and 20 mg/kg xylazine solution (Phoenix Pharmaceuticals, St. Joseph, MO). The mouse was then scanned at 1.5 T (Echospeed whole-body magnet; GE Healthcare, Waukesha, WI) with a standard 3-inch surface coil. Positive contrast images of a 4- and 7-mm slice chosen to include the injected cells were obtained using the sequence in Fig. 9. A negative contrast image was also acquired using a standard GRE sequence. Acquisition parameters were as follows: TE/TR = 12.8/400 ms, matrix size = 256 × 128, and scan time = 1:42 min.
RESULTS
Phantom Results
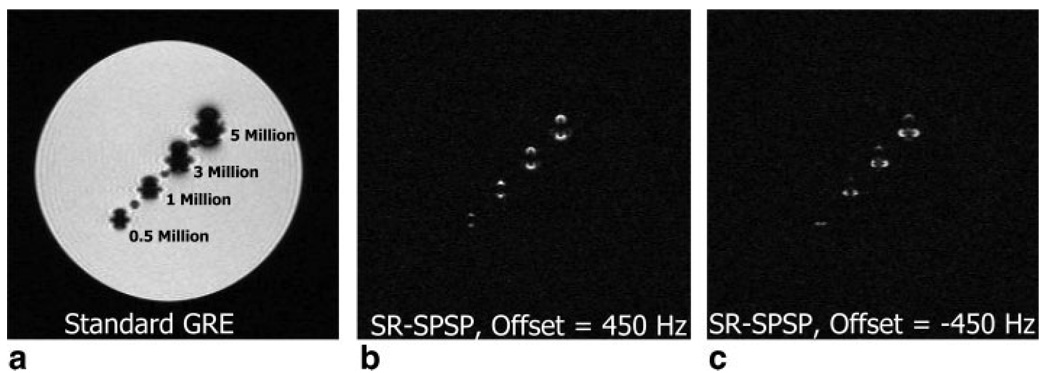
Figure 10a shows an in-plane image obtained using a standard GRE sequence of a 4-mm slice through the cylindrical agar phantom. The slice was chosen to pass through all SPIO-labeled cell populations (indicated on the image). When using a GRE sequence, SPIOs act as a negative contrast agent and therefore signal voids occur in the vicinity of the labeled cells. Figure 10b,c are the positive contrast images of the same slice obtained using the SR-SPSP sequence with the spectral offset set to 450 and −450 Hz, respectively. Different lobes of the induced dipole field around the SPIOs are excited and refocused in Fig. 10b,c, resulting in different shapes for the associated white spots. There is minimal spatial misregistration between the signal voids in the GRE image and the white spots in the SR-SPSP spin-echo images. A spectral offset of ±450 Hz was chosen to encompass off-resonant spins near the SPIOs while maintaining sufficient distance between the spectral sidebands and the frequency of on-resonant spins.
FIG. 10.
Results obtained from a cylindrical agar phantom with vials containing varying concentrations of SPIO-labeled human bone-marrow stromal cells. A standard birdcage head coil was used at 1.5 T. (a) Image of phantom obtained using a GRE sequence with cell concentrations labeled on image. Positive contrast image of phantom using the SR-SPSP pulse with a spectral offset of (b) 450 Hz and (c) −450 Hz. Acquisition parameters were as follows: TE/TR = 12.8/500 ms, slice thickness = 4 mm, matrix size = 256 × 128 and scan time = 2:08 min.
SNR1 and SNR2 values were calculated for the image in Fig. 10b as outlined in the methods. The SD and mean of the noise were 3.07×10⁷ and 3.85×10⁷ a.u., respectively. The mean of the signal after thresholding at 3 SDs above the mean of the noise was 3.28×10⁸ a.u. and resultant value for SNR1 was 10.7. When thresholding at this level, all labeled cell populations were still visible. The magnitude of the brightest signal was 9.88 × 10⁸ a.u., resulting in a SNR2 value of 32.2.
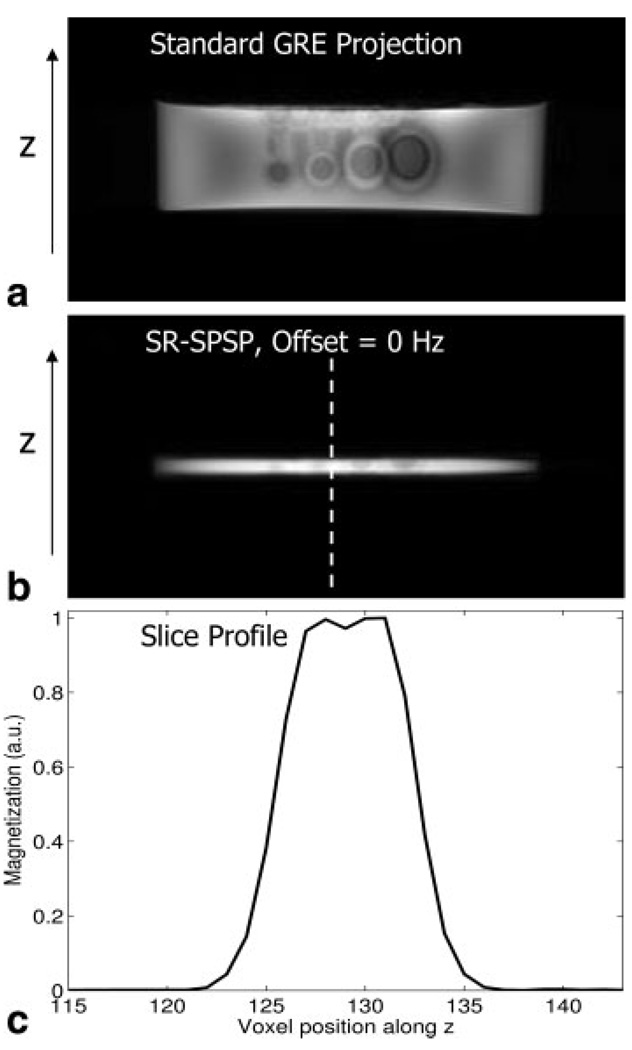
Figure 11 shows images of the cylindrical agar phantom along the slice-select or z dimension. Figure 11a is a GRE projection image without slice selection showing the full extent of the phantom along z. Figure 11b is the image of the 4-mm slice selected using the sequence in Fig. 9 with the spectral offset set to 0 Hz. Figure 11c shows the spatial profile obtained by taking a cross section of the image in b. There is a slight loss in signal at the center of the spatial profile, likely due to the pulse amplitude being set too high during prescan.
FIG. 11.
Slice-selection shown in the cylindrical agar phantom containing SPIO-labeled cells. (a) Projection image through the phantom showing the extent of the phantom in the through-plane or z dimension. (b) Image of selected slice in z, obtained using the SR-SPSP pulse offset to 0 Hz and (c) cross section showing the slice profile achieved. Acquisition parameters were as follows: TE/TR = 12.8/500 ms, slice thickness = 4 mm, matrix size = 256 × 128, and scan time = 2:08 min.
In Vivo Results
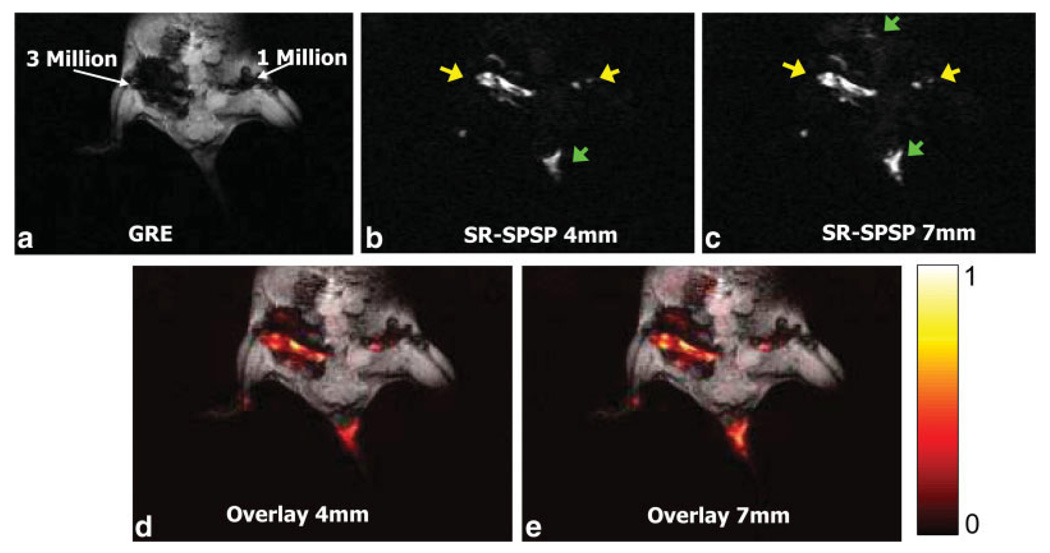
Refer to Fig. 12 for in vivo data from a mouse, with 1 million and 3 million SPIO-labeled stem cells injected into the hind legs. Figure 12a shows an image obtained using a standard GRE sequence to excite a 3-mm slice. Large signal voids indicate the presence of the labeled cells. Positive contrast images obtained at the same slice location using the sequence in Fig. 9 of a 4- and 7-mm slice are shown in Fig. 12b,c, respectively. The spectral offset of the pulses was set to −450 Hz to exclude the fat resonances from the sidebands or opposing sidebands of the spectral profile. Both images are windowed equivalently. Areas of bright signal resulting from the SPIO-labeled cells are indicated by the yellow arrows while signal contributions due to other sources of inhomogeneity are indicated by the green arrows. Less labeled cells are included in the thinner (4 mm) slice, resulting in lower signal at the cell injection sites. However, the signal is also more spatially localized and there is less background signal from competing sources of inhomogeneity than in the thicker (7 mm) slice. Both images include off-resonant signal from the base of the mouse tail where no cells were injected. This may be due to the susceptibility effects resulting from tissue composition, tail geometry and varying coil sensitivity resulting from the base of the tail being coincident with the edge of the coil. Figure 12d,e show heat maps of the positive contrast images in Fig. 12b,c overlaid on the GRE image. The locations of the injected cell populations are shown as bright spots within the larger regions of blowout created by the SPIOs in the GRE image.
FIG. 12.
In vivo images of a mouse with 3 million and 1 million SPIO-labeled human bone-marrow stromal cells injected into the hind legs. Images were obtained at 1.5 T using a 3-inch surface coil. (a) GRE image of mouse with labeled cell concentrations. Acquisition parameters for GRE image were as follows: TE/TR = 12.8/250 ms, slice thickness = 3 mm, matrix size = 256×128, and scan time = 1:05 min. Positive contrast image obtained using the SR-SPSP pulse sequence in Fig. 9 for (b) a 4-mm slice and (c) a 7-mm slice. Spectral offset was set to −450 Hz to exclude the fat resonance from the sidebands. Acquisition parameters for positive contrast images in (b) and (c) were as follows: TE/TR = 12.8/400 ms, matrix size = 256 × 128, and scan time = 1:42 min. Yellow arrows indicate bright spots due to positive contrast and green arrows indicate signal due to other off-resonant sources. The bright signal in the tail region is also coincident with the edge of the coil, which may cause additional inhomogeneity. (d) and (e) show heat maps of positive contrast images in (b) and (c) overlaid on the GRE image.
DISCUSSION
Phantom and in vivo data demonstrate that the self-refocused SPSP pulse is successful in creating positive-contrast images of SPIO-labeled cells. Slice-selectivity is achieved without increasing the TE any longer than that achieved by Cunningham et al. (8) for non-slice-selective positive contrast imaging. Greater suppression of background signal was observed for thinner slices as more out-of-slice sources of susceptibility were excluded from the slice and less on-resonant water suppression was required. The SR-SPSP pulse sequence is amenable to a multislice approach in combination with individual slice shimming. The sequence achieves high suppression efficiency since on-resonant spins are never excited and suppression is limited to a slice rather than a volume. By changing the transmit frequency of the pulses, flexible selection of the excited frequency range is possible without modifications to the sequence or pulse and gradient waveforms.
As mentioned in the Methods section, TE is given by 2(tx + ΔT), where tx is the time between the peak and the end of the pulse and ΔT is the adjustable echo delay. The minimum TE may be shortened by either reducing ΔT or tx . ΔT may be set to any value greater than zero and is independent of pulse duration, making it possible to achieve shorter echo-times by using earlier readout techniques. Earlier readout of the spin echo can occur by minimizing the duration of the phase encode and readout dephasing gradients and by using partial k-space reconstruction. We calculated that the duration of the phase encoding gradient could be shortened to 0.6 ms while retaining a grid size of 256 × 256. When used in conjunction with a 3/4 k-space acquisition,ΔT may be shortened to 1.6 ms. tx may be reduced by decreasing the pulse duration and consequently increasing the spectral bandwidth. However, to maintain adequate separation between the edges of the passband and sidebands, subpulse duration (i.e., sampling period) would have to be shortened, increasing the minimum achievable slice thickness. For example, if pulse duration is decreased to 18 ms, tx is 1.6 ms, which, when used with a delay of 1.6 ms, results in a minimum TE of 6.4 ms. For such a pulse, spectral bandwidth, RF peak amplitude, sideband frequency, and minimum slice thickness are 365 Hz, 30 µT, ±2.5 kHz, and 7.4 mm, respectively.
The data shown in Fig. 10–Fig. 12 was obtained at 1.5 T. The current SR-SPSP pulse may be used at higher fields by choosing a different spectral offset. For example, at 4 T, the on-resonant water and fat frequencies are separated by 580 Hz and may be placed on the stop bands of the spectral profile by setting the spectral offset to 1.13 kHz. However, since the amount of off-resonance induced by the SPIOs scales with field strength, it may be beneficial to use a pulse with a larger spectral bandwidth such as the 18 ms version of the pulse described earlier to capture more signal from the spins near the labeled cells.
The spectral bandwidth of the SR-SPSP pulse used in this work was 216 Hz and the amount by which the spectral profile was shifted was ±450 Hz. However, we have not optimized these parameters for performance in vivo. The choice of spectral bandwidth in conjunction with the chosen spectral offset affects the signal contribution from the regions around the SPIOs as well as signal erroneously captured by the sidebands and opposing sidebands of the shifted spectral profile. Optimizing these and other pulse parameters would result in improved suppression of on-resonant signal as well as improved enhancement of the desired off-resonant signal. Another approach would be to design a customized asymmetric spectral profile with stop bands only on on-resonant water and fat resonances (which are field strength dependent) and passbands at all other frequencies.
One limitation of this technique is that two acquisitions are required to eliminate unrefocused components of the magnetization. This doubles the minimum scan time required to obtain data for a given matrix size. However, the SNR of the final image will be equivalent to that obtained when averaging two acquisitions. Therefore, there is no SNR per unit time penalty associated with the increased scan time. Another limitation of this pulse sequence is that the minimum achievable TR is ~43 ms. This value is calculated given a 31.8 ms SR-SPSP pulse, 4 ms readout, and 2.5 ms spoiler. When compared to the pulses used in the spectrally selective spin-echo imaging sequence by Cunningham et al., the minimum TR is increased by ~20 ms. If the 18 ms pulse and the partial k-space reconstruction technique described earlier are implemented, minimum TR may be decreased to 27 ms.
As seen in Fig. 10b,c, the SR-SPSP pulse enables the visualization of either positive or negative frequency shifts, but not of both simultaneously. Although there is a signal penalty associated with capturing only half of the possible off-resonant signal, limiting the signal to the negative frequency band makes it possible to exclude the fat resonances from the excited frequencies. This obviates the need for additional fat suppression methods that are required in techniques such as IRON (11), which uses all of the off-resonant signal. One method to utilize signal from more off-resonant spins would be to interleave two excitations within the same TR, one capturing the signal from spins at negative frequency shifts and the other from positive frequency shifts. The interleaved sequence would employ SR-SPSP pulses that achieve greater separation between the main spectral passband and sidebands through the use of shorter subpulses. This would prevent fat from shifting into the sidebands for both positive and negative shifts but also require a greater minimum slice thickness if the same gradient set is used.
We have used the SR-SPSP pulse for slice-selective positive contrast imaging of SPIO-labeled cells. However, the SR-SPSP pulse is suitable for any application requiring spatial and spectral selectivity. Variants of the pulse sequence developed in the work may be used for tracking metallic devices used in interventional MRI. The SR-SPSP pulse may also be a suitable replacement for standard pulses in MR spectroscopic imaging sequences. In particular, the spatial and spectral selectivity, relatively short minimum TE, and linear echo phase achieved by the pulse could be useful in obtaining fat- and water-suppressed spectra of both short and long T2 metabolites.
CONCLUSIONS
We have designed and implemented a self-refocused spatial-spectral pulse for positive contrast spin-echo imaging of SPIO-labeled cells. Slice-selection is now enabled as compared to earlier implementations of this technique (8). Visualization of labeled cells was demonstrated through phantom and in vivo experiments.
ACKNOWLEDGMENTS
The authors thank Dr. Charles Cunningham (Department of Medical Biophysics, University of Toronto, Toronto, ON) for helpful discussions and Dr. Brian Hargreaves (Department of Radiology, Stanford University, Stanford, CA) for use of the Bloch simulator and general advice on this project.
Grant sponsor: NIH; Grant number: RR09784
Grant sponsor: The Lucas Foundation
REFERENCES
- 1.Bulte JW, Kraitchman DL. Iron oxide MR contrast agents for molecular and cellular imaging. NMR Biomed. 2004;17:484–499. doi: 10.1002/nbm.924. [DOI] [PubMed] [Google Scholar]
- 2.Lewin M, Carlesso N, Tung CH, Tang XW, Cory D, Scadden DT, Weissleder R. Tat peptide-derivatized magnetic nanoparticles allow in vivo tracking and recovery of progenitor cells. Nat Biotechnol. 2000;18:410–414. doi: 10.1038/74464. [DOI] [PubMed] [Google Scholar]
- 3.Arbab AS, Jordan EK, Wilson LB, Yocum GT, Lewis BK, Frank JA. In vivo trafficking and targeted delivery of magnetically labeled stem cells. Hum Gene Ther. 2004;15:351–360. doi: 10.1089/104303404322959506. [DOI] [PubMed] [Google Scholar]
- 4.Bulte JW, Arbab AS, Douglas T, Frank JA. Preparation of magnetically labeled cells for cell tracking by magnetic resonance imaging. Methods Ezymol. 2004;386:275–299. doi: 10.1016/S0076-6879(04)86013-0. [DOI] [PubMed] [Google Scholar]
- 5.Sykova E, Jendelova P. In vivo tracking of stem cells in brain and spinal cord injury. Prog Brain Res. 2007;161:367–383. doi: 10.1016/S0079-6123(06)61026-1. [DOI] [PubMed] [Google Scholar]
- 6.Anderson SA, Glod J, Arbab AS, Noel M, Ashari P, Fine HA, Frank JA. Noninvasive MR imaging of magnetically labeled stem cells to directly identify neovasculature in a glioma model. Blood. 2005;105:420–425. doi: 10.1182/blood-2004-06-2222. [DOI] [PubMed] [Google Scholar]
- 7.Wu X, Hu J, Zhou L, Mao Y, Yang B, Gao L, Xie R, Xu F, Zhang D, Liu J, Zhu J. In vivo tracking of superparamagnetic iron oxide nanoparticle-labeled mesenchymal stem cell tropism to malignant gliomas using magnetic resonance imaging. J Neurosurg. 2008;108:320–329. doi: 10.3171/JNS/2008/108/2/0320. [DOI] [PubMed] [Google Scholar]
- 8.Cunningham CH, Arai T, Yang PC, McConnell MV, Pauly JM, Conolly SM. Positive contrast magnetic resonance imaging of cells labeled with magnetic nanoparticles. Magn Reson Med. 2005;53:999–1005. doi: 10.1002/mrm.20477. [DOI] [PubMed] [Google Scholar]
- 9.Seppenwoolde JH, Viergever MA, Bakker CJ. Passive tracking exploiting local signal conservation: The white marker phenomenon. Magn Reson Med. 2003;50:784–790. doi: 10.1002/mrm.10574. [DOI] [PubMed] [Google Scholar]
- 10.Mani V, Briley-Saebo KC, Itskovich VV, Samber DD, Fayad ZA. Gradient echo acquisition for superparamagnetic particles with positive contrast (GRASP): Sequence characterization in membrane and glass superparamagnetic iron oxide phantoms at 1.5T and 3T. Magn Reson Med. 2006;55:126–135. doi: 10.1002/mrm.20739. [DOI] [PubMed] [Google Scholar]
- 11.Stuber M, Gilson WD, Schr M, Kedziorek DA, Hofmann LV, Shah S, Vonken EJ, Bulte JW, Kraitchman DL. Positive contrast visualization of iron oxide-labeled stem cells using inversion-recovery with on-resonant water suppression (IRON) Magn Reson Med. 2007;58:1072–1077. doi: 10.1002/mrm.21399. [DOI] [PubMed] [Google Scholar]
- 12.Dharmakumar R, Koktzoglou I, Li D. Generating positive contrast from off-resonant spins with steady-state free precession magnetic resonance imaging: Theory and proof-of-principle experiments. Phys Med Biol. 2006;51:4201–4215. doi: 10.1088/0031-9155/51/17/006. [DOI] [PubMed] [Google Scholar]
- 13.Koktzoglou I, Li D, Dharmakumar R. Dephased FLAPS for improved visualization of susceptibility-shifted passive devices for real-time interventional MRI. Phys Med Biol. 2007;52:N277–N286. doi: 10.1088/0031-9155/52/13/N01. [DOI] [PubMed] [Google Scholar]
- 14.Dharmakumar R, Koktzoglou I, Li D. Factors influencing fast low angle positive contrast steady-state free precession (FLAPS) magnetic resonance imaging. Phys Med Biol. 2007;52:3261–3273. doi: 10.1088/0031-9155/52/11/021. [DOI] [PubMed] [Google Scholar]
- 15.Meyer CH, Pauly JM, Macovski A, Nishimura DG. Simultaneous spatial and spectral selective excitation. Magn Reson Med. 1990;15:287–304. doi: 10.1002/mrm.1910150211. [DOI] [PubMed] [Google Scholar]
- 16.Lim KO, Pauly J, Webb P, Hurd R, Macovski AJ. Short TE phosphorus spectroscopy using a spin-echo pulse. Magn Reson Med. 1994;32:98–103. doi: 10.1002/mrm.1910320113. [DOI] [PubMed] [Google Scholar]
- 17.Pauly J, Le Roux P, Nishimura D, Macovski A. Parameter relations for the Shinnar-Le Roux selective excitation pulse design algorithm. IEEE Trans Med Imaging. 1991;10:53–65. doi: 10.1109/42.75611. [DOI] [PubMed] [Google Scholar]
- 18.Pauly J, Adalsteinsson E, Lim K, Kerr A, Macovski A. Applications of spin-echo pulse pairs; Proceedings of the 2nd Annual Meeting of SMR; San Francisco. 1994. p. 1135. [Google Scholar]
- 19.Pauly J, Macovski A. Designing spin echoes; Proceedings of the SMRM, 11th Annual Meeting; Berlin. 1992. p. 3902. [Google Scholar]
- 20.Lim JS, Oppenheim AV. Advanced topics in signal processing. 1st ed. Englewood Cliffs, NJ: Prentice Hall; 1988. [Google Scholar]
- 21.Arbab AS, Yocum GT, Kalish H, Jordan EK, Anderson SA, Khakoo AY, Read EJ, Frank JA. Efficient magnetic cell labeling with protamine sulfate complexed to ferumoxides for cellular MRI. Blood. 2004;104:1217–1223. doi: 10.1182/blood-2004-02-0655. [DOI] [PubMed] [Google Scholar]
- 22.Suzuki Y, Zhang S, Kundu P, Yeung AC, Robbins RC, Yang PC. In vitro comparison of the biological effects of three transfection methods for magnetically labeling mouse embryonic stem cells with ferumoxides. Magn Reson Med. 2007;57:1173–1179. doi: 10.1002/mrm.21219. [DOI] [PubMed] [Google Scholar]
- 23.Gudbjartsson H, Patz S. The rician distribution of noisy MRI data. Magn Reson Med. 1995;34:910–914. doi: 10.1002/mrm.1910340618. [DOI] [PMC free article] [PubMed] [Google Scholar]
- 24.Henkelman RM. Measurement of signal intensities in the presence of noise in MR images. Med Phys. 1985;12:232–233. doi: 10.1118/1.595711. [DOI] [PubMed] [Google Scholar]


