Abstract
The concentric rings two-dimensional (2D) k-space trajectory enables flexible trade-offs between image contrast, signal-to-noise ratio (SNR), spatial resolution, and scan time. However, to realize these benefits for in vivo imaging applications, a robust method is desired to deal with fat signal in the acquired data. Multipoint Dixon techniques have been shown to achieve uniform fat suppression with high SNR-efficiency for Cartesian imaging, but application of these methods for non-Cartesian imaging is complicated by the fact that fat off-resonance creates significant blurring artifacts in the reconstruction. In this work, two fat/water separation algorithms are developed for the concentric rings. A retracing design is used to sample rings near the center of k-space through multiple revolutions to characterize the fat/water phase evolution difference at multiple time points. This acquisition design is first used for multipoint Dixon reconstruction, and then extended to a spectroscopic approach to account for the trajectory’s full evolution through three-dimensional (3D) k-t space. As the trajectory is resolved in time, off-resonance effects cause shifts in frequency instead of spatial blurring in 2D k-space. The spectral information can be used to assess field variation and perform robust fat/water separation. In vivo experimental results demonstrate the effectiveness of both algorithms.
Keywords: concentric rings, off-resonance correction, water-fat decomposition, fat suppression, spectroscopy
INTRODUCTION
The concentric rings 2D k-space trajectory samples a polar grid with a set of circular readouts, enabling flexible trade-offs between image contrast, signal-to-noise ratio (SNR), spatial resolution, and scan time (1–5). Balance between spatial resolution and scan time allows the rings to be tailored for efficient dynamic imaging (2). The rings are also inherently centric-ordered in two dimensions, thus being a very effective readout trajectory for magnetization-prepared imaging (5). To fully realize these benefits for in vivo imaging applications, we must have a robust way of dealing with the signal from fat, which can adversely affect image contrast and presents a dominant source of off-resonance artifacts in non-Cartesian imaging.
Popular approaches for suppressing fat signal include applying short-tau inversion-recovery (STIR) prep-pulses, fat-saturation prep-pulses, or spectral-spatial excitation pulses. These methods can suppress fat effectively under ideal conditions, but are sensitive to variations in the B0 and B1 fields. Another disadvantage of these methods is the additional scan-time overhead required for the preparation pulses, which reduces the overall SNR time-efficiency. Instead of suppressing fat, it is also possible to resolve its signal, decomposing the reconstruction into a separate fat image and water image. Besides providing uniform fat suppression, this approach also produces extra information about the relative fat/water composition in each voxel.
Fat-water separation is an important special case of chemical shift imaging (CSI). A general spectroscopic imaging approach is certainly possible, but can become very time-consuming for the desired spatial coverage and resolution. Many methods that take advantage of the prior information have been developed over the past two decades to exclusively deal with fat/water imaging, starting with Dixon’s original proposal of a simple two-point method (6). To improve the robustness of Dixon’s method, Glover et al. presented a three-point algorithm (7, 8) to address field inhomogeneity. Recently, formulations based on least-squares estimation have been presented to accommodate an arbitrary number of time points and arbitrary echo times. Reeder et al. (9–12) proposed an iterative decomposition of water and fat with echo asymmetry and least-squares estimation (IDEAL) algorithm to solve the general nonlinear problem through linearization and iteration. Hernando et al. (13) drew upon the variable projection (VARPRO) algorithm to solve the nonlinear estimation by using a separable formulation and one-dimensional search over field variation. These multi-point fat/water separation techniques are quite effective at separating fat/water signal, but a disadvantage is the doubling or tripling of scan time. Therefore, SNR-efficient acquisition and processing are required to warrant the extra scan time (7–10). There has also been interest in using multi-echo sequences to reduce the total scan time required for acquiring the multiple time points (14–16). Multi-echo acquisitions can also improve the spatial registration of the acquired images.
For non-Cartesian trajectories, fat-water separation is complicated by the fact that off-resonance due to field inhomogeneity and chemical shift both cause blurring artifacts in the reconstruction. Moriguchi et al. (17) presented 2-point and 3-point Dixon techniques based on spiral acquisitions, incorporating multi-frequency reconstruction for off-resonance correction (ORC). However, they discussed but did not support arbitrary echo times. More recently, the least-squares formulation has been applied to fat-water imaging with non-Cartesian trajectories to accommodate an arbitrary number of time points and arbitrary echo times. Gurney (18) proposed an algorithm for 3D cones trajectories that combined off-resonance correction with the least-squares estimation problem, with a one-dimensional search over field variation. Brodsky et al. (19) modified the IDEAL algorithm to demodulate the off-resonant phase caused by chemical shift and perform fat-water separation in k-space. They also discussed the possibility of using multi-frequency reconstruction to correct for field-induced blurring. These methods have demonstrated that it is possible to perform robust multipoint fat-water separation with non-Cartesian trajectories, provided the blurring artifacts are properly accounted for.
In this paper, we develop two approaches to fat/water imaging with the concentric rings trajectory. Both approaches are based on the same retracing concept we had previously investigated for off-resonance correction (5). After each excitation, a selected set of inner rings may be traced more than once to produce datasets at different effective echo times, which is much in the spirit of a multi-echo acquisition. The first approach follows the multi-point Dixon paradigm, where multiple images acquired at appropriate time points are used to characterize the fat/water phase difference. Using the same retracing design, we present a second approach which follows the concentric rings trajectory through 3D (kx, ky, t)-space. By explicitly reconstructing the rings in 3D space, spatial blurring due to off-resonance becomes a shift along the frequency dimension. This unblurred spectral information allows us to perform robust fat/water separation in the presence of field inhomogeneity. We present in vivo results to show the performance of both approaches.
METHODS
Concentric Rings with Retracing
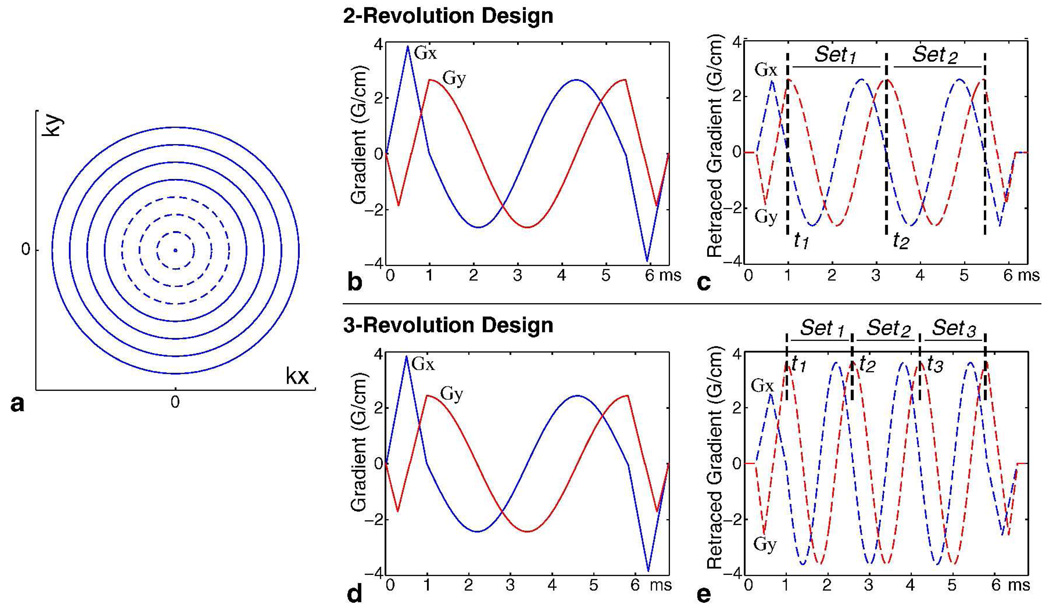
A set of N uniformly spaced concentric rings is used to sample 2D k-space (Fig. 1a). Gradients are designed for the outermost ring and then scaled down accordingly to acquire each ring (Fig. 1b). This results in a sampling density that resembles 2D projection-reconstruction (2DPR). For the inner rings n = 0 … (N/2)-1 (dashed lines, Fig. 1a), we can be more efficient with gradient power and retrace them within the same readout window to collect the full set of samples through two revolutions (Fig. 1c) (5). The set of data points acquired during the first and second revolutions are designated as Set1 and Set2, respectively. Since the inner rings n = 0 … (N/2)-1 are on a twice-oversampled polar grid in (kx, ky), the data points in both Set1 and Set2 can be reconstructed individually to obtain a lower-resolution but full-FOV image. Previously, we used the time difference between these two images to compute a field map for off-resonance correction (ORC) (5).
FIG. 1.
Concentric Rings Retracing Design. A set of N readout rings is used to cover k-space (a). Gradients are designed for the outermost ring (b) and then scaled down for each ring. We can be more gradient-efficient with the inner readout rings n = 0 … (N/2)−1 (dashed lines in (a)) by using a retracing design (c). The inner rings are sampled over two revolutions, corresponding to Set1 and Set2. This retracing design can be extended to three or more revolutions. Specifically, by slightly lengthening the readout window for the single-revolution outer rings (d), the inner rings can be acquired through three revolutions during the same readout window (e) to produce Set1, Set2 and Set3. The “echo time” of each revolution is defined as the time when the first sample is acquired and indicated by tm.
Similar to ORC, fat/water separation methods rely on information characterizing the phase evolution differences at multiple time points, thus the two-revolution acquisition design (Fig. 1c) can be adapted directly for 2-point Dixon reconstruction schemes. To accommodate more time points, we can extend the idea of retracing to three or more revolutions. In particular, by slightly prolonging the readout window for the single-revolution outer rings (Fig. 1d), we can sample the inner rings n = 0 … (N/2)-1 through three revolutions during this readout window (Fig. 1e). The corresponding data subsets Set1, Set2, and Set3 can then be used in a 3-point Dixon reconstruction. The effective “echo time” of each revolution is defined as the time when the first sample is acquired and is indicated by tm (Figs. 1c, 1e).
In this paper, we will consider retracing designs where the time separation, dt = tm − tm−1, between each revolution (time point) is equal. Similar to multi-echo sequences, the selection of phase separation dφ = 2π·Δf·dt rad (Δf is the fat/water frequency shift in Hz) is constrained in this retracing design by many imaging considerations. The readout duration should be as short as possible to reduce T2* modulation and extra phase accrual due to off-resonance, while also achieving the prescribed spatial coverage and resolution. In addition, the resulting dφ between time points should allow effective and SNR-efficient fat/water separation. We designed both a 2-revolution and a 3-revolution design to demonstrate the effectiveness of this acquisition for fat/water separation. For the 2-revolution design (Fig. 1c), Set1 and Set2 are separated by dt = 2.22 ms to achieve dφ = 180° on a 1.5 T system; and for the 3-revolution design (Fig. 1e), each revolution is separated by dt = 1.6 ms to achieve dφ = 128°. The choice of dφ = 180° for the 2-revolution design achieves optimal estimation SNR-efficiency and dφ = 128° for the 3-revolution design is very close to the separation of 120° for optimal SNR-efficiency (9). It is possible to retrace any set of inner rings for the trajectory design, but we chose to retrace the inner half n = 0 … (N/2)-1, as it provides a good balance between achieving the intended spatial coverage and enabling SNR-efficient Dixon reconstruction for two and three revolution acquisitions.
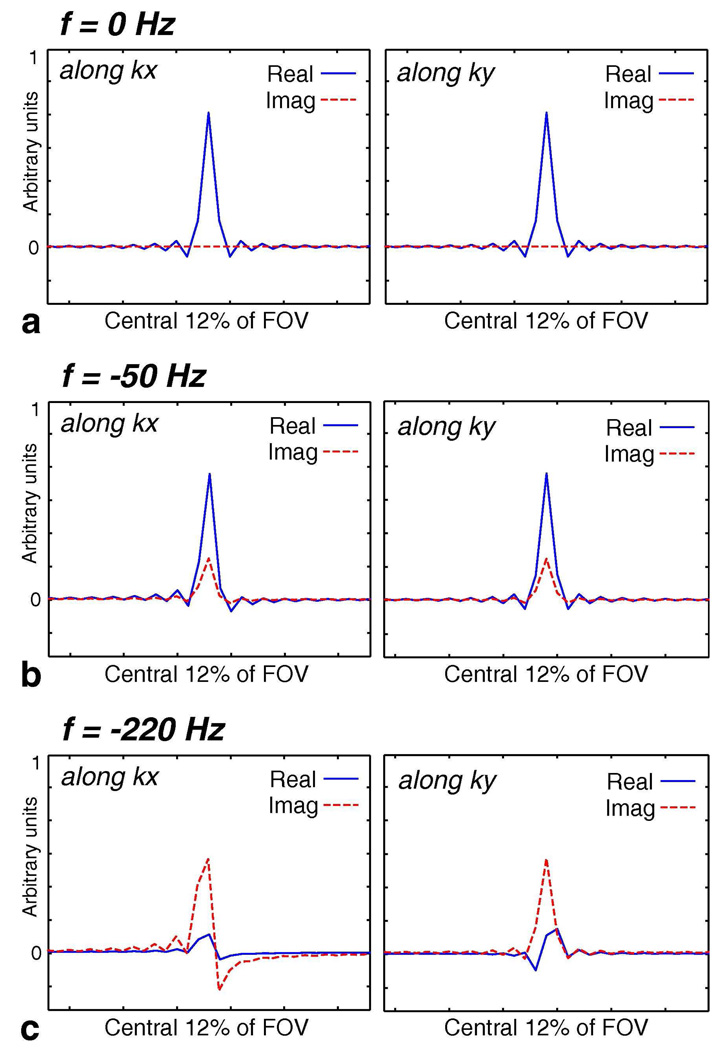
To characterize the effect of off-resonance on concentric rings, we calculated the point spread function (PSF) due to varying degrees of off-resonance (Fig. 2). These PSF calculations are for the case when the temporal evolution of the acquisition is not resolved and the data is reconstructed as a 2D spatial image at a single effective time point (e.g., conventional Dixon-type methods). A set of 64 single-revolution rings with a readout window of 2 ms were used for the calculations, which is representative of the designs we used for our experiments (Fig. 1). When there is no off-resonant phase in the acquired data (Fig. 2a), the PSF resides entirely in the real part and consists of a main lobe of 1 pixel full-width at half-maximum (FWHM) along with smaller symmetric side lobes. At a mild off-resonant frequency of −50 Hz (on the order of field variation) (Fig. 2b), the PSF contains a slightly broader main lobe (still around 1 pixel FWHM), some non-zero imaginary component due to the asymmetry of the phase modulation in k-space, and mild asymmetry in the side lobes due to the complex nature of the phase modulation. The PSF is still relatively circularly symmetric. With an off-resonant frequency of −220 Hz (fat at 1.5 T) (Fig. 2c), the PSF significantly deviates from the 0 Hz case and is no longer circularly symmetric. Two opposing lobes are observed in the imaginary part along kx and in the real part along ky. Each of the two lobes is about 2 pixels FWHM and creates a splitting or swirling effect (what we called “fringe” patterns in the simulations shown in (5)). These calculations show that while lesser degrees of off-resonance due to field inhomogeneity can be tolerated without correction, the effects caused by greater degrees of off-resonance (chemical shift of fat) must be accounted for in the reconstruction. An effective way to remove the extra phase accrual due to off-resonance is to demodulate the acquired raw data at the appropriate frequency before further processing.
FIG. 2.
Point Spread Functions (PSF) for Varying Degrees of Off-Resonance. The PSFs for concentric rings have been calculated for the cases of zero, mild (−50 Hz), and greater (−220 Hz) off-resonance. Radial cuts of the PSFs along kx and ky are plotted in this figure for the central 12% of the FOV. All curves have the same scale. When f = 0 Hz (a), the PSF resides entirely in the real part and consists of a main lobe of 1 pixel full-width at half-maximum (FWHM) along with smaller symmetric side lobes. At f = −50 Hz (b), the PSF contains a slightly broader main lobe (still around 1 pixel FWHM), some non-zero imaginary component due to the asymmetry of the phase modulation in k-space, and mild asymmetry in the side lobes due to the complex nature of the phase modulation. Overall, the PSF is still relatively circularly symmetric. With an off-resonant frequency of f = −220 Hz (fat at 1.5 T) (c), the PSF significantly deviates from the f = 0 Hz case and is no longer circularly symmetric. Two opposing lobes are seen in the imaginary part along kx and in the real part along ky. Each of the two lobes is about 2 pixels FWHM and creates a splitting or swirling effect.
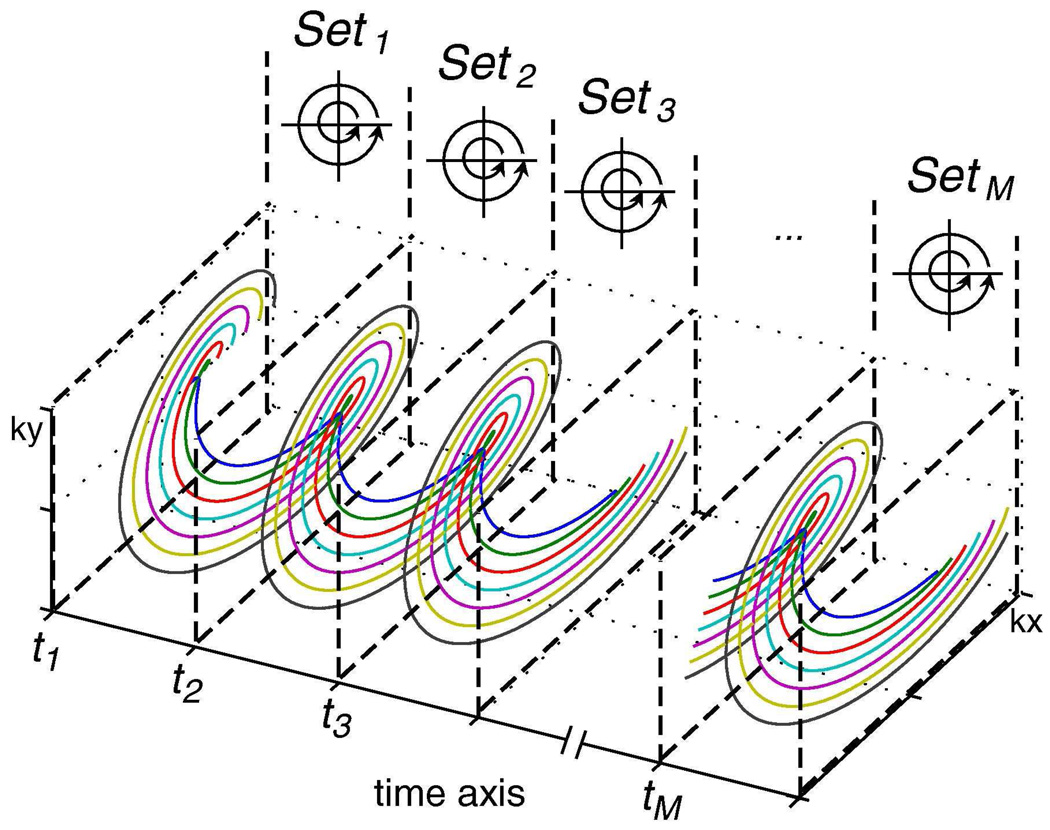
In addition to Dixon-based parametric reconstructions, the concentric rings retracing design can also be analyzed within a more general spectroscopic framework to perform chemical shift imaging. By following the trajectory through time and space, we see that each retraced ring is actually sampled both continuously in time and in a circularly symmetric fashion in k-space (Fig. 3). The 2D datasets (Set1, Set2, Set3, …SetM) for multipoint Dixon methods are formed by taking data points that fully sample a circle in 2D k-space (thick dashed lines, Figs. 1c, 1e, and Fig. 3) and collapsing the time axis into one effective time point (t1, t2, t3, … tM) for each revolution. By removing this artificial distinction of discrete echo times, we develop a spectroscopic approach which follows the rings’ multiple revolutions through full 3D (kx, ky, t)-space to resolve off-resonance effects and provide robust fat/water separation.
FIG. 3.
Rectraced Concentric Rings in 3D (kx, ky, t)-Space. A key to understanding the concentric rings is to consider its full evolution through 3D (kx, ky, t)-space. The general case of retracing M times is shown here. Thick dashed lines define the planes that set boundaries for Set1, Set2, Set3 …SetM in time and arrows indicate the location of the last sample of each dataset in 2D (kx, ky)-space. By removing the artificial distinction of discrete measurement times, we can resolve off-resonance effects as a shift in frequency and use the spectral information to perform fat/water separation.
Dixon-based Approach
Assuming a water/fat two-peak model and ignoring T2* decay, the MR signal in each voxel can be expressed as:
| [1] |
where sm are M complex measurements at arbitrary time points tm, W is the complex water component, F is the complex fat component, Δfis the fat/water frequency shift in Hz (−3.5 ppm, or roughly −223 Hz at 1.5 T), and ψ is the local field inhomogeneity in Hz. For the retraced concentric rings, each sm corresponds to the Fourier transform of Setm. To estimate the complex variable W, complex variable F, and the scalar variable ψ, we would need at least 5 equations. This can be satisfied with M = 3 complex measurements, which gives us 6 equations.
For non-Cartesian k-space readout trajectories, off-resonance effects create blurring in the reconstructed image (Fig. 2), thus we should reconstruct sm at the appropriate demodulation frequency cf before estimating F and W (Eq. [2]) (18):
| [2] |
Let us first assume the field inhomogeneity ψ is zero or known, so that we can remove the phase factor due to ψ (Eq. [3] below). We will deal with ψ based on this linearization, using an iterative solution (9).
| [3] |
Collecting M = 3 instances of Eq. [3] into matrix form, we have:
| [4] |
At water resonance cf = 0, Eq. [4] becomes:
and we can calculate an un-blurred estimate Ŵ0 of the water component. Similarly, by tuning cf to fat resonance Δf, Eq. [4] becomes:
from which we can obtain an un-blurred estimate F̂Δf for the fat component.
Incorporating prior information on the covariance of s, the weighted least-squares estimate ρ̂ is expressed in Eq. [5]. (Without loss of generality and for simplicity of notation in the following equations, we will drop the subscripts denoting cf.) The weighting matrix V is the inverse of the input covariance matrix Σs and the superscript H denotes the conjugate transpose.
| [5] |
The covariance matrix of the estimate ρ̂ is then:
| [6] |
where the diagonal entries Σ ρ̂ are the variances of the water estimate Ŵ and fat estimate F̂. For our acquisitions, the measurements are uncorrelated and have identical noise variance, thus V is the identity matrix and Eq. [5] and Eq. [6] simplify to ordinary least-squares (9).
Spectroscopic Approach
As illustrated in Fig. 3, the concentric rings trajectory evolves not just through 2D (kx, ky)-space, but through the full 3D (kx, ky, t)-space. By explicitly reconstructing the acquired dataset in 3D k-t space, we obtain a set of 2D images along the frequency dimension and off-resonance effects now cause a shift in frequency instead of 2D spatial blurring. The retraced concentric rings trajectory samples each spatial frequency component uniformly in time, thus fitting naturally into such a spectroscopic approach that explicitly resolves temporal evolution.
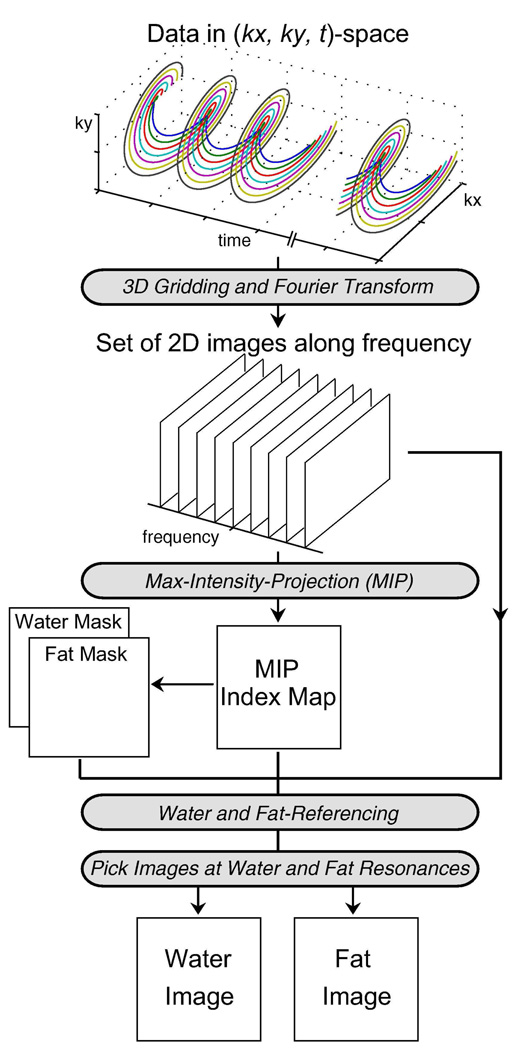
In this work, we present a water and fat-referencing algorithm that utilizes this spectral information to produce calibrated water and fat images (Fig. 4). The idea is similar to using the water peak as a reference for assessing the frequency shift and signal phase in MR spectroscopy (20). First, the dataset is gridded in 3D (kx, ky, t)-space and Fourier-transformed along all three axes to produce a set of 2D spatial images along frequency. Maximum-intensity projection (MIP) is then performed along the frequency dimension to obtain an index map that identifies the dominant frequency component in each voxel. Assuming that field variation is less than the chemical shift, voxels that have their dominant frequency less than -|Δf|/2 are classified as a fat-dominant voxel and this information is recorded in a “fat mask.” Similarly, voxels that have their dominant frequency greater than -|Δf|/2 are classified as a water-dominant voxel and recorded in a “water mask.” Using the MIP index map and these masks, the spectrum in each fat-dominant voxel is shifted by the appropriate amount to put the fat peak back at Δf (fat-referencing) and the spectrum in each water-dominant voxel is shifted to put the water peak back at 0 Hz (water-referencing). After performing water and fat-referencing, the signal component at water center frequency (0 Hz chemical shift) from each voxel forms the calibrated 2D water image, and the signal component at fat center frequency (Δf Hz chemical shift) from each voxel becomes the calibrated 2D fat image. Since this 3D reconstruction is conventional Fourier-transform analysis, the SNR of each image along the frequency dimension is identical and is directly related to the number of data points in the acquired dataset.
FIG. 4.
Reconstruction Algorithm for the Spectroscopic Approach. The data acquired with concentric rings is gridded in 3D (kx, ky, t)-space, and then Fourier-transformed to generate a set of 2D images along frequency. Maximum-intensity projection (MIP) is performed along frequency, producing an index map that identifies the maximum frequency component in each voxel. Voxels that have their dominant peak at less than -|Δf|/2 are recorded in a “fat mask,” while voxels that have their dominant peak greater than -|Δf|/2 are recorded in a “water mask.” Using the MIP index map and the water and fat masks, the spectrum in each voxel is shifted appropriately to put the water peak at 0 Hz (water-referencing) and the fat peak at Δf (fat-referencing). After performing water and fat-referencing, the 2D images at water and fat resonances are presented as the calibrated water and fat images.
RESULTS
Experiments were conducted on a GE Signa 1.5 T Excite system with maximum gradient amplitude of 40 mT/m and maximum slew rate of 150 mT/m/ms. A quadrature extremity receive coil was used. The readout filter bandwidth was +/−125 kHz for all experiments. We acquired sagittal knee images of normal volunteers using a spoiled gradient-recalled echo (GRE) sequence with TE/TR/θ = 2.3 ms/60 ms/40° and 10 dummy cycles to establish steady-state. Slice thickness was 4 mm. 128 readout rings with the central 64 retraced (two or three revolutions) were used to cover a 16-cm FOV, achieving isotropic in-plane resolution of 0.63 mm (256 × 256 matrix). Two signal averages were taken, resulting in a total scan time of 16 seconds. TE is defined as the time between the peak of the RF excitation and the first readout sample. Written consent was obtained prior to scanning all subjects.
Dixon-based Approach
Two-point Dixon Reconstruction
For this experiment, we used a 2-revolution design with a readout window of 4.44 ms for all rings, which means that each revolution of the central rings was sampled over 2.22 ms and the phase separation of fat was dφ = 180° between the source images s1 and s2.
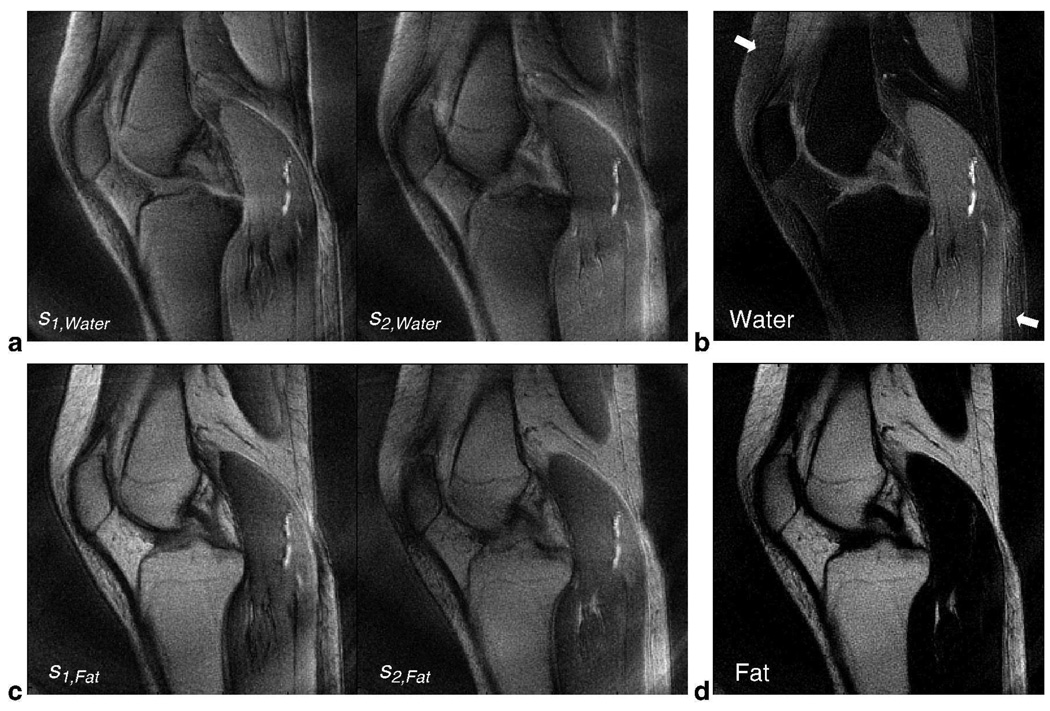
To calculate the water image, the datasets Set1 and Set2 from the retraced central rings were demodulated at the water center frequency and reconstructed to produce s1,Water and s2,Water. The higher-resolution outer rings were incorporated into the estimation problem by demodulating at the water center frequency and adding its reconstruction as common information to the source images. These two source images (Fig. 5a) were then used to obtain a least-squares estimate of the water image (Fig. 5b). Similarly, the acquired data was reconstructed at the fat center frequency to obtain source images (Fig. 5c) and calculate an estimate of the fat image (Fig. 5d). This 2-point Dixon reconstruction assumes a constant field map. The water/fat images in Figs. 5b and 5d have the same windowing level.
FIG. 5.
In Vivo Knee Results using 2-Point Dixon Reconstruction for 2-Revolution Dataset. The datasets Set1 and Set2 of retraced inner rings are reconstructed at water frequency (see text for imaging parameters) to form the source images s1,Water and s2,Water (a). Higher-resolution outer rings (single-revolution) were demodulated at water frequency and added to each source image as common information. Similarly, the acquired data was reconstructed at fat resonance frequency to form source images s1,Fat and s2,Fat (c). The source images in (a) and (c) were then used to calculate a water image (b) and a fat image (d), respectively. In general, good suppression of fat signal is achieved for the water image, but there is still some residual fat signal due to field inhomogeneity (arrows). The water and fat images have the same windowing level.
As seen in Figs. 5a and 5c, water and fat are either in focus or blurred throughout the source images depending on the demodulation frequency. Therefore, it is very important in non-Cartesian imaging to first demodulate at the appropriate center frequency before proceeding with the estimation (Eq. [2]). The calculated water image (Fig. 5b) shows good suppression of fat signal and the off-resonance artifacts caused by it. The fat image (Fig. 5d) shows the distribution of fat signal in focus throughout the FOV, which would have otherwise generated blurring artifacts in a regular reconstruction. However, there is still some residual fat signal in the water image due to field inhomogeneity (arrows, Fig. 5b).
Three-Point Dixon Reconstruction
We conducted another experiment using a 3-revolution design with a slightly extended readout window of 4.8 ms for all rings. Each revolution of the central rings was sampled over 1.6 ms and the phase separation of fat was dφ = 128° between the source images s1, s2, and s3.
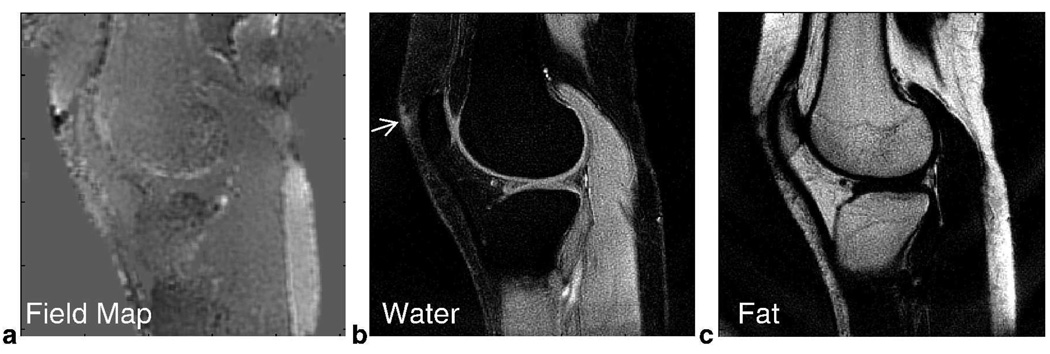
Similar to the 2-point Dixon reconstruction, source images were demodulated at both water and fat resonances before further processing. Here, we estimated the field map by using an iterative solution (Fig. 6a) (9). The field map was calculated at full spatial resolution and filtered with a 5-pixel by 5-pixel box function. This field information allowed us to reconstruct a water image that generally has improved fat suppression in regions experiencing field inhomogeneity (Fig. 6b). However, suppression is not as uniform in the small region next to the patella (thin arrow, Fig. 6b) where there is greater field variation, leading to residual signal. The fat image is shown in Fig. 6c with the same windowing level as the water image (Fig. 6b).
FIG. 6.
In Vivo Knee Results using 3-Point Dixon Iterative Reconstruction for 3-Revolution Dataset. An iterative solution was used to estimate the field distribution (a) and improve fat suppression. This information enabled uniform fat suppression in the water image in the presence of field inhomogeneity (b). However, some non-uniform suppression is seen near the patella (thin arrow). The corresponding fat image is shown in (c). The images in (b) and (c) have the same windowing level.
Spectroscopic Approach
Two-Revolution Dataset
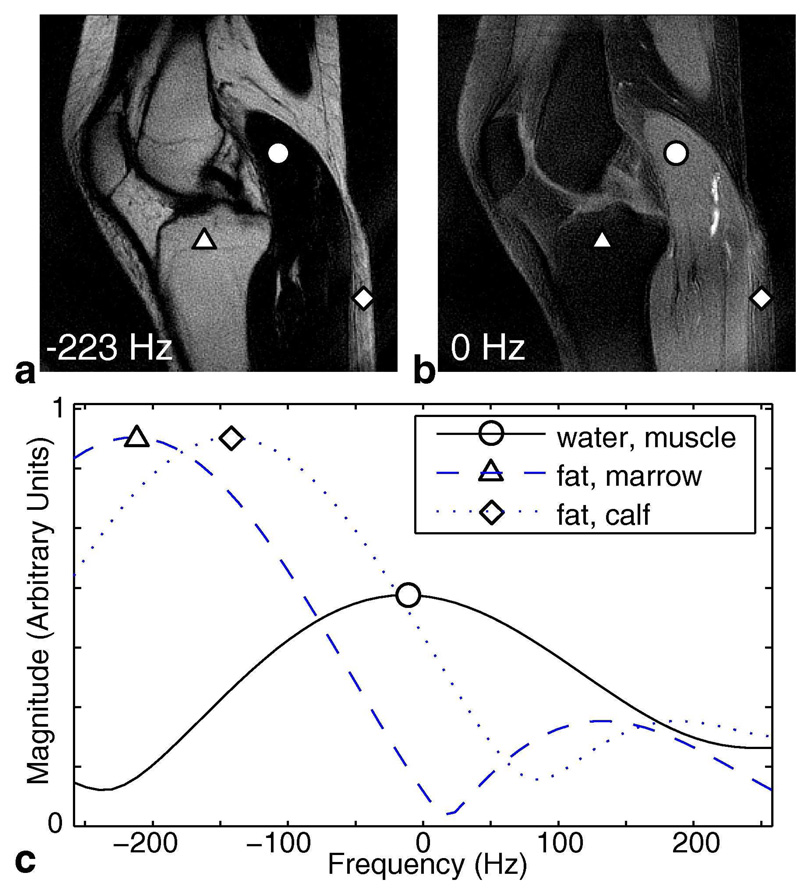
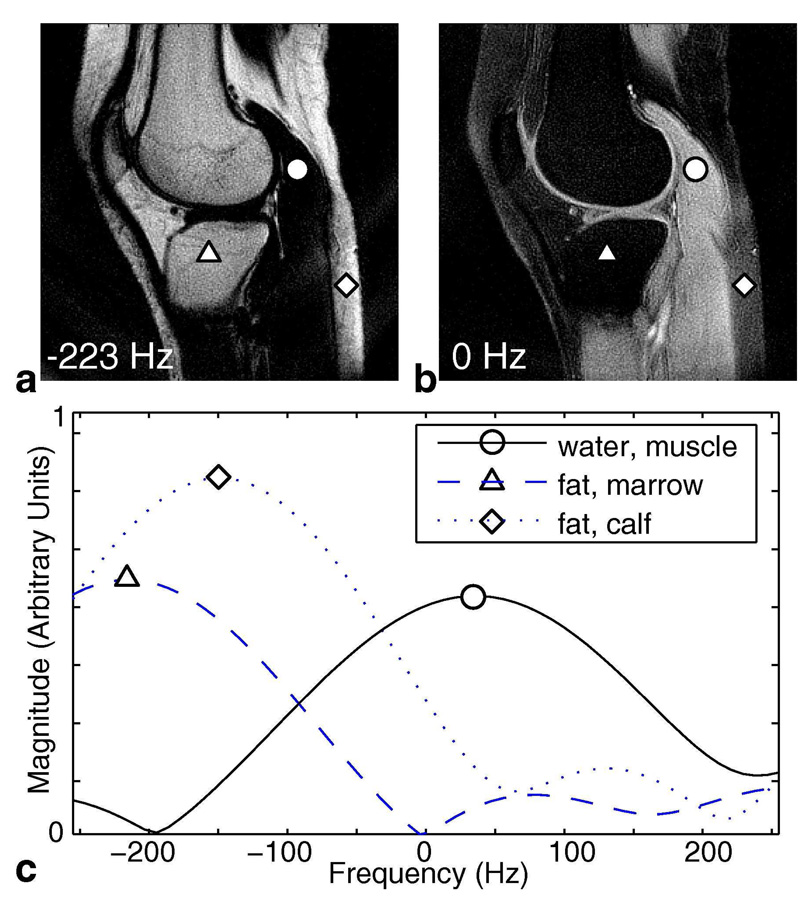
The same 2-revolution knee dataset acquired for the 2-point Dixon experiment was reconstructed using the spectroscopic approach. Both the retraced central rings and the single-revolution outer rings were gridded in 3D (kx, ky, t)-space on a grid of size [kx, ky, t] = [256, 256, 16] points. This gridded dataset was zero-padded to [256, 256, 384] points and then Fourier-transformed to obtain a set of 2D images in frequency. This choice of grid size and zero-padding allowed us to reconstruct the spectral bandwidth and resolution supported by the trajectory within a reasonable computational time. Data in the range of +/−250 Hz was then extracted for further processing. Figure 7a shows a 2D image close to fat-resonance Δf and Fig. 7b shows the 2D image at 0 Hz chemical shift (closely resembling the water and fat images calculated by 2-point Dixon (Figs. 5b and 5d)). Figures 7a and 7b have the same windowing level. Now that we are resolving along frequency, we can look at the spectrum of each individual voxel. Although the spectral bandwidth and resolution supported by this particular 2-revolution trajectory is limited at +/−225 Hz nominal spectral bandwidth and 2 points in f, the reconstructed spectrum still gives us valuable information to perform water/fat separation. Figure 7c plots the obtained spectrum at three voxels of interest over the range of +/−250 Hz with an interpolated spectral resolution of 9.4 Hz / point (48 points over +/−225Hz). A representative water voxel (indicated by a circle) has peak amplitude near 0 Hz while a typical fat voxel (triangle) peaks close to Δf, as expected. However, we observe that a fat voxel experiencing local field variation (diamond) has its peak shifted towards water resonance, contributing significant signal at 0 Hz. This results in noticeable fat signal remaining in the 0 Hz image posterior to the calf (diamond, Fig. 7b).
FIG. 7.
Resolving in Frequency for 2-Revolution Dataset. Explicitly reconstructing in 3D k-t space generates a set of 2D images along frequency. Image (a) is the 2D image at −223 Hz (fat resonance) and image (b) is the 2D image at 0 Hz (water resonance). These two images have the same windowing level, and they closely resemble the Dixon fat and water images (Figs. 5b, 5d). Spectra of three representative voxels are plotted in (c) over the range of +/−250 Hz. A typical water voxel (circle) has its peak near 0 Hz and a typical fat voxel (triangle) peaks close to −223 Hz. However, when there is local field-variation in a fat-dominant voxel (diamond), the spectrum is shifted and contributes noticeable signal at water frequency.
Before proceeding with fat/water separation, it is interesting to look at the image formed by taking the sum-of-magnitudes along frequency for each voxel (Fig. 8a). This composite image can be an alternative to the multi-frequency reconstruction algorithm we presented previously for off-resonance correction (5).
FIG. 8.
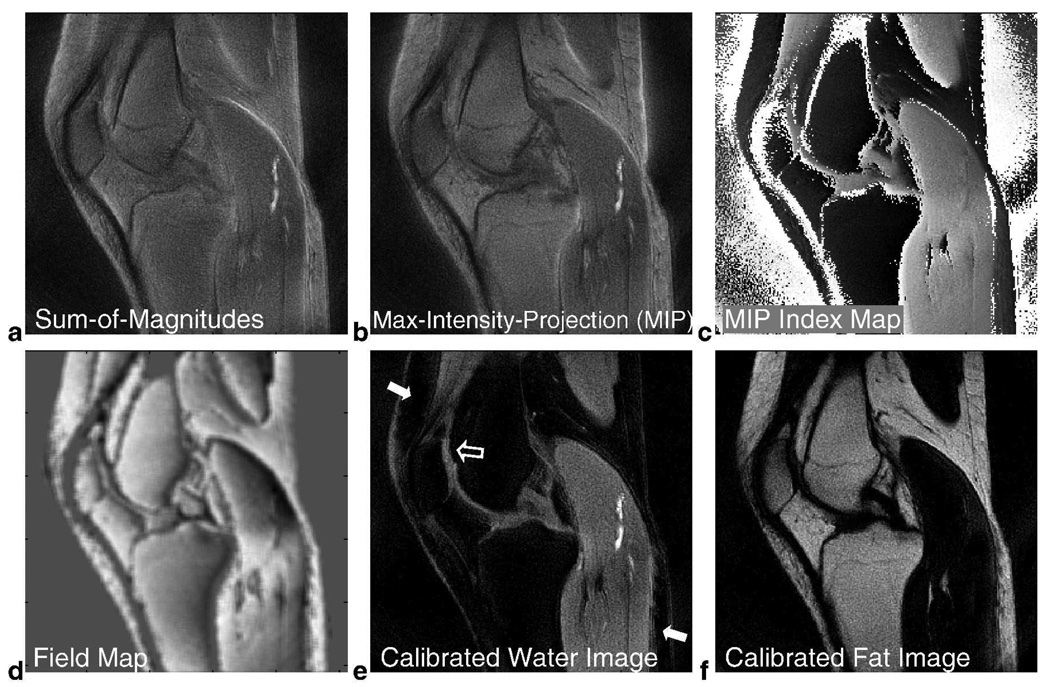
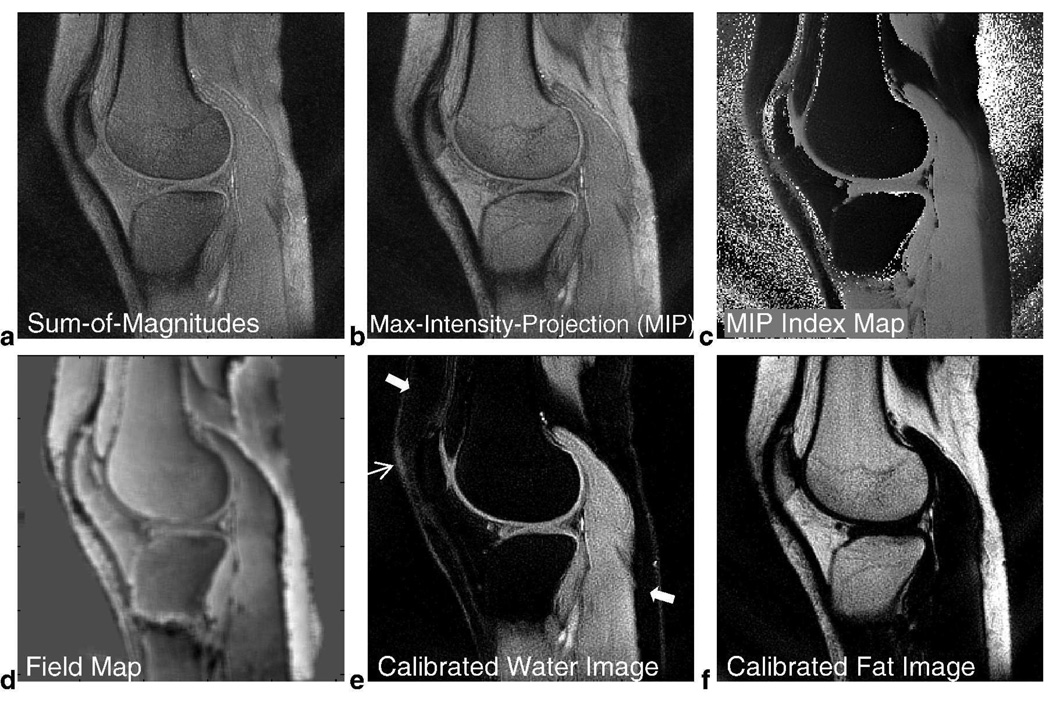
In Vivo Knee Results using Spectroscopic Approach for 2-Revolution Dataset. The set of 2D images along frequency obtained by 3D gridding reconstruction provides valuable information. Since off-resonance effects now manifest as shifts along frequency, a sum-of-magnitudes image along frequency (a) produces a composite image over this range of chemical shift frequencies. We can also take the maximum-intensity projection (MIP) along frequency to produce another meaningful composite image (b) and its corresponding index map (c) that identifies the maximum frequency component of each voxel. This index map is processed to obtain a field map (d) which keeps track of the amount of shift in the fat peak for fat-dominant voxels and the amount of shift in the water peak for water-dominant voxels. After performing water and fat-referencing for the set of 2D images, the 0 Hz image becomes a calibrated water image (e) and the image at Δf becomes a calibrated fat image (f). Residual fat signal previously seen in the 0 Hz image (Fig. 7b) is now suppressed (arrows) and visualization of the cartilage is enhanced (hollow arrow). The calibrated water and fat images have the same windowing level as Figs. 5b and 5d.
To compensate for field inhomogeneity, we used a water and fat-referencing algorithm (Fig. 4). Maximum-intensity-projection (MIP) was performed along the frequency dimension (Fig. 8b) and a MIP index map was created (Fig. 8c). The MIP image itself may be another meaningful composite image, and the index map gives the dominant frequency component in each voxel. From this index map, we identified the fat-dominant voxels and water-dominant voxels, and then calculated a field map based on the shift in their peak frequency components (Fig. 8d). Mild filtering of the field map was performed using a 5-pixel by 5-pixel box function. After shifting the spectrum in each voxel accordingly to compensate for field inhomogeneity, we selected the 2D image at 0 Hz to be the calibrated water image (Fig. 8e). Compared to the Dixon water image (Fig. 5b), residual fat signal in the superior anterior and inferior posterior aspects of the knee are now greatly suppressed (solid arrows, Fig. 8e) and visualization of cartilage is enhanced (hollow arrow, Fig. 8e). The calibrated fat image is also shown in Fig. 8f using the same windowing level as Fig. 8e.
Three-Revolution Dataset
Again, the same three-revolution dataset acquired for 3-point Dixon reconstruction was reconstructed using the spectroscopic approach. This trajectory supported a nominal spectral bandwidth of +/−312.5 Hz and resolution of 3 points in f. Gridding reconstruction parameters were the same as those used for the two-revolution dataset. The spectral information obtained by 3D reconstruction is shown in Fig. 9. A 2D image near the fat resonance is displayed in Fig. 9a and the 2D image at 0 Hz is shown in Fig. 9b. Spectra from three representative voxels are plotted in Fig. 9c over the range of +/−250 Hz with an interpolated spectral resolution of 8.5 Hz / point (74 points over +/−312.5Hz).
FIG. 9.
Resolving in Frequency for 3-Revolution Dataset. Explicitly reconstructing in 3D k-t space generates a set of 2D images along frequency. Plot (a) shows an image at −223 Hz (fat resonance) and plot (b) shows an image at 0 Hz (water resonance). These two images have the same windowing level. Spectra of three representative voxels are plotted in (c) over the range of +/−250 Hz. A typical water voxel (circle) has its peak signal near 0 Hz and a typical fat voxel (triangle) peaks close to −223 Hz. However, when there is local field-variation in a fat-dominant voxel (diamond), the spectrum is shifted and contributes noticeable signal at water frequency.
Figure 10 shows the reconstruction results obtained with this spectral information. A sum-of-magnitudes composite image is displayed in Fig. 10a and the MIP image is shown in Fig. 10b. The MIP index map (Fig. 10c) was processed to obtain a field map (Fig. 10d). Mild filtering of the field map (Fig. 10d) was also performed using a 5-pixel by 5-pixel box function. The field map in Fig. 10d captures the same general trend as the field map estimated with iterative 3-point Dixon (Fig. 6a). For example, both show a large positive shift at the inferior posterior aspect of the knee and negative shift in the superior posterior and inferior anterior regions. However, there are visible differences in these two calculated field maps. Figure 10d is much smoother and delineates the structures more clearly, while Fig. 6a exhibits more graininess. This is due to differences in the nature of the MIP-based referencing algorithm and the iterative Dixon algorithm. It is possible to obtain a smoother field map from the Dixon-based reconstruction by incorporating additional processing (12).
FIG. 10.
In Vivo Knee Results using Spectroscopic Approach for 3-Revolution Dataset. A sum-of-magnitudes image along frequency (a) produces a composite image over this range of chemical shift frequencies. We can also take the maximum-intensity projection (MIP) along frequency to produce another meaningful composite image (b) and its corresponding index map (c) that identifies the maximum frequency component of each voxel. The field map (d) obtained from the index map closely resembles the field map calculated using iterative 3-point Dixon (Fig. 6a). After accounting for the shift in water and fat peaks, the calibrated water image (e) exhibits good fat suppression throughout the FOV (thick arrows) and has more uniform performance near the patella (thin arrow) than iterative 3-point Dixon (Fig. 6b). The calibrated fat image is also shown in (f). The images in (e) and (f) have the same windowing level as Figs. 6b and 6c.
After performing water and fat-referencing, the calibrated water image exhibits good fat suppression (thick arrows, Fig. 10e). Furthermore, the region close to the patella (thin arrow, Fig. 10e) has more uniform fat suppression than the 3-point Dixon reconstruction (thin arrow, Fig. 6b), eliminating the structure-like residual fat signal. It may be possible to improve the uniformity of fat suppression near the patella for iterative 3-point Dixon by more processing of the field map (12). The calibrated fat image obtained from this dataset is shown in Fig. 10f using the same windowing level as Fig. 10e.
DISCUSSION
The concentric rings trajectory has a unique circular symmetry in 2D k-space that easily enables retracing of the inner rings to obtain fat/water phase information at multiple time points without extra excitations. Previously, this retracing acquisition format was used for off-resonance correction (5), and in this work the processing has been extended to enable fat/water separation. In this design, only the inner rings are retraced to provide the multiple time points. However, the “lower” spatial frequencies covered by the inner rings achieve a relatively high 1.2 mm isotropic in-plane resolution and since most of the fat/water contrast is contained in the low spatial frequencies, we are able to achieve effective fat separation. No misclassification of high-frequency features in either the fat or water images due to this limited retracing was observed in our experimental results. We did not correct for the remaining off-resonance blurring in the Dixon reconstructions due to field variation, as it did not result in visible artifacts. The remaining field variation is typically on the order of a few tens of Hz and results in sub-pixel blurring (Fig. 2b). It is certainly possible to combine multifrequency reconstruction with iterative Dixon reconstruction (18).
The same retracing design was also used to develop a spectroscopic approach, which accounted for the rings’ full evolution through 3D (kx, ky, t)-space. Since the concentric rings do not have a strictly-defined echo time (as 2DFT does), this 3D perspective provides the key to fully appreciating the concentric rings trajectory. When the rings trajectory is reconstructed as a 2D k-space acquisition, the time axis is collapsed and off-resonance effects (field inhomogeneity, chemical shift) manifest as blurring in image space (PSF in Fig. 2). By reconstructing the same dataset explicitly in 3D space, these off-resonance effects become shifts along the frequency dimension and we can obtain images free of spatial blurring. We would like to note that such a spectroscopic approach could also be applied to many other readout trajectories, since it is just Fourier-transform analysis. In the case of bipolar multi-echo Cartesian trajectories, appropriate density compensation is needed to account for variation in the temporal sampling of each spatial frequency component. By using a spectroscopic reconstruction for bipolar multi-echo Cartesian readouts, it may be possible to account for even/odd echo phase discrepancies and chemical-shift misregistration in one step. Further investigation of this topic is required to analyze the benefits.
The water and fat-referencing algorithm proposed in this work is one way to use the spectral information for fat/water separation. Since the spectrum at each voxel is simply shifted in frequency to correct for the offset caused by field inhomogeneity, this algorithm does not cause partial volume effects. However, the current algorithm does assume that the off-resonance due to field inhomogeneity is less than the chemical shift. This may become invalid at tissue boundaries and air-tissue interfaces. In that case, we could modify the algorithm (and even the acquisition) to consider a more complete model of the spectrum. For example, the acquisition could be extended to characterize the multiple peaks of the fat spectrum (21) and use this full set of peaks as a more robust signature for classifying fat-dominant voxels.
Experimental results demonstrate that the Dixon-based approach and the spectroscopic approach can both achieve effective and uniform fat suppression. The Dixon-based approach is more computationally efficient, while the spectroscopic approach provides a more general reconstruction framework for the retracing design. By utilizing all of the information in 3D k-t space, the spectroscopic approach is able to provide effective fat suppression even in cases of limited spectral coverage (i.e., two-revolutions, Fig. 8e). With our implementation in MATLAB (The MathWorks, Inc., Natick, MA, USA), the Dixon-based approach took about 4 seconds for each image slice, while the spectroscopic approach took around one minute for each slice due to 3D gridding and 3D Fourier-transform operations. The computational time required for the spectroscopic approach is longer but still quite reasonable, and these computing times will definitely improve as the implementation is optimized and computing power increases. However, this does indicate that it may be favorable to use the Dixon-based approach for applications that demand near-real-time reconstruction. With these respective advantages in mind, both techniques should be able to handle a wide variety of imaging applications, as they can both be extended to accommodate modifications of the acquisition design itself.
There are many possible improvements to the proposed algorithms. For example, when performing signal averaging, we can shift the TE for each repeated acquisition to provide more time points for the Dixon technique and better coverage of (kx, ky, t)-space for full 3D reconstruction. More sophisticated field map processing schemes such as region-growing and probability constraints in image space can be incorporated into the iterative Dixon-based reconstruction, and also into the fat/water classification step for the spectroscopic reconstruction. Processing used for MR spectroscopic imaging, such as parametric model fitting of the spectrum (22), can be used for the spectroscopic approach to incorporate other prior information and improve robustness. In addition, the retracing design can be extended to more than three revolutions to provide higher SNR and more points for Dixon-based parametric reconstructions (16), and support higher spectral bandwidth and resolution for the spectroscopic perspective.
The concentric rings trajectory can be applied to many in vivo applications that benefit from magnetization-prepared imaging and robust fat/water separation, such as musculoskeletal imaging, structural brain imaging, and contrast-enhanced breast imaging. The ability for concentric rings to simultaneously offer spatial and spectral coverage also indicates its potential for imaging applications that require information in both space and time (23–25).
CONCLUSIONS
We developed two fat/water separation algorithms for the concentric rings 2D k-space trajectory based on a time-efficient retracing design. The Dixon-based approach is more computationally efficient while the spectroscopic approach provides a more general framework for resolving off-resonance effects. Experimental results show that robust and uniform fat suppression can be achieved with both reconstruction approaches.
ACKNOWLEDGMENTS
The authors thank Michael Lustig and Garry Gold for helpful discussions. H.W. is supported in part by a Sony Stanford Graduate Fellowship.
Grant Sponsors: National Institutes of Health; GE Healthcare.
REFERENCES
- 1.Matsui S, Kohno H. NMR imaging with a rotary field gradient. J Magn Reson. 1986;70:157–162. [Google Scholar]
- 2.Liang ZP, Lauterbur PC. Efficient dynamic imaging using concentric scanning; Proceedings of the 12th Annual Meeting of SMRM; New York, NY, USA. 1993. p. 477. [Google Scholar]
- 3.Zhou X, Liang ZP, Gewalt SL, Cofer GP, Lauterbur PC, Johnson GA. A fast spin echo technique with circular sampling. Magn Reson Med. 1998;39:23–27. doi: 10.1002/mrm.1910390106. [DOI] [PubMed] [Google Scholar]
- 4.Coggins BE, Zhou P. Sampling of the NMR time domain along concentric rings. J Magn Reson. 2007;184:207–221. doi: 10.1016/j.jmr.2006.10.002. [DOI] [PMC free article] [PubMed] [Google Scholar]
- 5.Wu HH, Lee J, Nishimura DG. MRI using a concentric rings trajectory. Magn Reson Med. 2008;59:102–112. doi: 10.1002/mrm.21300. [DOI] [PubMed] [Google Scholar]
- 6.Dixon WT. Simple proton spectroscopic imaging. Radiology. 1984;153:189–194. doi: 10.1148/radiology.153.1.6089263. [DOI] [PubMed] [Google Scholar]
- 7.Glover GH, Schneider E. Three-point Dixon technique for true water/fat decomposition with B0 inhomogeneity correction. Magn Reson Med. 1991;18:371–383. doi: 10.1002/mrm.1910180211. [DOI] [PubMed] [Google Scholar]
- 8.Glover GH. Multipoint Dixon technique for water and fat proton and susceptibility imaging. J Magn Reson Imag. 1991;1:521–530. doi: 10.1002/jmri.1880010504. [DOI] [PubMed] [Google Scholar]
- 9.Reeder SB, Wen Z, Yu H, Pineda AR, Gold GE, Markl M, Pelc NJ. Multicoil Dixon chemical species separation with an iterative least-squares estimation method. Magn Reson Med. 2004;51:35–45. doi: 10.1002/mrm.10675. [DOI] [PubMed] [Google Scholar]
- 10.Pindea AR, Reeder SB, Wen Z, Pelc NJ. Cramer-Rao bounds for three-point decomposition of water and fat. Magn Reson Med. 2005;54:625–635. doi: 10.1002/mrm.20623. [DOI] [PubMed] [Google Scholar]
- 11.Reeder SB, Pineda AR, Wen Z, Shimakawa A, Yu H, Brittain JH, Gold GE, Beaulieu CH, Pelc NJ. Iterative decomposition of water and fat with echo asymmetry and least-squares estimation (IDEAL): application with fast spin-echo imaging. Magn Reson Med. 2005;54:636–644. doi: 10.1002/mrm.20624. [DOI] [PubMed] [Google Scholar]
- 12.Yu H, Reeder SB, Shimakawa A, Brittain JH, Pelc NJ. Field map estimation with a region growing scheme for iterative 3-point water-fat decomposition. Magn Reson Med. 2005;54:1032–1039. doi: 10.1002/mrm.20654. [DOI] [PubMed] [Google Scholar]
- 13.Hernando D, Haldar JP, Sutton BP, Ma J, Kellman P, Liang ZP. Joint estimation of water/fat images and field inhomogeneity map. Magn Reson Med. 2008;59:571–580. doi: 10.1002/mrm.21522. [DOI] [PMC free article] [PubMed] [Google Scholar]
- 14.Ma J. Breath-hold water and fat imaging using dual-echo two-point Dixon technique with an efficient and robust phase-correction algorithm. Magn Reson Med. 2004;52:415–419. doi: 10.1002/mrm.20146. [DOI] [PubMed] [Google Scholar]
- 15.Wieben O, Leupold J, Mansson S, Hennig J. Multi-echo balanced SSFP imaging for iterative Dixon reconstruction; Proceedings of the 13th Annual Meeting of ISMRM; Miami, Florida, USA. 2005. p. 2386. [Google Scholar]
- 16.Yu H, McKenzie CA, Shimakawa A, Vu AT, Brau ACS, Beatty PJ, Pineda AR, Brittain JH, Reeder SB. Multiecho reconstruction for simultaneous water-fat decomposition and T2* estimation. J Magn Reson Imag. 2007;26:1153–1161. doi: 10.1002/jmri.21090. [DOI] [PubMed] [Google Scholar]
- 17.Moriguchi H, Lewin JS, Duerk JL. Dixon techniques in spiral trajectories with off-resonance correction: a new approach for fat signal suppression without spatial-spectral RF pulses. Magn Reson Med. 2003;50:915–924. doi: 10.1002/mrm.10629. [DOI] [PubMed] [Google Scholar]
- 18.Gurney PT. Ph.D. thesis. Stanford University; 2007. Magnetic resonance imaging using a 3D cones k-space trajectory. [Google Scholar]
- 19.Brodsky EK, Holmes JH, Yu H, Reeder SB. Generalized k-space decomposition with chemical shift correction for non-Cartesian water-fat imaging. Magn Reson Med. 2008;59:1151–1164. doi: 10.1002/mrm.21580. [DOI] [PubMed] [Google Scholar]
- 20.Spielman D, Webb P, Macovski A. Water referencing for spectroscopic imaging. Magn Reson Med. 1989;12:38–49. doi: 10.1002/mrm.1910120105. [DOI] [PubMed] [Google Scholar]
- 21.Yu H, Shimakawa A, McKenzie CA, Brittain JH, Reeder SB. IDEAL water-fat decomposition with multipeak fat spectrum modeling; Proceedings of the 16th Annual Meeting of ISMRM; Toronto, Ontario, Canada. 2008. p. 652. [Google Scholar]
- 22.Provencher SW. Estimation of metabolite concentrations from localized in vivo proton NMR spectra. Magn Reson Med. 1993;30:672–679. doi: 10.1002/mrm.1910300604. [DOI] [PubMed] [Google Scholar]
- 23.Posse S, Tedeschi G, Risinger R, Ogg R, Le Bihan D. High speed 1H spectroscopic imaging in human brain by echo planar spatial-spectral encoding. Magn Reson Med. 1995;33:34–40. doi: 10.1002/mrm.1910330106. [DOI] [PubMed] [Google Scholar]
- 24.Sarkar S, Heberlein K, Metzger GJ, Zhang X, Hu X. Applications of high-resolution echoplanar spectroscopic imaging for structural imaging. J Magn Reson Imag. 1999;10:1–7. doi: 10.1002/(sici)1522-2586(199907)10:1<1::aid-jmri1>3.0.co;2-c. [DOI] [PubMed] [Google Scholar]
- 25.Adalsteinsson E, Irarrazabal P, Topp S, Meyer C, Macovski A, Spielman DM. Volumetric spectroscopic imaging with spiral-based k-space trajectories. Magn Reson Med. 1998;39:889–898. doi: 10.1002/mrm.1910390606. [DOI] [PubMed] [Google Scholar]


