Abstract
For the first time, the hemodynamics within the entire cerebral cortex of a mouse were studied by using photoacoustic tomography (PAT) in real time. The PAT system, based on a 512-element full-ring ultrasound array, received photoacoustic signals primarily from a slice of 2-mm thickness. This system can provide high-resolution brain vasculature images. We also monitored the fast wash-in process of a photoacoustic contrast agent in the mouse brain. Our results demonstrated that PAT is a powerful imaging modality that can be potentially used to study small animal neurofunctional activities.
Keywords: photoacoustic tomography, real time, noninvasive
Photoacoustic tomography (PAT) images embedded targets that absorb electromagnetic (EM) waves. Unlike other pure optical and microwave imaging methods, PAT uses an EM wave as the illumination source but detects the ultrasound waves generated from the photoacoustic (PA) effect.1, 2, 3 The mechanism of the PA effect is based on the thermal expansion associated with the heating process after EM absorption by the target. Images are formed by acquiring PA signals from multiple positions over the tissue surface. This imaging modality combines the advantages of optical and ultrasound imaging modalities: high optical contrast as well as scalable ultrasound resolution and imaging depth. Moreover, PAT is noninvasive, is nonionizing, and can image tissues in vivo. Over the past decade, it has been successfully applied in imaging both animal and human tissues.4, 5, 6
One of the most successful applications of PAT is to image small animal brains noninvasively. Compared with other noninvasive pure optical imaging methods, such as the recently developed optical microangiography,7 PAT not only images deeper, but also measures functions. Various PAT systems have been developed, including mechanically scanning with a single ultrasonic transducer8, 9, 10 or a linear ultrasound array,11 and optical scanning based on a Fabry-Pérot interferometer.12 However, the temporal resolution was poor in most previous PAT systems, where minutes or longer were normally required to acquire one high-quality image of the entire cortex. Recently, a new full-ring array PAT system was developed to specifically address this challenge.13 Both phantom and animal experiments have demonstrated that this full-ring array system can provide high-quality images in much less time. Using this system, we report our studies of real-time functional imaging of the entire cortical region of a mouse in vivo. We briefly introduce the imaging system and the contrast agent. Then, we describe the experiment of imaging the cortex of a mouse in vivo, discuss the results, and reach several conclusions.
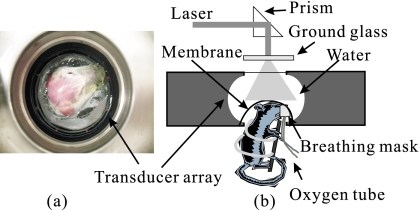
The primary part of the PA imaging system is a 512-element full-ring array. The diameter of the ring is 5 cm, and the center frequency of each element is about 5 MHz. In addition, each array element is cylindrically focused, forming an imaging slice of about 2-mm thickness. Although all 512 channels were equipped with preamplifiers for optimizing signal-to-noise ratio (SNR) at the front end and received PA signals in parallel, the secondary stage amplifiers and analog-to-digital converters have only 64 channels. Thus, for each laser shot, one-eighth of detection channels were recorded, and a complete 2-D scan requires eight laser shots. Figure 1 shows the top and side views of the array system. This system can also provide 3-D photoacoustic images by vertically scanning samples. More technical details of the system are described in Ref. 13.
Figure 1.
Full-ring array PAT system. (a) Top view of the full-ring array and the animal head. (b) Side view of the array system and the position of the animal.
The illumination source is a tunable pulsed laser system based on an optical parametric oscillator (OPO; Vibrant HE 315I, Opotek, Inc.). The laser pulse has a repetition rate of 10 Hz and a pulse width of 5 ns. Two wavelengths, 532 nm and 620 nm, were used to image the animal. After collimation, the laser beam was homogenized by passing it through a ground glass before it reached the tissue surface. The fluence of every laser pulse on the tissue was well below 20 mJ∕cm2, the American National Standards Institute (ANSI) safety standard.
This system required a temporal interval greater than 0.125 s between two successive data acquisitions, which is greater than the laser pulse interval (0.1 s). Thus, only every other laser shot was actually used in data acquisition, reducing the frame rate to 0.625 Hz without averaging. (As mentioned, eight shots are required for a complete scan.)
The contrast agent used in the following in vivo animal experiment was Evans blue, a dye that tightly binds to serum albumin in the vasculature. This dye has been used to determine blood volume and also to study the blood-brain barrier, since albumin cannot diffuse to the cerebrospinal fluid. We chose this dye because its absorption spectrum has a peak around 620 nm (Ref. 14), where the blood absorption is relatively low. Moreover, the fast uptake of the Evans blue makes it a good model to demonstrate the in vivo imaging speed advantage of the system.
The cerebral cortex of a Swiss Webster mouse (Harlan Sprague Dawley, Inc., Indianapolis, ∼23 g) was imaged in vivo. Before the experiment, the hair on the mouse head was gently depilated by using a hair removal lotion, as shown in Fig. 1a, and a layer of ultrasound gelatin was applied. Then the mouse was fixed in a homemade animal holder, with its head covered by a thin transparent plastic membrane, and protruding into the imaging plane. To keep the animal motionless, oxygen was supplied with 1% isoflurane via a homemade breathing mask during the experiment. All experimental animal procedures conformed to the National Institutes of Health (NIH) guidelines and were in compliance with the Washington University Institutional Animal Care and Use Committee (IACUC).
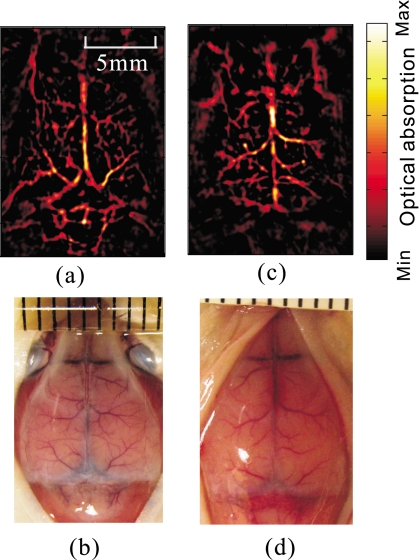
Before the administration of the contrast agent, the cortical vascular structure was imaged noninvasively at 532-nm wavelength, as shown in Fig. 2a. For comparison, an open-scalp anatomical photograph of the cortex vasculature was taken [Fig. 2b] after the experiment and mouse euthanasia. Since blood has strong absorption at this wavelength, the blood vessels in the reconstructed image have a high contrast. Cortical vascular structures in mice are not anatomically identical. For instance, Figs. 2c, 2d present the PA image of another mouse (weight 19.7 g) and the anatomical photograph.
Figure 2.
Noninvasive cortical vascular structural imaging of two mice. (a) and (c): The PA images obtained at 532-nm wavelength. (b and d): Photographs of the cortexes corresponding to (a) and (c). The photographs were taken with the scalps removed after the mouse was euthanized.
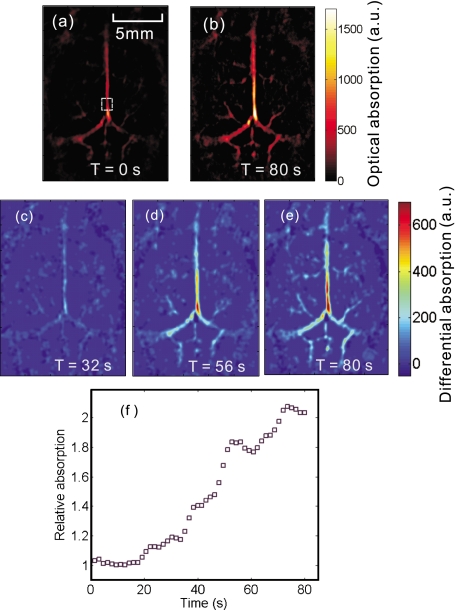
To monitor the wash-in process of the contrast dye, about 0.1 ml of Evans blue dye at 3% concentration was administered through tail vein injection. The entire cortical region was continuously imaged at a fixed position at 620-nm wavelength. The adminstration started at approximately 10 s after the experiment began and took about 70 s. PA images were reconstructed offline. At 620-nm wavelength, the control image obtained before the injection, as shown in Fig. 3a, missed many fine structures due to much lower optical absorption compared with Fig. 2a. With the increase in the optical absorption by Evans blue at this wavelength, more vascular structures appeared, as shown in Fig. 3b. The contrast agent wash-in dynamics are shown in Figs. 3c, 3d, 3e, which plot the differences between the pixel values in the subsequent images and the control image at three different times. In addition, we calculated the integral of the pixel values within a square area of 1 mm2, as marked in Fig. 3a, and normalized the result by the value of the control image [Fig. 3f]. All PA images were obtained without averaging.
Figure 3.
Noninvasive imaging of the wash-in process of Evans blue in cortical vasculature. (a) and (b): The PA images obtained before and after the dye injection. (c), (d), (e): PA image differences relative to (a) at time 32 s, 56 s, and 80 s, respectively. All these images were obtained at 620-nm wavelength. (f) The normalized value of the integral of the pixel values within the marked square area in (a) versus time. (Color online only.)
The Evans blue dye in the blood vessels helped to recover fine vascular structures in the PA image at 620-nm wavelength, as shown in Fig. 3b. The increase in the PA image values in both the hemispherical and the cerebellar vasculature is plotted in Figs. 3c, 3d, 3e, demonstrating the increase in the dye concentration within the cortex blood vessels. Figure 3f demonstrated a more than 100% increase in the pixel values in the selected sample region. More vascular structures could be recovered by increasing the amount or the concentration of Evans blue. The fluctuation in Fig. 3f is possibly due to breathing motion and motion stimulated by the injection, as both can alter the mouse’s position and thus affect the reconstructed images. Although only several sample PA images were provided, the images were continuously acquired at 1.6 s∕frame.
The image reconstruction is based on the solid-angle-weighted reconstruction algorithm.15 Due to the limited-view scanning geometry and the finite bandwidth of the system response, some of the reconstructed image pixels have nonphysical negative values, which were removed in the image processing. The changes in the PA value, as in Figs. 3c, 3d, 3e, denote the relative variances in the initial PA pressure, which are proportional to the changes in the optical absorption.
For the first time, we obtained real-time PA functional imaging of the hemodynamics of the entire mouse cortex in vivo. We imaged the wash-in process of Evans blue contrast dye in the cortex vasculature. The temporal resolution of 1.6 s can be further improved to about 1 s by using a laser source with a more appropriate repetition rate. Substantial improvement in the imaging speed could be achieved by adding more parallel data acquisition channels or using an iterative reconstruction algorithm with fewer required data acquisitions, such as the compressed-sensing method.16 Our results demonstrated that array-based PAT can be a powerful candidate for studying various neurofunctional activities, such as epilepsy, which induce changes in the vasculature system.
Acknowledgments
We thank Yu Wang and Junjie Yao for helpful discussions. This work has been supported in part by National Institutes of Health Grant Nos. R01 EB000712, R01 EB008085, and U54 CA136398 (Network for Translational Research). L.W. has a financial interest in Microphotoacoustics, Inc., and Endra, Inc. which, however, did not support this work.
References
- Oraevsky A. and Karabutov A., “Optoacoustic tomography,” in Biomedical Photonics Handbook, Vo-Dinh T., Ed., Chap. 34, pp. 1–34, CRC, Boca Raton, FL: (2003). [Google Scholar]
- Wang L. V. and Wu H., Biomedical Optics:Principles and Imaging, Wiley, Hoboken, NJ: (2007). [Google Scholar]
- Wang Lihong V., Ed. Photoacoustic Imaging and Spectroscopy, 1st ed., CRC Press, Boca Raton, FL: (2009). [Google Scholar]
- Xu M. and Wang L. V., “Photoacoustic imaging in biomedicine,” Rev. Sci. Instrum. 77, 41101–41122 (2006). 10.1063/1.2195024 [DOI] [Google Scholar]
- Li C. and Wang L. V., “Photoacoustic tomography and sensing in biomedicine,” Phys. Med. Biol. 54, R59–R97 (2009). 10.1088/0031-9155/54/19/R01 [DOI] [PMC free article] [PubMed] [Google Scholar]
- Wang L. V., “Multiscale photoacoustic microscopy and computed tomography,” Nat. Photonics 3(9), 503–509 (2009). 10.1038/nphoton.2009.157 [DOI] [PMC free article] [PubMed] [Google Scholar]
- Wang R. K. K. and Hurst S., “Mapping of cerebro-vascular blood perfusion in mice with skin and skull intact by optical micro-angiography at 1.3 μm wavelength,” Opt. Express 15(18), 11402–11412 (2007). 10.1364/OE.15.011402 [DOI] [PubMed] [Google Scholar]
- Wang X. D., Pang Y. J., Ku G., Xie X. Y., Stoica G., and Wang L. H. V., “Noninvasive laser-induced photoacoustic tomography for structural and functional in vivo imaging of the brain,” Nat. Biotechnol. 21(7), 803–806 (2003). 10.1038/nbt839 [DOI] [PubMed] [Google Scholar]
- Stein E. W., Maslov K., and Wang L. H. V., “Noninvasive, in vivo imaging of the mouse brain using photoacoustic microscopy,” J. Appl. Phys. 105(10), 102027 (2009). 10.1063/1.3116134 [DOI] [PMC free article] [PubMed] [Google Scholar]
- Yang S., Xing D., Zhou Q., Xiang L., and Lao Y., “Functional imaging of cerebrovascular activities in small animals using high-resolution photoacoustic tomography,” Med. Phys. 34(8), 3294–3301 (2007). 10.1118/1.2757088 [DOI] [PubMed] [Google Scholar]
- Yang D. W., Xing D., Yang S. H., and Xiang L. Z., “Fast full-view photoacoustic imaging by combined scanning with a linear transducer array,” Opt. Express 15(23), 15566–15575 (2007). 10.1364/OE.15.015566 [DOI] [PubMed] [Google Scholar]
- Laufer J., Zhang E., Raivich G., and Beard P., “Three-dimensional noninvasive imaging of the vasculature in the mouse brain using a high-resolution photoacoustic scanner,” Int. J. Educational Telecommunications 48, D299–D306 (2009). [DOI] [PubMed] [Google Scholar]
- Gamelin J., Maurudis A., Aguirre A., Huang F., Guo P., Wang L. V., and Zhu Q., “A real-time photoacoustic tomography system for small animals,” Opt. Express 17(13), 10489–10498 (2009). 10.1364/OE.17.010489 [DOI] [PMC free article] [PubMed] [Google Scholar]
- Patterson C. E., Rhoades R. A., and Garcia J. G. N., “Evans blue-dye as a marker of albumin clearance in cultured endothelial monolayer and isolated lung,” J. Appl. Physiol. 72, 865–873 (1992). 10.1063/1.351760 [DOI] [PubMed] [Google Scholar]
- Xu M. H. and Wang L. V., “Universal back-projection algorithm for photoacoustic computed tomography,” Phys. Rev. E 71(1), 016706 (2005). 10.1103/PhysRevE.71.016706 [DOI] [PubMed] [Google Scholar]
- Provost J. and Lesage F., “The application of compressed sensing for photo-acoustic tomography,” IEEE Trans. Med. Imaging 28(4), 585–594 (2009). 10.1109/TMI.2008.2007825 [DOI] [PubMed] [Google Scholar]


