

Abstract
Mismatch repair proteins correct errors in DNA via an ATP-driven process. In eukaryotes, the Msh2-Msh6 complex recognizes base pair mismatches and small insertion/deletions in DNA and initiates repair. Both Msh2 and Msh6 proteins contain Walker ATP-binding motifs that are necessary for repair activity. To understand how these proteins couple ATP binding and hydrolysis to DNA binding/mismatch recognition, the ATPase activity of Saccharomyces cerevisiae Msh2-Msh6 was examined under presteady-state conditions. Acid-quench experiments revealed that in the absence of DNA, Msh2-Msh6 hydrolyzes ATP rapidly (burst rate = 3 s−1 at 20 °C) and then undergoes a slow step in the pathway that limits catalytic turnover (kcat = 0.1 s−1). ATP is hydrolyzed similarly in the presence of fully matched duplex DNA; however, in the presence of a G:T mismatch or +T insertion-containing DNA, ATP hydrolysis is severely suppressed (rate = 0.1 s−1). Pulse-chase experiments revealed that Msh2-Msh6 binds ATP rapidly in the absence or in the presence of DNA (rate = 0.1 μM−1 s−1), indicating that for the Msh2-Msh6·mismatched DNA complex, a step after ATP binding but before or at ATP hydrolysis is the rate-limiting step in the pathway. Thus, mismatch recognition is coupled to a dramatic increase in the residence time of ATP on Msh2-Msh6. This mismatch-induced, stable ATP-bound state of Msh2-Msh6 likely signals downstream events in the repair pathway.
Replicative DNA polymerases are responsible for accurately reproducing the genetic code of organisms; however, even the most accurate polymerases make errors that result in approximately one mismatched base pair per 107 nucleotides as well as insertion/deletion loops (1). These defects must be corrected prior to subsequent rounds of replication, to minimize accumulation of potentially deleterious mutations and genome instability. A multi-protein mismatch repair system is responsible for this task, which involves recognition and removal of the defects followed by replacement with correct DNA. This repair system was initially identified and studied extensively in bacteria, and homologous systems were discovered in a variety of other organisms, including humans (2). The critical role of DNA mismatch repair in maintaining genome and cellular integrity is highlighted by the links between defective repair protein function and predisposition to cancer (e.g., hereditary nonpolyposis colorectal cancer (3)).
The repair process begins with DNA binding and mismatch/defect recognition by prokaryotic MutS or eukaryotic MutS homologue proteins. MutS/Msh1 proteins then signal other proteins downstream in the pathway to initiate DNA excision. In bacteria, MutH endonuclease nicks the unmethylated new DNA strand at a GATC site, which is followed by UvrD/Helicase II and exonucleases such as ExoI, ExoVII, RecJ, and ExoX excising the strand past the mismatch. MutL protein coordinates MutS and MutH action on DNA and stimulates MutH endonuclease activity. DNA is resynthesized by Polymerase III holoenzyme (comprising the αεθ core polymerase, β clamp, and γ/τ complex clamp loader (4)) and ligated by DNA ligase to complete repair (2). In eukaryotes, the identities and functions of all downstream repair proteins are not as clear. Eukaryotic homologues of MutL are essential for mismatch repair, but no MutH homologue is known; in fact, DNA methylation does not appear to factor in strand discrimination. One hypothesis in current literature is that the processivity clamp, PCNA, that tethers replicative polymerase δ (and ε) to primer–template DNA junctions may aid strand discrimination and possibly direct repair proteins to the 3′-hydroxyl terminus of the new DNA (5). Proofreading exonucleases (or as yet unknown exonucleases) could then excise DNA beyond the mismatch, followed by polymerase δ and/or ε-catalyzed DNA synthesis and ligation of the nick–likely by DNA ligase I (6, 7); ExoI, a 5′-3′ exonuclease that binds repair proteins, may also participate in mismatch excision (8).
MutS and MutL are highly conserved components of DNA mismatch repair systems. Eukaryotes have several homologues of MutS (e.g., Saccharomyces cerevisiae Msh1–6, human Msh2–6) and MutL (e.g., S. cerevisiae Pms1, Mlh1–3, human Mlh1, Mlh3, Pms1, Pms2) that appear to have specialized functions. Msh2, Msh3, and Msh6 proteins in particular repair replication errors in genomic DNA. Msh2 forms heterodimers with Msh6 or Msh3 that appear to be equivalent to MutS homodimers. The Msh2-Msh6 heterodimer (MutSα) recognizes base pair mismatches and 1–2 nucleotide insertion/deletion loops, whereas the Msh2-Msh3 heterodimer (MutSβ) recognizes longer insertion/deletion loops. MutL homologues also form heterodimers (e.g., S. cerevisiae Mlh1-Pms1/(MutLα) and Mlh1-Mlh3/(MutLβ) that work in concert with Msh proteins to facilitate DNA repair, as observed for prokaryotic MutS and MutL proteins (6, 7).
Both MutS (Msh) and MutL (Mlh) proteins possess an ATPase activity that is essential for their action in DNA repair. MutS proteins contain Walker A (ATP-binding) and B (Mg2+-binding) motifs, and MutL proteins contain ATP-binding motifs of the GHKL class of ATPases (9-11). ATP binding and hydrolysis are known to induce conformational changes in the S. cerevisiae Msh2-Msh6 complex (12), and crystal structures of a MutS homodimer reveal that the ATP binding sites are connected to DNA binding sites by domains that may communicate information between the two (9, 10, 12). Thus, ATP-induced conformational changes may modulate Msh2-Msh6 (MutS) interactions with DNA (and perhaps other repair proteins as well). For example, Msh2-Msh6 (MutS) forms a stable complex with DNA in the absence of nucleotides, but gel mobility shift experiments indicate that when ATPγS or ATP is added to the reaction, the protein switches to a conformation that can slide off the ends of short DNA duplexes in gel mobility shift experiments (ATPγS, a non-hydrolysable ATP analogue, likely mimics an ATP-bound state of Msh2-Msh6 (MutS) (13, 14)). These data support models in which Msh2-Msh6 (MutS) recognizes a mismatch, binds ATP, releases the mismatch, and moves on DNA to encounter/communicate with downstream repair proteins such as MutH in bacteria or PCNA in eukaryotes. Msh2-Msh6 (MutS) could track passively on DNA akin to a sliding clamp (13) or translocate on DNA akin to a motor protein driven by ATP binding and hydrolysis (15). There are, however, other studies of Escherichia coli, S. cerevisiae, and human mismatch repair proteins, which indicate that in the presence of ATPγS or ATP, Msh2-Msh6 (MutS) forms a ternary complex with Mlh1-Pms1 (MutL) at the mismatch (14, 16, 17). Moreover, E. coli MutH endonuclease is stimulated by MutS, MutL, and ATP, even if the mismatched base pair and GATC nicking sites are on two distinct DNA molecules (18). These data support an alternative model in which Msh2-Msh6 (MutS) does not move from the mismatch, and the role of ATP binding and hydrolysis is to select mismatched DNA over fully matched DNA, as well as modulate the interaction between Msh2-Msh6 (MutS) and other proteins.
One vital piece of information necessary to fully understand how Msh2-Msh6 (MutS) utilize ATP for DNA repair is the mechanism of ATP binding and hydrolysis catalyzed by these proteins. For example, the experiments with ATPγS, indicating ternary complex formation, imply that the ATP-bound state of Msh2-Msh6 (MutS) is important for mismatch repair; but how does the process play out in vivo where Msh2-Msh6 (MutS) likely hydrolyzes ATP rapidly and there are no non-hydrolysable ATP analogues? (S. cerevisiae Msh2-Msh6 ATPase kcat = 0.5–0.7 s−1 at 30 °C; Figure 4). How are individual steps in the Msh2-Msh6 ATPase pathway–i.e., ATP binding, hydrolysis, product release, and turnover–coupled to the mechanics of DNA mismatch recognition and initiation of repair? Solving this puzzle will require detailed kinetic information on Msh2-Msh6 ATPase activity, as well as kinetic information on Msh2-Msh6 interactions with DNA and other components of the repair pathway.
Figure 4.

Steady-state parameters of Msh2-Msh6 ATPase. (A) Msh2-Msh6 ATPase varies with NaCl and yields kcat = 0.25–0.35 s−1 alone (□) and peak kcat = 0.65 and 0.55 s−1 near 150 and 170 mM NaCl concentrations with G:C (◇) and G:T DNA (●), respectively (30 °C). (B) ATP dependence of the steady-state activity yields kcat and Km values for Msh2-Msh6 in the absence and presence of various DNA substrates at 25 °C.
We have initiated such studies of eukaryotic mismatch repair proteins with S. cerevisiae Msh2-Msh6, which is highly homologous to the human Msh2-Msh6 mismatch repair complex. In this report, we detail the first pre-steady-state analysis of the ATP binding and hydrolysis mechanism of eukaryotic Msh2-Msh6 proteins, and the coupling between ATPase activity and DNA binding/mismatch recognition. Intriguingly, interaction of Msh2-Msh6 with mismatched DNA dramatically alters the ATPase pathway–introducing a slow step (or slowing down an existing step) between ATP binding and ATP hydrolysis. As a result, the Msh2-Msh6·mismatched DNA complex remains in an ATP-bound state for a prolonged time, which is likely important for signaling DNA repair events downstream of mismatch recognition.
EXPERIMENTAL PROCEDURES
DNA, Nucleotides, and Other Reagents
Synthetic DNAs were purchased from Integrated DNA Technologies and purified by denaturing polyacrylamide gel electrophoresis. DNA primers used for cloning Msh2 and Msh6 genes from S. cerevisiae genomic DNA were as follows: Msh2Start: 5′ CTC AGA TTA AAC ATA TGT CCT CCA CTA GGC 3′; Msh2End: 5′ CAC TTT TAG GGA TCC TGA ATA AAC TGT ACC 3′; Msh6Start: 5′ TTT GAA CTC CCA TAT GGC CCC AGC TAC CCC 3′; and Msh6End: 5′ TTA ATA TAG GAT CCT TGC CTG TTC TGA ATC 3′. Matched and mismatched DNA substrates used in the biochemical assays were based on an earlier study of Msh2-Msh6–DNA interactions by the Kolodner research group (19). Their sequences are as follows: template: 5′ ATT TCC TTC AGC AGA TAG GAA CCA TAC TGA TTC ACA T 3′; G:C complement: 5′ ATG TGA ATC AGT ATG GTT CCT ATC TGC TGA AGG AAA T 3′; G:T complement: 5′ ATG TGA ATC AGT ATG GTT TCT ATC TGC TGA AGG AAA T 3′; and +T complement: 5′ ATG TGA ATC AGT ATG GTT T CCT ATC TGC TGA AGG AAA T 3′. DNA duplexes were prepared by mixing complementary DNA strands in a 1:1 ratio (20–50 μM concentration in 20 mM Tris-HCl, pH 8, 150 mM NaCl) and heating the mixture to 95 °C for 3 min followed by slow cooling over 6–8 h to 25 °C (nondenaturing PAGE analysis of the products revealed >95% duplex DNA). pET11a vector DNA was purchased from Novagen, and pLANT2/RIL vector was a gift from Dr. Mike O’Donnell, Rockefeller University. Radioactive nucleotides α32P-ATP, γ32P-ATP, and 35S-ATPγS were purchased from Perkin-Elmer Life Sciences. α32P-ADP was prepared by hydrolyzing 30 μCi α32P-ATP with 1 μM Msh2-Msh6 in 10 μL of ATPase buffer (20 mM Tris-HCl, pH 7.5, 5 mM MgCl2, 2 mM DTT, 110 mM NaCl) at 30 °C for 2 h. Once α32P-ATP was completely hydrolyzed, the reaction was loaded on a 1 mL diethylaminoethyl cellulose column (DE52) equilibrated in 0.05 M triethylammonium bicarbonate buffer, pH 8.0 (prepared by passing CO2 through a solution of 1 M triethylamine in water), and eluted with an 8 mL gradient of 0.05–1 M triethylammonium bicarbonate to separate ADP from traces of ATP, AMP, and Pi. 200 μL fractions were collected, and the purity of α32P-ADP was assessed by thin-layer chromatography on PEI cellulose plates using 0.6 M potassium phosphate buffer, pH 3.4. Fractions containing high concentrations of >95% pure α32P-ADP were pooled and extracted with phenol/chloroform to remove any protein contaminants. α32P-ADP partitioned into the organic phase and was extracted with 20 mM Tris-HCl, pH 8.0, washed and dried three times with methanol, and finally resolubilized in 60 μL of 20 mM Tris-HCl, pH 8.0 and stored in aliquots at −20 °C. Nonradioactive nucleotides were purchased from Sigma Chemical Co. BL21-CodonPlus and BLR(DE3) E. coli cells for protein overexpression were purchased from Stratagene and Novagen, respectively. Klenow fragment, bacteriophage T4 DNA ligase, calf intestinal phosphatase, T4 polynucleotide kinase, and all restriction enzymes were purchased from New England Biolabs, and Elongase DNA polymerase mix was purchased from Invitrogen Life Technologies. Q-Sepharose and SP-Sepharose were purchased from Amersham Bio-sciences, and Affi-Gel Heparin and DE52 cellulose were purchased from BioRad Laboratories and Whatman, respectively. PEI cellulose-F TLC plates were purchased from EM Science, and nitrocellulose membranes were from Schleicher and Schuell.
S. cerevisiae Msh2-Msh6 Production from E. coli
Msh2 and Msh6 genes were amplified from S. cerevisiae genomic DNA with primers that introduced an Nde I site at the initiating methionine and a BamH I site 70 nucleotides past the stop codon. The PCR products were digested with Nde I and BamH I and ligated individually into pET11a vectors under control of the T7lac promoter. Msh2 contains an internal Nde I site 571 bases from the stop codon; therefore, the Msh2 PCR product was digested partially with Nde I to isolate the full-length gene flanked by the Nde I and BamH I sites. Two strategies were employed to coexpress the two proteins in E. coli. In one, an SgrA I–Aat II fragment of pET11a-Msh2–containing the T7lac promoter, T7 ribosome binding site, Msh2, and T7 terminator–was made blunt-ended with the Klenow fragment and ligated into pET11a-Msh6 cut with HinD III and blunted as well. The resulting pET11a-Msh2-Msh6 plasmid was transformed into BL21-CodonPlus cells (containing a plasmid encoding genes for argU, ileY, and leuW tRNAs to correct for codon bias) to overexpress Msh2 and Msh6. The second strategy was to insert Msh6 into the Nde I and BamH I sites of pLANT-2/RIL vector, which contains the p15A origin of replication and genes for the three tRNAs and kanamycin resistance. The two plasmids, pET11a-Msh2 and pLANT2/RIL-Msh6, were cotransformed into BLR(DE3) cells to express Msh2 and Msh6 together. A fresh transformant was grown in 16 L of LB media at 37 °C to an OD600 0.6 and induced with 0.5 mM IPTG for 3 h. The cells were harvested, resuspended in 20 mM Tris-HCl, pH 8.0, 10% sucrose, and stored at −80 °C. All further steps were carried out at 4 °C. The cells were lysed in buffer A (25 mM Tris-HCl, pH 8.0, 1 mM EDTA, 5% glycerol, 1 mM PMSF; 300 mL final volume) + 1 M NaCl, by treatment with lysozyme (0.4 mg/mL; stirring for 30 min), followed by three freeze–thaw cycles (liquid N2 and 37 °C), and douncing in a tissue grinder (to shear DNA). Cell debris was removed by centrifugation at 23 400 RCF (14 000 rpm in SS34 rotor) for 45 min. The cleared lysate was dialyzed overnight against buffer A. The lysate was loaded onto a 25 mL SP-Sepharose column equilibrated with buffer A + 50 mM NaCl. The column was washed with 250 mL of buffer A + 50 mM NaCl, and the proteins eluted with a 250 mL linear gradient of buffer A, 150–400 mM NaCl. Fractions containing Msh2-Msh6 (~330 mM NaCl) were pooled and diluted to 150 mM NaCl with buffer B (20 mM potassium phosphate, pH 7.2, 0.5 mM EDTA, 5% glycerol). The protein solution was loaded onto a 20 mL Affi-Gel Heparin column equilibrated with buffer B + 50 mM NaCl. The column was washed with 200 mL of buffer B + 50 mM NaCl, and the proteins eluted with a 200 mL linear gradient of buffer B, 250–500 mM NaCl. Fractions containing Msh2-Msh6 (~420 mM NaCl) were pooled, diluted to 175 mM NaCl with buffer A, and loaded onto a 7 mL Q-Sepharose column equilibrated with buffer A + 50 mM NaCl. The column was washed slowly with 100 mL of buffer A + 100 mM NaCl, and the proteins eluted with an 80 mL linear gradient of buffer A, 200–600 mM NaCl. Msh2-Msh6 protein complex >95% purity eluted at ~350 mM NaCl, and the yield was 1.2 mg/L of cell culture. Msh2-Msh6 concentration was measured by Bradford assay and by absorbance at 280 nm in 6 M guanidinium hydrochloride with an Msh2-Msh6 extinction coefficient of 186 970 M−1 cm−1.
DNA Binding to Msh2-Msh6
Nitrocellulose membrane filtration and gel mobility shift experiments were performed with 37 nt length G:C, G:T, and G:+T duplexes (sequences based at 4 °C on a report by the Kolodner group; ref 19). Nitrocellulose membranes, cut into 2 × 2 cm squares, were pretreated with 0.5 N NaOH for 2 min, washed with H2O, and equilibrated in DNA binding buffer (50 mM Tris-HCl, pH 7.5, 5 mM MgCl2, 5% glycerol, 110 mM NaCl). 32P-DNA (0.05 μM) was incubated with Msh2-Msh6 (0–2 μM) in the buffer (15 μL reaction; 110 mM final NaCl) in the absence or presence of ADP or ATPγS (200 μM) for 10 min, and 10 μL aliquots of the reaction were filtered through the membrane on a single filter holder (VWR Scientific Products). The membrane was washed before and after filtration with 125 μL of buffer. 1 μL aliquots were spotted onto a separate membrane to measure total DNA in the reaction. Radioactivity on the membrane was quantitated on a PhosphorImager (Molecular Dynamics), and the molar amount of DNA bound to Msh2-Msh6 was determined and plotted versus Msh2-Msh6 concentration. The apparent dissociation constant for the interaction was determined from the data fit to a quadratic equation describing a 1:1 protein–ligand interaction:
where D·M is the molar amount of DNA bound to Msh2-Msh6; Dt and Mt are total DNA and Msh2-Msh6 concentrations, respectively; and Kd is the apparent dissociation constant. The data were fit by nonlinear regression using KaleidaGraph (Synergy Software).
Gel mobility shift assays for DNA binding were performed by incubating 0.5 μM 32P-DNA in 10 μL reactions with increasing concentrations of Msh2-Msh6 (0–2 μM), at 25 °C for 15 min, followed by electrophoresis at 4 °C on a native 4.5% TBE–acrylamide gel.
Nucleotide Binding to Msh2-Msh6
ATP, ATPγS, and ADP binding to Msh2-Msh6 was measured by nitrocellulose membrane binding assays in which Msh2-Msh6 was titrated with increasing concentrations of labeled nucleotide. Nitrocellulose membranes were treated with NaOH as described above and equilibrated in ATPase buffer (20 mM Tris-HCl, pH 7.5, 5 mM MgCl2, 2 mM DTT, 110 mM NaCl). In the reactions (15 μL), Msh2-Msh6 (1 μM) was incubated with 0–200 μM ATP + 0.3 μCi α32P-ATP or ADP +α32P-ADP (1 min at 4 or 25 °C) or ATPγS + 0.3 μCi 35S-ATPγS (15 min at 25 °C) in the absence or presence of DNA (2 μM), and 10 μL aliquots of the reaction were filtered through the membrane. The membranes were washed before and after filtration with 150 μL of nucleotide binding buffer. 1 μL aliquots were spotted onto a separate membrane to measure total nucleotide in the reaction. The molar amount of nucleotide bound to Msh2-Msh6 was determined and plotted versus nucleotide concentration. The binding isotherms were fit to an equation describing a 1:1 protein–ligand interaction (as above) or a 1:2 protein–ligand interaction:
where N·M is the fraction of nucleotide bound to Msh2-Msh6, Mt is total Msh2-Msh6 concentration, Nf is free nucleotide concentration, and K1 and K2 are apparent stepwise association constants.
Detection of ATP/ADP Contaminants in Msh2-Msh6
Possible ATP and ADP contaminants in purified Msh2-Msh6 were determined using an ATP bioluminescent assay kit (Sigma Chemical Co.) as described previously for human Msh2-Msh6 (15). ATP detection was performed by heat denaturing 100 nM Msh2-Msh6, cooling to 25 °C, adding an equal volume of the bioluminescent assay mix containing luciferase and luciferin (25-fold dilution), and detecting photon emission on the tritium channel of a Wallac 1409 DSA scintillation counter. A linear standard curve for 1–250 nM ATP was prepared similarly. For detection of ADP, phosphoenol pyruvate and pyruvate kinase were added to the reaction following Msh2-Msh6 denaturation (to generate ATP). Positive control experiments were performed by adding 100 nM ATP or ADP to Msh2-Msh6 before heat denaturation.
Steady-State ATPase Assays
NaCl dependence of Msh2-Msh6 ATPase was measured at 30 °C with 0.2 μM Msh2-Msh6 and 1 mM α32P-ATP in ATPase buffer (0–400 mM NaCl), in the absence or presence of 1 μM DNA. Time courses of ATP hydrolysis were analyzed by PEI cellulose thin-layer chromatography with 0.6 M potassium phosphate, pH 3.4, to determine kcat at each NaCl concentration. Km and kcat values at 25 °C were determined from time courses with 0.5 μM Msh2-Msh6 and 0–250 μM α32P-ATP, in the absence or presence of 2 μM DNA (110 mM NaCl).
Rapid-Quench and Pulse-Chase ATPase Assays
Pre-steady-state ATPase assays were performed on a KinTek Corp. quench-flow instrument (Austin, TX) with 4 μM Msh2-Msh6 and 0–1 mM α32P-ATP, in the absence or presence of 6 μM DNA, at 20 °C in ATPase buffer (110 mM NaCl). 16 μL of Msh2-Msh6 (±DNA) was mixed rapidly with 16 μL of ATP and quenched after varying times (0.08–15 s) with 35 μL of 0.7 M formic acid (after mixing, Msh2-Msh6 and α32P-ATP concentrations are 2 μM and 0–0.5 mM, respectively). 1 μL aliquots were spotted immediately on TLC plates and analyzed as above. Efficiency of the 0.7 M formic acid quench was tested by adding acid to Msh2-Msh6 protein 5 ms before ATP; no ADP formation over background was detected. To check if formic acid releases ADP completely from the enzyme, 100 μL of phenol-chloroform (1:1) was added after formic acid, but the data remained unchanged. Quenching with 1 N HCl instead of formic acid followed by phenol-chloroform and NaOH treatment also yielded the same data. The molar amount of ADP formed plotted versus time was fit to a single-exponential plus linear equation for experiments with no DNA or G:C DNA:
where A and k are burst amplitude and rate, respectively, V is steady-state velocity, and t is reaction time. Data with G:T DNA were fit to a linear equation. Burst amplitude or rate plotted versus ATP concentration fit to a hyperbola yielded an apparent Kd for ATP binding to Msh2-Msh6.
Pulse-chase experiments were performed similarly, except 35 μL of 10 mM unlabeled Mg2+-ATP chase was added to the reaction after varying times (0.01–5 s). After a chase time equivalent to 5–6 turnovers (35 s), reactions were quenched with 70 μL of 0.7 M formic acid and analyzed as above.
RESULTS
The series of experiments described below outline the pathway of ATP binding and hydrolysis catalyzed by eukaryotic DNA mismatch recognition/repair proteins. We have purified the S. cerevisiae Msh2-Msh6 protein complex in large enough quantities for pre-steady-state ATPase analysis. The kinetics of ATP binding and hydrolysis in the absence and in the presence of DNA reveal a highly specific and striking linkage between the mismatch recognition and the ATPase activities of Msh2-Msh6.
High Yield of Pure S. cerevisiae Msh2-Msh6 Repair Protein Complex from E. coli
The 249 kDa Msh2-Msh6 protein complex has been overexpressed previously in S. cerevisiae and purified to greater than 95% purity with yields of 0.1–0.2 mg/g of yeast cells (19, 20). We attempted to overexpress Msh2 and Msh6 in E. coli to improve protein yield for extended biochemical and biophysical studies and to simplify the production process. Coexpression of Msh2 and Msh6 results in maximal levels of a soluble Msh2-Msh6 complex with 1:1 stoichiometry; therefore, Msh2 and Msh6 genes were cloned from S. cerevisiae genomic DNA and inserted into a single pET11a vector–each under the control of a T7 promoter (Figure 1A). The proteins were overexpressed in E. coli cells that also produced excess argU, ileY, and leuW tRNAs to correct for codon bias (because of limiting levels of these tRNAs in E. coli). An alternate strategy was to insert one gene into pET11a vector and the other gene into a pLANT vector containing the p15A origin of replication as well as genes for the three tRNAs and kanamycin resistance (21). Both strategies worked equally well for Msh2-Msh6 overexpression, and after a three-step purification procedure over SP-Sepharose, Heparin, and Q-Sepharose columns, we obtained >0.5 mg/g of E. coli cells of >95% pure Msh2-Msh6 protein (Figure 1B).
Figure 1.
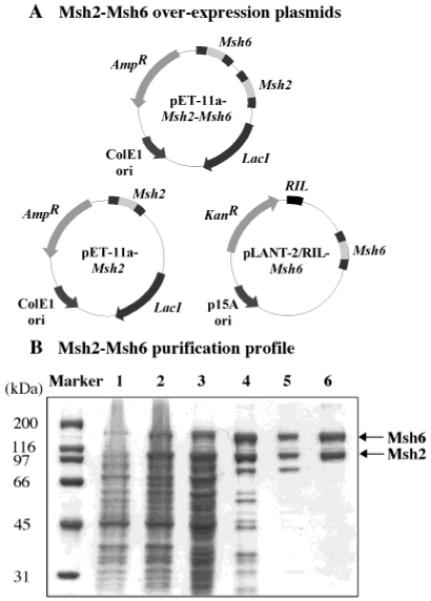
Overexpression and purification of S. cerevisiae Msh2-Msh6 from E. coli. (A) Plasmids used for overexpression. Msh2 and Msh6 genes were cloned into a single pET11a vector, or Msh2 was inserted into pET11a and Msh6 into pLANT-2/RIL and coexpressed in E. coli. (B) Purification profile of Msh2-Msh6 analyzed on 10% SDS–PAGE. Lane 1, uninduced cells; lane 2, IPTG-induced cells; lane 3, cleared cell lysate; lane 4, SP-Sepharose eluate; lane 5, Heparin eluate; and lane 6, Q-Sepharose eluate.
E. coli-Produced S. cerevisiae Msh2-Msh6 Selectively Binds Mismatched DNA
To determine whether the recombinant Msh2-Msh6 complex produced from E. coli was active for DNA mismatch repair, we tested first its DNA binding and mismatch recognition ability. 32P-labeled 37-nucleotide duplex DNA–either fully matched or containing a central G:T mismatch–was titrated with Msh2-Msh6 in nitrocellulose membrane filtration assays (we selected G:T DNA as the mismatched substrate in our experiments based on a comprehensive study by the Kolodner research group, which indicated that S. cerevisiae Msh2-Msh6 binds this DNA with the highest affinity) (19). Figure 2A shows that the recombinant Msh2-Msh6 also binds G:T DNA with high affinity and to completion (nonspecific DNA binding to the membrane <0.5%). The binding isotherm, fit to a quadratic equation for 1:1 binding between ligand and macromolecule, yields an apparent dissociation constant (Kd) of 45 ± 1 nM for the interaction. In contrast, very little interaction is detectable between Msh2-Msh6 and the fully matched G:C DNA substrate (<10% of total). Furthermore, consistent with previous reports, Msh2-Msh6 binds G:T DNA with high affinity in the absence of nucleotide and in the presence of ADP but with lower affinity/stability in the presence of ATPγS (Figure 2B). Thus, E. coli-produced Msh2-Msh6 discriminates strongly between matched and mismatched DNA and displays weaker binding to DNA in the presence of ATP (ATPγS), similar to the Msh2-Msh6 complex purified from S. cerevisiae (19, 20) and human Msh2-Msh6 (13, 22).
Figure 2.
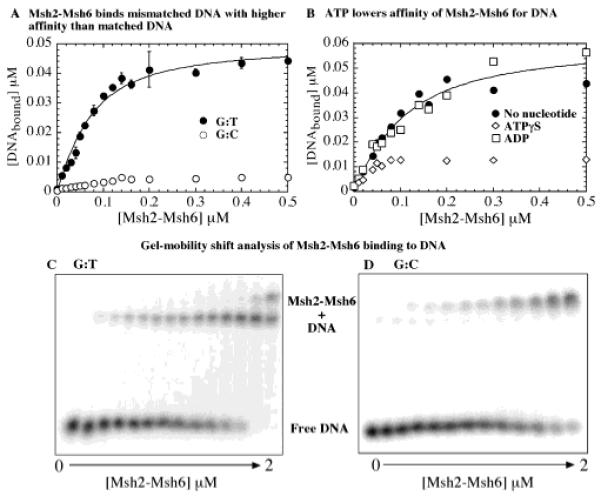
Selective binding of Msh2-Msh6 to mismatched DNA. (A) In nitrocellulose membrane filtration assays, titration of 0.05 μM 32P-G:T DNA (●) with increasing Msh2-Msh6 yields an apparent Kd = 45 ± 1 nM for the interaction. G:C DNA (○) binding to Msh2-Msh6 is less than 10% of total. (B) Msh2-Msh6 binds G:T DNA similarly in the presence of 200 μM ADP (□) (Kd = 75 ± 1 nM) but with lower affinity in the presence of ATPγS (◇). (C and D) Gel mobility shift assays with 0.5 μM 32P-DNA show Msh2-Msh6 binding G:C DNA, albeit with weaker affinity than G:T.
Other research groups have reported interaction between Msh2-Msh6 and matched DNA substrates using gel mobility shift assays (13, 19); therefore, we also used this method to test the DNA binding activity of our recombinant Msh2-Msh6 complex. Figure 2C,D shows titration of G:T and G:C DNA with increasing concentrations of Msh2-Msh6. Under these conditions, both mismatched and matched DNA are bound by Msh2-Msh6, although the affinity for G:C DNA appears lower relative to G:T DNA. Also, the Msh2-Msh6·G:C complex migrates more slowly in the gel than the Msh2-Msh6·G:T complex and has been designated a nonspecific species in earlier reports (13, 19). The slower-migrating species may have more than one Msh2-Msh6 bound per G:C DNA substrate–which may not occur as readily with mismatched DNA if one Msh2-Msh6 complex bound at the central mismatch/insertion occludes further protein binding to DNA. In view of the gel mobility shift data, the lack of detectable interaction between G:C DNA and Msh2-Msh6 in nitrocellulose membrane filtration assays suggests that the Msh2-Msh6·G:C complex has low stability and is likely lost during the filtration and wash process (it is possible that Msh2-Msh6 utilizes weak and dynamic interactions with fully matched DNA to scan the duplex for mismatched/distorted base pairs, which it can bind with higher stability).
Most importantly, the data reveal that the E. coli-produced Msh2-Msh6 has DNA binding and mismatch recognition properties comparable to S. cerevisiae-produced Msh2-Msh6 and is therefore suitable for further investigation.
DNA Binding-ATPase Link: Both Msh2 and Msh6 Proteins Bind ATPγS
Correct design and interpretation of presteady-state kinetics experiments requires knowledge of active site concentration, binding constants for ATP and DNA substrates, and steady-state kcat and Km constants for Msh2-Msh6 ATPase activity (23). Experiments in this section and the next are designed to gather such defining information on Msh2-Msh6 ATPase activity.
We measured ATP binding to Msh2-Msh6 by quantitative membrane filtration assays and observed 1 μM α32P-ATP binding to 1 μM Msh2-Msh6 with apparent Kd values of 15, 10, and 7 μM in the absence of DNA and in the presence of fully matched G:C and mismatched G:T DNA, respectively (Figure 3A). The binding isotherm saturates at 1 μM ATP (even at 1 mM ATP; data not shown), which is only half the expected value of 2 μM ATP bound, given that both Msh2 and Msh6 contain Walker ATP-binding motifs. Similarly, α32P-ADP binding saturates at only one ADP molecule bound per Msh2-Msh6 (Figure 3B). There are several possible explanations for the observed half-maximal binding: (a) a substantial portion of the Msh2-Msh6 protein preparation is inactive; (b) Msh2-Msh6 protein preparation is contaminated with a tightly bound nucleotide; (c) only one subunit, Msh2 or Msh6, binds the nucleotide; (d) both subunits bind the nucleotide but with very different affinities; and (e) Msh2-Msh6 hydrolyzes ATP, and rapid ADP dissociation results in an apparently lower concentration of the Msh2-Msh6·ATP complex. In nitrocellulose membrane filtration assays performed with 0.5 μM DNA, Msh2-Msh6 bound DNA with near 1:1 stoichiometry–an indication that the protein is fully active (data not shown). In addition, a sensitive luciferase-based assay performed to detect nucleotide contaminants did not reveal that any ATP or ADP previously bound tightly to Msh2-Msh6 (Figure 3C). We investigated the remaining possibilities using non-hydrolysable ATPγS.
Figure 3.

Msh2-Msh6 complex binds one ATP or one ADP molecule but binds two ATPγS molecules with differing affinities. (A) In nitrocellulose membrane filtration assays, Msh2-Msh6 binds α32P-ATP with apparent Kd = 15.5 ± 0.1, 9.7 ± 1, and 7.5 ± 1.7 μM alone (□) and in the presence of 2 μM G:C (◇) or G:T (●) DNA in the reaction, respectively. The binding isotherm saturates at one ATP molecule bound per per Msh2-Msh6. (B) Similarly, Msh2-Msh6 binds one ADP alone (□) and in the presence of G:C DNA (◇) or G:T DNA (●), with apparent Kd = 7.1 ± 1, 6.6 ± 1.2, and 6.6 ± 1.6 μM, respectively (fits shown only for ATP or ADP binding with G:C DNA, for clarity). (C) Luciferase bioluminescence assays performed with heat-denatured Msh2-Msh6 detect no tightly bound ATP or ADP. 100 nM Msh2-Msh6 alone yields luciferase activity corresponding to 57 cpm as compared with 1.69 × 10⁶ and 1.33 × 10⁶ cpm for 100 nM ATP and ADP standards, respectively. Exogenous addition of 100 nM ATP or ADP to Msh2-Msh6 restores luciferase activity to 1.37 × 10⁶ and 1.14 × 10⁶ cpm, respectively. (D–F) Two γ35S-ATPγS molecules bind Msh2-Msh6 with differing affinities: Kd(1) = 3.7 ± 1.7, 5.5 ± 0.8, and 8.8 ± 1.6 μM and Kd(2) = 17.3 ± 6.9, 19.5 ± 1.9, and 44.9 ± 7.1 μM alone (D; □) and with G:C (E; ◇) or G:T (F; ●) DNA, respectively. In panel F, binding isotherms simulated either with Kd = 9 or 45 μM for both ATPγS molecules highlight the biphasic nature of ATPγS binding to Msh2-Msh6.
Figure 3D shows the titration of 1 μM Msh2-Msh6 with 35S-ATPγS in the absence of DNA, and the binding isotherm saturates at two ATPγS molecules per Msh2-Msh6 complex (nonspecific ATPγS binding <1%). Interestingly, the two ATPγS bind Msh2-Msh6 with differing affinities in the absence of DNA (apparent Kd(1) = 4 μM and Kd(2) = 17 μM). Similarly, two ATPγS molecules bind Msh2-Msh6 with differing affinities in the presence of matched DNA (apparent Kd(1) = 6 μM and Kd(2) = 20 μM; Figure 3E) as well as mismatched DNA (apparent Kd(1) = 9 μM and Kd(2) = 45 μM; Figure 3F). Figure 3F also contrasts the data with simulated binding isotherms for both ATPγS molecules binding Msh2-Msh6 with high affinity (Kd = 9 μM) or low affinity (Kd = 45 μM). A low to negligible rate of dissociation of ATPγS molecules from Msh2-Msh6 indicates that the interaction is highly stable (data not shown). These data reveal that both Msh2 and Msh6 subunits can bind nucleotides and suggest that in the case of ATP, interaction with the second site may be too weak for detection in this assay (high dissociation rate), or hydrolysis and rapid ADP release from that site may render it invisible (consistent with this idea, we observe only one α32P-ADP molecule bound per Msh2-Msh6 complex; Figure 3B).
DNA Binding–ATPase Link: Steady-State Analysis Suggests Only Subtle Changes in Msh2-Msh6 ATPase Activity on Binding Mismatched DNA
The steady-state ATPase rate of human Msh2-Msh6 is stimulated ~4-fold by matched DNA (41 nt length) and 4-fold more by G:T DNA (kcat·G/T DNA = 0.17 s−1 at 37 °C), and the ATPase activity is sensitive to NaCl (24). In contrast, S. cerevisiae Msh2-Msh6 ATPase activity appears unaffected or slightly stimulated in the presence of DNA (25). Given this variability (likely because of varying assay conditions), we began our investigation of the Msh2-Msh6 ATPase mechanism by measuring the steady-state kcat and Km parameters and the optimal NaCl concentration for activity.
In the absence of DNA, the steady-state turnover rate, kcat, is 0.25 s−1, and it increases to 0.35 s−1 with NaCl (30 °C). In the presence of G:C and G:T DNA, kcat peaks at 0.65 and 0.55 s−1 at 150 and 170 mM NaCl, respectively (Figure 4A). The data suggest that interaction between Msh2-Msh6 and any DNA has a subtle (~2-fold) effect on the rate-limiting step in the pathway (Figure 4A,B). The NaCl dependence likely reflects stability of Msh2-Msh6·DNA complex, as we observe almost no DNA binding to Msh2-Msh6 at 400 mM NaCl (data not shown). Next, the Msh2-Msh6 ATPase rate was measured as a function of ATP concentration at 110 mM NaCl (25 °C) and yielded a 1.5–2-fold increase in kcat in the presence of matched or mismatched DNA (Figure 4B); we chose 110 mM NaCl as the standard condition for all further ATPase experiments, as this is the lowest NaCl concentration at which kcat is near maximum and Msh2-Msh6 exhibits stable interaction with mismatched DNA (Figures 4A and 2A, respectively). The Km values were 17, 18, and 49 μM in the absence of DNA and in the presence of G:C and G:T DNA, respectively. The small 2–3-fold increase in Km with G:T DNA may reflect a mismatched DNA-specific effect on Msh2-Msh6, but since Km is a function of multiple rate constants in the ATPase pathway, it cannot reveal exactly which step(s) changes in response to the mismatch. These results further highlight the necessity of pre-steady-state experiments to define intermediate steps in the ATPase pathway and thereby clarify exactly how ATPase activity might be coupled with DNA binding and mismatch recognition.
DNA Binding–ATPase Link: Pre-Steady-State Analysis of Msh2-Msh6 ATPase Reveals a Striking Suppression of ATP Hydrolysis–Specifically by Mismatched DNA
Rapid chemical quench experiments were used first to measure Msh2-Msh6-catalyzed ATP hydrolysis in one turnover (the experiments were performed at 20 °C to lower slightly the reaction rate for more accurate measurement). In the absence of DNA, we see a burst of ADP formation followed by a linear steady-state phase in the first turnover, indicating a turnover-limiting step after ATP hydrolysis (burst rate = 1.9 s−1; kcat = 0.12 s−1 from velocity/[Msh2-Msh6]; Figure 5A, 500 μM ATP). Similar kinetics are observed for Msh2-Msh6 preincubated with G:C DNA (burst rate = 2–3 s−1 from multiple experiments; kcat = 0.12 s−1; Figure 5B, 500 μM ATP). Thus, matched DNA does not appear to change Msh2-Msh6 ATPase activity (note: we expect to measure the activity of Msh2-Msh6·G:C complex since Msh2-Msh6 is preincubated with excess G:C DNA, but it is also likely that the complex is unstable (see Figure 2A), and Msh2-Msh6 releases G:C rapidly and hydrolyzes ATP just as in the absence of DNA).
Figure 5.

Mismatched DNA binding to Msh2-Msh6 suppresses ATP hydrolysis. Pre-steady-state acid quench assays were performed at 20 °C with 2 μM Msh2-Msh6 and 0–500 μM α32P-ATP, ± 3 μM DNA. (A) A representative ATPase time course in the absence of DNA and with 500 μM ATP shows a burst of ATP hydrolysis, with burst rate 1.9 s−1, amplitude 1.6 μM, and turnover rate 0.12 s−1. (B) The ATPase kinetics are nearly identical with G:C DNA. (C) With G:T DNA, however, only a linear 0.1 s−1 rate is observed. (D) ATP dependence of the kinetic parameters fit to a hyperbola yields a maximum burst rate of 3 and 4 s−1 and apparent Kd = 73 and 100 μM and (E) maximum burst amplitude of 2.3 and 1.7 μM and apparent Kd = 160 and 70 μM for Msh2-Msh6 alone or in the presence of G:C DNA, respectively (fit shown only for no DNA condition, for clarity).
When Msh2-Msh6 is preincubated with DNA containing a G:T mismatch, the ATPase kinetics are dramatically different. The burst phase is eliminated, and only a linear phase at 0.1 s−1 is observed (Figure 5C, 500 μM ATP). Thus, G:T binding alters the Msh2-Msh6 ATPase mechanism, such that ATP hydrolysis or an event prior to hydrolysis becomes rate-limiting. The new rate may reflect slow/weak ATP binding to Msh2-Msh6·G:T DNA (i.e., Msh2-Msh6 is predominantly in ATP-free state) or it may reflect a delay in ATP hydrolysis (i.e., Msh2-Msh6·G:T complex remains predominantly in ATP-bound state).
For Msh2-Msh6 alone and with G:C DNA, the burst rate increases with ATP concentration to maximum 3 and 4 s−1, respectively, which is 30–40-fold faster than hydrolysis in the presence of G:T DNA (Figure 5C), and the data fit to a hyperbola yield apparent Kd values of 73 and 100 μM, respectively (Figure 5D, fit shown for data with no DNA). ATP dependence of the burst amplitude yields apparent Kd values of 160 and 70 μM for Msh2-Msh6 with no DNA and G:C DNA, respectively (Figure 5E, fit shown for data with no DNA). These values are substantially higher than the apparent Kd value of 7–15 μM measured by membrane filtration (Figure 3A). Implications of this apparent weak affinity of Msh2-Msh6 for hydrolyzable ATP are considered further in the Discussion.
The burst amplitude reflects the concentration of ATPase active sites on Msh2-Msh6. In these experiments, the burst amplitude reaches 2.3 and 1.7 μM for Msh2-Msh6 alone and in the presence of G:C DNA, respectively (Figure 5E). This value is half of that expected from the concentration of Msh2-Msh6 in the reaction (2 μM Msh2-Msh6 = 4 μM ATP sites) and implies that (a) a significant fraction of Msh2-Msh6 is inactive; (b) if formed, the Msh2-Msh6·(ATP)2 complex partitions between the forward (ATP hydrolysis) and the reverse (ATP dissociation) reactions; (c) only one subunit, Msh2 or Msh6, hydrolyzes ATP rapidly. Figure 3 indicates that Msh2-Msh6 is fully active for binding ATPγS (i.e., two ATPγS bind per Msh2-Msh6 complex); therefore, the latter possibilities were explored further in pulse-chase experiments.
DNA Binding–ATPase Link: Mismatched DNA Does Not Alter the Rate of ATP Binding to Msh2-Msh6
Pulse-chase experiments were performed primarily to distinguish whether G:T DNA binding to Msh2-Msh6 affects the ATP binding or hydrolysis step in the reaction. Msh2-Msh6 was mixed rapidly with α32P-ATP and chased after varying times with 20–100-fold excess unlabeled ATP over 5–6 turnovers. During the chase, bound α32P-ATP may be hydrolyzed to α32P-ADP + Pi or released into solution. Unbound α32P-ATP is diluted with unlabeled ATP; therefore, the experiment measures rate of formation of Msh2-Msh6·ATP complex and the fraction of complex that proceeds to ATP hydrolysis.
In the absence of DNA, we observe a burst of ATP hydrolysis at 29 s−1 and 2 μM amplitude (Figure 6A, 500 μM ATP). The rate increases linearly with ATP concentration and yields an apparent bimolecular rate constant of 4 × 10⁴ M−1 s−1 for ATP binding to Msh2-Msh6 (Figure 6D). The burst amplitude increases with ATP concentration to 2.2 μM maximum (Figure 6E), which is still half of the ATP site concentration in the reaction. Thus, only half of the ATP bound to Msh2-Msh6 appears to undergo rapid hydrolysis in one turnover. This result is considered further in the Discussion.
Figure 6.

Msh2-Msh6 binds ATP rapidly–free or in complex with DNA. Pre-steady-state pulse-chase assays were performed with 2 μM Msh2-Msh6 and 0–500 μM α32P-ATP, ± 3 μM DNA, and 5 mM unlabeled Mg2+-ATP chase (for 35 s after 0.01–5 s reaction times). Representative time courses with 500 μM ATP show that Msh2-Msh6 binds ATP rapidly, (A) in the absence of DNA and (B) in the presence of G:C or (C) G:T DNA. (D) ATP dependence of the burst rate yields a bimolecular ATP binding constant ~0.1 μM−1 s−1. (E) ATP dependence of the burst amplitude yields maximum 2 μM ATP hydrolyzed rapidly in one turnover (fit shown only for Msh2-Msh6·G:T DNA, for clarity).
Experiments with G:C DNA yield similar results: ATP binds Msh2-Msh6·G:C DNA at 9 × 10⁴ M−1 s−1 and 2.1 μM maximum burst amplitude (Figure 6B, 500 μM ATP; Figure 6D; Figure 6E). Interestingly, Msh2-Msh6 bound to G:T DNA exhibits the same kinetics for ATP binding at 7.7 × 10⁴ M−1 s−1 and 2 μM maximum burst amplitude (Figure 6C, 500 μM ATP; Figure 6D; Figure 6E). Thus, interaction between Msh2-Msh6 and mismatched DNA does not alter the kinetics of ATP binding–which implicates a step after binding and prior to (or at) ATP hydrolysis as the rate-limiting step in the ATPase reaction catalyzed by the Msh2-Msh6·mismatched DNA complex.
DNA Binding–ATPase Link: Single Base Insertion in DNA Similarly Stabilizes Msh2-Msh6 in an ATP-Bound State
Several reports in the literature suggest that in addition to single base pair mismatches, Msh2-Msh6 has a high affinity for single nucleotide insertion/deletions in duplex DNA relative to fully matched DNA (19). We extended our study of Msh2-Msh6 with DNA containing a single T insertion to investigate whether other DNA distortions recognized by Msh2-Msh6 have similar effects on the protein as a base pair mismatch. In Figure 7A, a gel mobility shift experiment shows that Msh2-Msh6 forms a complex with +T DNA, similar to that observed with G:T DNA (Figure 2C). Similarly, Figure 7B shows that the Msh2-Msh6·+T complex binds two ATPγS molecules with differing affinities (Kd(1) = 5 μM and Kd(2) = 20 μM), as observed for Msh2-Msh6 free, or in complex with G:C or G:T DNA (Figure 3). The +T DNA substrate also appears to stimulate the steady-state ATPase activity of Msh2-Msh6 similar to G:T DNA (kcat = 0.44 s−1, Km = 25 μM, at 110 mM NaCl and 25 °C; data not shown). Next, pre-steady-state analysis of ATP binding (pulse-chase experiment) and ATP hydrolysis (rapid quench experiment) was performed with Msh2-Msh6 and +T DNA at saturating ATP concentration (500 μM). The results, in Figure 7C, show that the Msh2-Msh6·+T complex binds ATP rapidly and hydrolyzes one ATP molecule (1.6 × 10⁵ M−1 s−1 rate and 2.1 μM maximum burst amplitude); however, the hydrolysis proceeds without a burst, and the linear ATP hydrolysis rate of 0.3 s−1, although slightly higher than that observed for Msh2-Msh6·G:T complex (0.1 s−1, Figure 5C), is 10–15-fold lower than the burst of ATP hydrolysis observed for Msh2-Msh6 alone or in the presence of fully matched G:C DNA (Figure 5B,C). Thus, interaction between Msh2-Msh6 and DNA containing either a single base pair mismatch or single base insertion alters the ATPase mechanism such that a step after ATP binding but before/at ATP hydrolysis becomes rate-limiting.
Figure 7.
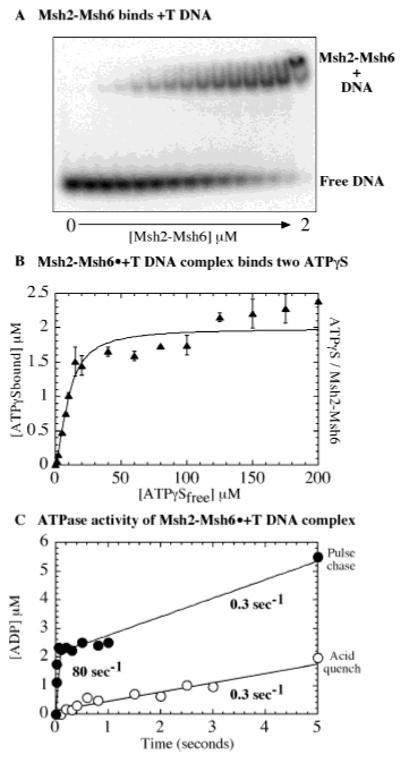
Msh2-Msh6 binding to DNA with a single base insertion has similar effects as mismatched DNA. (A) A gel mobility shift assay of 0.5 μM 32P-DNA with 0–2 μM Msh2-Msh6 shows formation of Msh2-Msh6·+T complex. (B) Two γ35S-ATPγS molecules bind Msh2-Msh6·+T complex with differing affinities: Kd(1) = 5.3 ± 2.4 μM and Kd(2) = 20 ± 7 μM. (C) Msh2-Msh6·+T complex binds ATP rapidly (●), with a bimolecular rate constant 0.16 μM−1 s−1 and burst amplitude 2.1 μM, and hydrolyzes ATP slowly (○) at a rate of 0.3 s−1.
DISCUSSION
MutS/Msh mismatch repair proteins recognize defects in DNA and use ATP to couple recognition events to downstream repair events. They belong to the ATP-binding cassette superfamily of proteins containing multiple subunits with Walker A and B motifs that are essential for activity (26). Disruption of these ATP motifs leads to elevated mutation rates in prokaryotic and eukaryotic organisms because of loss of mismatch repair activity (12, 27). Notably, some germline mutations in human Msh2 or Msh6 characterized by predisposition to hereditary nonpolyposis colorectal cancer are missense Walker motif mutations (3). Thus, knowledge of how these proteins utilize ATP is critical for deciphering their action in mismatch repair.
The ATPase activity of bacterial (E. coli, Thermus aquaticus MutS) and eukaryotic (S. cerevisiae, human Msh2-Msh6) mismatch recognition proteins has been examined extensively under steady-state conditions, both in the absence and in the presence of DNA substrates (12, 15, 24, 28). In general, matched and mismatched DNA substrates appear to stimulate the steady-state ATPase rate, although the extent of stimulation varies with the protein source and assay conditions (e.g., NaCl, temperature). Here, we report an extensive pre-steady-state analysis of the ATPase activity of the S. cerevisiae Msh2-Msh6 mismatch recognition complex. We find that mismatched DNA (G:T mismatch and +T insertion) in fact suppresses Msh2-Msh6-catalyzed ATP hydrolysis to a level 30–40-fold lower than that in the absence of DNA or in the presence of fully matched DNA. The data also provide explicit evidence for asymmetry within the Msh2 and Msh6 subunits for both ATP binding and hydrolysis, which likely correlates with the observed asymmetry in interaction of MutS homodimer subunits with a mismatch (9, 10) and possible asymmetry in subunit action during DNA mismatch repair.
We produced the large amounts of Msh2-Msh6 complex necessary for good signal-to-noise ratios in the first turnover (at high ATP concentrations ≥5 × Km) by expressing the proteins in E. coli cells coproducing tRNAs used rarely in E. coli. Extended biochemical and biophysical analyses of eukaryotic proteins are generally constrained by difficulties in procuring large quantities of these proteins in pure form. The ease and success of the above strategy for large-scale production of pure, active Msh2-Msh6 (a 249 kDa eukaryotic multi-protein complex), and recent reports of similar success with S. cerevisiae Replication Factor C (a five-protein, 250 kDa complex), should encourage such analyses of yet other eukaryotic protein complexes (21, 29, 30).
Mismatched Base Pair or Single Base Insertion Modulates ATP Hydrolysis by Msh2-Msh6
Msh2-Msh6, free or in the presence of matched DNA, binds and hydrolyzes ATP rapidly (on rate = 0.04–0.09 × 10⁶ M−1 s−1; hydrolysis rate = 3–4 s−1) and then undergoes a slow step limiting catalytic turnover (kcat = 0.1–0.2 s−1). For many ATP-hydrolyzing enzymes, this slow step is linked to the release of products from the active site. We have observed one ADP molecule dissociating from S. cerevisiae Msh2-Msh6 at 0.1–0.2 s−1 (24 °C; data not shown), suggesting that this might be the rate-limiting step in the pathway. ADP release is also proposed to limit the ATPase turnover rate of human Msh2-Msh6 (24). Thus, in the absence of DNA or in the presence of matched DNA, Msh2-Msh6 exists predominantly in an ADP-bound state (or an ATP + ADP-bound state; see discussion on Msh2-Msh6 asymmetry below). When bound to DNA containing a G:T mismatch, Msh2-Msh6 still binds ATP rapidly (on rate = 0.08 × 10⁶ M−1 s−1), but hydrolysis of ATP is reduced to 0.1 s−1 from 3 to 4 s−1. Thus, when it is in complex with mismatched DNA, Msh2-Msh6 exists predominantly in an ATP-bound state.
An important earlier study of E. coli MutS provided the first evidence for suppression of burst ATPase kinetics by mismatch recognition proteins in the presence of mismatched DNA (although the burst amplitude in the absence of DNA was extremely low–1/15th the concentration of MutS in the assay) (31). The report also did not clarify whether the rate of ATP binding or ATP hydrolysis was suppressed; therefore, it is not clear whether the MutS·mismatched DNA complex is stabilized in an ATP-free or ATP-bound state. However, given high sequence and structural homology between E. coli and S. cerevisiae repair proteins, it is likely that E. coli MutS is also stabilized in an ATP-bound state by mismatched DNA. In fact, this mechanism likely generalizes to other prokaryotes, given our recent observation that mismatched DNA suppresses ATP hydrolysis catalyzed by T. aquaticus MutS protein (Hingorani, M. and Yang, W., unpublished data). Furthermore, these initial indications that the mismatch recognition and ATPase activities are linked similarly in prokaryotic and S. cerevisiae proteins imply that this mechanism may apply to the homologous human mismatch repair proteins.
Asymmetry in Msh2 and Msh6 ATP Binding and Hydrolysis Activities
The quantitative nucleotide binding assays reveal that both Msh2 and Msh6 bind the nucleotide but with differing affinities. This property is manifested as 3–5-fold tighter binding of one ATPγS molecule over another and detection of only one ATP binding to Msh2-Msh6 (Figure 3). Likely explanations for the discrepancy between ATPγS and ATP binding data are that the second ATP binding event is too weak for detection in the membrane filtration assay or that the second ATP molecule is hydrolyzed, and release of the ADP from Msh2-Msh6 renders it invisible (consistent with this hypothesis, we observe only one ADP binding to Msh2-Msh6).
Pre-steady-state ATPase data support and extend these observations. Pulse-chase experiments yield a burst amplitude of 2 μM instead of the 4 μM expected for hydrolysis of two ATP molecules (Figures 6 and 7). Since, according to the ATPγS binding data in Figure 3, Msh2-Msh6 appears fully active for binding nucleotides, the reduced amplitude in pulse-chase experiments could result from (a) inadequate ATP concentration to saturate both sites on Msh2-Msh6; (b) weak binding/rapid dissociation of ATP from Msh2-Msh6; and (c) weak binding/rapid dissociation of ATP from only one subunit–Msh2 or Msh6. The ATP hydrolysis rate is maximal at the high ATP concentrations tested, which implicates reasons other than (a) for the submaximal burst amplitude (Figure 5: 500 μM ATP > 10Km). ATP dependence of the hydrolysis rate and amplitude yields a weak apparent Kd in the range of 100 μM for ATP, and y intercepts from the pulse-chase data in Figure 6D yield an ATP off-rate of roughly 10 s−1 and koff/kon = 10/0.1 = 100 μM Kd (this apparent Kd value may reflect the true dissociation constant if the ATP binding step is in rapid equilibrium). Rapid ATP dissociation at 10 s−1 relative to ATP hydrolysis at 3 s−1 is consistent with partitioning of Msh2-Msh6·ATP between ATP hydrolysis and ATP release and consequent submaximal burst amplitude (i.e., hypothesis (b)). Hypothesis (c) is a refinement of (b) as it proposes weak ATP binding/ATP dissociation at only one of the two subunits. Notably, the amplitude of ATP (or ADP) is precisely and consistently half of that expected from the concentration of Msh2-Msh6 in the reaction–even in membrane filtration and ATPase experiments performed at different temperatures (data not shown). Moreover, the binding experiments yield an apparent Kd of ~10 μM for one ATP, which is significantly different from the apparent Kd of ~100 μM for one ATP obtained from the ATPase experiments (Figures 3A, 5, and 6). Assuming both Kd measurements are correct, a simple interpretation is that Msh2 and Msh6 each bind ATP (one with low and one with high affinity), but only the low affinity site hydrolyzes ATP rapidly. It is also possible, however, that the high affinity site hydrolyzes ATP, but the reaction requires ATP bound to the low affinity site. In either case, the evidence suggests that the Msh2-Msh6 complex binds two ATP molecules and rapidly hydrolyzes one, while the other is hydrolyzed slowly or not hydrolyzed at all. The fate of the second ATP molecule bound to Msh2-Msh6 may be linked to later events in DNA repair; for example, interaction with MutL/Mlh proteins or DNA replication proteins such as PCNA. The possibility of analyzing even larger protein complexes than Msh2-Msh6, such as Msh-Mlh heterotetramers, by transient kinetic methods is exciting as it promises explicit determination of the purpose of multiple ATP binding and hydrolysis events during mismatch repair. The distinct asymmetry in ATP binding and hydrolysis activities of Msh2 and Msh6 we have shown here is in agreement with known asymmetry in mismatch recognition by the prokaryotic MutS homodimer (9, 10) and differential effects of Msh2 and Msh6 ATPase mutants on the steady-state ATPase activity of Msh2-Msh6 complex (12, 22, 32). In-solution assays to directly measure equilibrium and kinetic constants for ATP binding to Msh2-Msh6 and pre-steady-state assays of mixed wild-type-ATPase mutant Msh2-Msh6 complexes are underway to rigorously test the hypothesis of asymmetric ATPase activity.
Model for Initial Events in DNA Repair Following Mismatch Recognition by Msh2-Msh6
Numerous reports indicate that Msh2-Msh6 binds proteins such as MutL homologues and PCNA in the vicinity of the mismatch (5, 14, 17, 33-35). These interactions are thought to link the mismatch recognition event with initiation of DNA repair (for example, communication between Msh2-Msh6 and PCNA could direct excision to a 3′-OH terminus). The finding that ATPγS facilitates formation of the ternary Msh2-Msh6·Mlh1-Pms1·mismatched DNA complex (17) presents an important possible function for the mismatch induced ATP-bound state of Msh2-Msh6. As depicted in the schematic in Figure 8, longer residence time of ATP on Msh2-Msh6 would increase the likelihood of its interaction/communication with other repair proteins, whether Msh2-Msh6 remains bound specifically at the mismatch or moves away from it (note: the cartoon structure of Msh2-Msh6 heterodimer is based on the crystal structure of MutS homodimer; refs 9 and 10).
Figure 8.
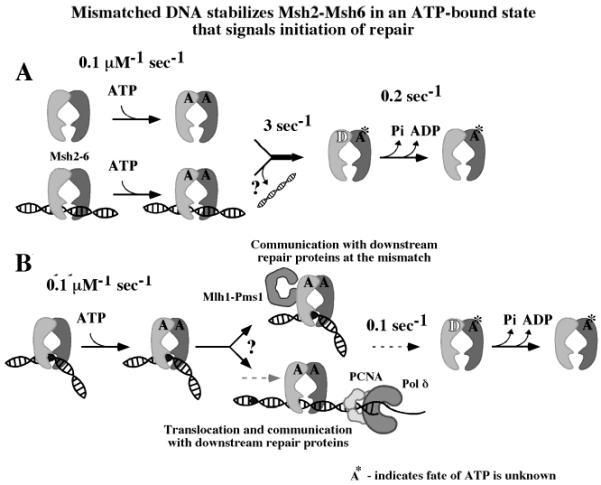
Implications of the delay in Msh2-Msh6-catalyzed ATP hydrolysis upon binding mismatched DNA. (A) In the absence of DNA or in complex with matched DNA, Msh2-Msh6 binds ATP, and one site hydrolyzes ATP rapidly and thereby exists predominantly in an ADP-bound state. (B) When in complex with mismatched DNA, Msh2-Msh6 binds ATP rapidly but hydrolyzes it very slowly and thereby exists predominantly in an ATP-bound state. This change can increase the probability of Msh2-Msh6 binding downstream proteins to signal repair, either through higher-order complex formation at the mismatch or by movement of Msh2-Msh6 on DNA.
Figure 8 does not depict the fate of the second ATP molecule (A*), which may remain on Msh2-Msh6, dissociate, or hydrolyze slowly. The proposed asymmetry in ATP binding and hydrolysis activities of Msh2 and Msh6 subunits predicts a mixed ATP + ADP bound Msh2-Msh6 intermediate in the reaction pathway (Figure 8). A report, currently in press, from the Modrich research group uses elegant FRET experiments to show that the E. coli MutS homodimer can indeed bind one ATP and one ADP molecule simultaneously (36). The crystal structure of E. coli MutS with ADP bound to one monomer while the other is empty may also reflect an asymmetric intermediate in the ATPase reaction pathway (10, 37). In the eukaryotic complex, it is not clear which subunit–Msh2 or Msh6–hydrolyzes ATP rapidly in the burst phase and is suppressed upon interaction with a mismatched base pair. Previous studies of S. cerevisiae and human Msh2-Msh6 containing mutations in the Walker ATP-binding/hydrolysis sites revealed differences in steady-state turnover rates between Msh2 mutant-containing versus Msh6 mutant-containing complexes. These differences were also thought to reflect asymmetry in the ATPase activities of the two subunits (12, 22, 32). The precise source and functional outcome of asymmetry awaits clarification through pre-steady-state analysis of mixed mutant-wild-type Msh2-Msh6 complexes and analysis of higher order mismatch repair protein complexes.
ACKNOWLEDGMENT
We thank Mike O’Donnell (The Rockefeller University) for the generous gift of pLANT2/RIL vector.
Footnotes
This work was supported by a grant from the N.I.H. (GM 64514-01).
- Msh
- Mut S homologue
- ATP
- adenosine 5′-triphosphate
- ATPγS
- adenosine 5′-O-(3-thiotriphosphate)
- ADP
- adenosine 5′-diphosphate
- nt
- nucleotide
REFERENCES
- 1.Kunkel TA, Bebenek K. Annu. Rev. Biochem. 2000;69:497–529. doi: 10.1146/annurev.biochem.69.1.497. [DOI] [PubMed] [Google Scholar]
- 2.Modrich P, Lahue R. Annu. Rev. Biochem. 1996;65:101–33. doi: 10.1146/annurev.bi.65.070196.000533. [DOI] [PubMed] [Google Scholar]
- 3.Jacob S, Praz F. Biochimie. 2002;84:27–47. doi: 10.1016/s0300-9084(01)01362-1. [DOI] [PubMed] [Google Scholar]
- 4.Kelman Z, O’Donnell M. Annu. Rev. Biochem. 1995;64:171–200. doi: 10.1146/annurev.bi.64.070195.001131. [DOI] [PubMed] [Google Scholar]
- 5.Kleczkowska HE, Marra G, Lettieri T, Jiricny J. Genes Dev. 2001;15:724–36. doi: 10.1101/gad.191201. [DOI] [PMC free article] [PubMed] [Google Scholar]
- 6.Kolodner RD, Marsischky GT. Curr. Opin. Genet. Dev. 1999;9:89–96. doi: 10.1016/s0959-437x(99)80013-6. [DOI] [PubMed] [Google Scholar]
- 7.Jiricny J. EMBO J. 1998;17:6427–36. doi: 10.1093/emboj/17.22.6427. [DOI] [PMC free article] [PubMed] [Google Scholar]
- 8.Genschel J, Bazemore LR, Modrich P. J. Biol. Chem. 2002;277:13302–11. doi: 10.1074/jbc.M111854200. [DOI] [PubMed] [Google Scholar]
- 9.Obmolova G, Ban C, Hsieh P, Yang W. Nature. 2000;407:703–10. doi: 10.1038/35037509. [DOI] [PubMed] [Google Scholar]
- 10.Lamers MH, Perrakis A, Enzlin JH, Winterwerp HH, de Wind N, Sixma TK. Nature. 2000;407:711–7. doi: 10.1038/35037523. [DOI] [PubMed] [Google Scholar]
- 11.Guarne A, Junop MS, Yang W. EMBO J. 2001;20:5521–31. doi: 10.1093/emboj/20.19.5521. [DOI] [PMC free article] [PubMed] [Google Scholar]
- 12.Studamire B, Quach T, Alani E. Mol. Cell Biol. 1998;18:7590–601. doi: 10.1128/mcb.18.12.7590. [DOI] [PMC free article] [PubMed] [Google Scholar]
- 13.Gradia S, Acharya S, Fishel R. Cell. 1997;91:995–1005. doi: 10.1016/s0092-8674(00)80490-0. [DOI] [PubMed] [Google Scholar]
- 14.Schofield MJ, Nayak S, Scott TH, Du C, Hsieh P. J. Biol. Chem. 2001;276:28291–9. doi: 10.1074/jbc.M103148200. [DOI] [PubMed] [Google Scholar]
- 15.Blackwell LJ, Martik D, Bjornson KP, Bjornson ES, Modrich P. J. Biol. Chem. 1998;273:32055–62. doi: 10.1074/jbc.273.48.32055. [DOI] [PubMed] [Google Scholar]
- 16.Grilley M, Welsh KM, Su SS, Modrich P. J. Biol. Chem. 1989;264:1000–4. [PubMed] [Google Scholar]
- 17.Habraken Y, Sung P, Prakash L, Prakash S. J. Biol. Chem. 1998;273:9837–41. doi: 10.1074/jbc.273.16.9837. [DOI] [PubMed] [Google Scholar]
- 18.Junop MS, Obmolova G, Rausch K, Hsieh P, Yang W. Mol. Cell. 2001;7:1–12. doi: 10.1016/s1097-2765(01)00149-6. [DOI] [PubMed] [Google Scholar]
- 19.Marsischky GT, Kolodner RD. J. Biol. Chem. 1999;274:26668–82. doi: 10.1074/jbc.274.38.26668. [DOI] [PubMed] [Google Scholar]
- 20.Alani E. Mol. Cell Biol. 1996;16:5604–15. doi: 10.1128/mcb.16.10.5604. [DOI] [PMC free article] [PubMed] [Google Scholar]
- 21.Finkelstein J, Antony EA, Hingorani MM, O’Donnell M. Anal. Biochem. 2003 doi: 10.1016/s0003-2697(03)00273-2. in press. [DOI] [PubMed] [Google Scholar]
- 22.Iaccarino I, Marra G, Palombo F, Jiricny J. EMBO J. 1998;17:2677–86. doi: 10.1093/emboj/17.9.2677. [DOI] [PMC free article] [PubMed] [Google Scholar]
- 23.Gilbert SP, Mackey AT. Methods. 2000;22:337–54. doi: 10.1006/meth.2000.1086. [DOI] [PubMed] [Google Scholar]
- 24.Gradia S, Acharya S, Fishel R. J. Biol. Chem. 2000;275:3922–30. doi: 10.1074/jbc.275.6.3922. [DOI] [PubMed] [Google Scholar]
- 25.Bowers J, Tran PT, Liskay RM, Alani E. J. Mol. Biol. 2000;302:327–38. doi: 10.1006/jmbi.2000.4081. [DOI] [PubMed] [Google Scholar]
- 26.Hopfner KP, Tainer JA. Structure Fold Des. 2000;8:R237–41. doi: 10.1016/s0969-2126(00)00545-1. [DOI] [PubMed] [Google Scholar]
- 27.Haber LT, Walker GC. EMBO J. 1991;10:2707–15. doi: 10.1002/j.1460-2075.1991.tb07815.x. [DOI] [PMC free article] [PubMed] [Google Scholar]
- 28.Biswas I, Hsieh P. J. Biol. Chem. 1996;271:5040–8. doi: 10.1074/jbc.271.9.5040. [DOI] [PubMed] [Google Scholar]
- 29.Gomes XV, Gary SL, Burgers PM. J. Biol. Chem. 2000;275:14541–9. doi: 10.1074/jbc.275.19.14541. [DOI] [PubMed] [Google Scholar]
- 30.Hingorani MM, Coman MM. J. Biol. Chem. 2002;277:47213–24. doi: 10.1074/jbc.M206764200. [DOI] [PMC free article] [PubMed] [Google Scholar]
- 31.Bjornson KP, Allen DJ, Modrich P. Biochemistry. 2000;39:3176–83. doi: 10.1021/bi992286u. [DOI] [PubMed] [Google Scholar]
- 32.Drotschmann K, Yang W, Kunkel TA. DNA Repair. 2002;1:743–53. doi: 10.1016/s1568-7864(02)00081-2. [DOI] [PubMed] [Google Scholar]
- 33.Plotz G, Raedle J, Brieger A, Trojan J, Zeuzem S. Nucleic Acids Res. 2002;30:711–8. doi: 10.1093/nar/30.3.711. [DOI] [PMC free article] [PubMed] [Google Scholar]
- 34.Gu L, Hong Y, McCulloch S, Watanabe H, Li GM. Nucleic Acids Res. 1998;26:1173–8. doi: 10.1093/nar/26.5.1173. [DOI] [PMC free article] [PubMed] [Google Scholar]
- 35.Flores-Rozas H, Clark D, Kolodner RD. Nat. Genet. 2000;26:375–8. doi: 10.1038/81708. [DOI] [PubMed] [Google Scholar]
- 36.Bjornson KP, Modrich P. J. Biol. Chem. 2003 doi: 10.1074/jbc.M301101200. in press. [DOI] [PubMed] [Google Scholar]
- 37.Lamers MH, Winterwerp HH, Sixma TK. EMBO J. 2003;22:746–56. doi: 10.1093/emboj/cdg064. [DOI] [PMC free article] [PubMed] [Google Scholar]