

Abstract
BACKGROUND
Oxytocin (OT) is produced by granulosa cells (GCs) of pre-ovulatory ovarian follicles and the corpus luteum (CL) in some mammalian species. Actions of OT in the ovary have been linked to luteinization, steroidogenesis and luteolysis. Human IVF-derived (h)GCs possess a functional OT receptor (OTR), linked to elevation of intracellular Ca2+, but molecular identity of the receptor for OT in human granulosa cells (hGCs) and down-stream consequences are not known.
METHODS AND RESULTS
RT–PCR, sequencing and immunocytochemistry identified the genuine OTR in hGCs. OT (10 nM–10 µM) induced elevations of intracellular Ca2+ levels (Fluo-4 measurements), which were blocked by tocinoic acid (TA; 50 µM, a selective OTR-antagonist). Down-stream effects of OTR-activation include a concentration dependent decrease in cell viability/metabolism, manifested by reduced ATP-levels, increased caspase3/7-activity (P < 0.05) and electron microscopical signs of cellular regression. TA blocked all of these changes. Immunoreactive OTR was found in the CL and GCs of large and, surprisingly, also small pre-antral follicles of the human ovary. Immunoreactive OTR in the rhesus monkey ovary was detected in primordial and growing primary follicles in the infantile ovary and in follicles at all stages of development in the adult ovary, as well as the CL: these results were corroborated by RT–PCR analysis of GCs excised by laser capture microdissection.
CONCLUSIONS
Our study identifies genuine OTRs in human and rhesus monkey GCs. Activation by high levels of OT leads to cellular regression in hGCs. As GCs of small follicles also express OTRs, OT may have as yet unkown functions in follicular development.
Keywords: oxytocin, vasopressin, follicle, calcium, apoptosis
Introduction
Oxytocin (OT) is best known as a neurohypophyseal peptide of nine amino acids synthesized in the mammalian hypothalamus and released from the neural lobe of the pituitary into the circulation. Known sites of action are the myometrium and myoepithelial cells of the mammary gland, where OT stimulates contraction. However, the presence of OT in thymus (Cross and Leng, 1993), adrenal gland (Durr, 1987) and ovarian luteal cells in mammals (Stormshak, 2003; Dawood and Khan-Dawood, 1986) was reported, implying additional, unexplored roles for this hormone.
With respect to ovary, it has been suggested that locally produced OT is important mainly for the corpus luteum (CL) (Gimpl and Fahrenholz, 2001; Stormshak, 2003). Although studies with bovine ovaries showed that OT expression is first detected in pre-ovulatory follicles (Voss and Fortune, 1991), luteal functions, ranging from steroid production to luteolysis depending on the species studied, were found to be affected by OT (Wathes et al.,1982; Khan-Dawood and Dawood, 1983; Okuda et al., 1997; Dawood and Khan-Dawood, 2008).
Although OT has been unequivocally identified in ovine, bovine, porcine, goat, monkey (baboon and cymologous monkey) and human ovary (Dawood and Khan-Dawood, 1986, 2008; Ivell et al., 1990; Furuya et al., 1995; Stormshak, 2003), the molecular identity of ovarian OTRs remains to be established. This is of importance because the genuine oxytocin receptor (OTR) is closely related to vasopressin (VP) receptors (V1a, V1b, V2), and OT can cross-activate VP receptors to a significant degree (Peter et al., 1995). Recently, evidence for expression of V1a and V2 in human ovary was provided, but to our knowledge, the precise sites of their expression have not been investigated (Monstein et al., 2008).
Evidence for ovarian OTRs has been provided by different approaches in several species. For example, immunohistochemistry was performed in marmosets (Einspanier et al., 1994, 1997), RT–PCR and radioligand binding assay in bovine (Okuda et al., 1997), porcine OT binding sites were demonstrated by using a radioiodinated OT antagonist as the ligand (Pitzel et al., 1993) and finally, RT–PCR and immunocytochemistry were performed in human samples (Furuya et al., 1995).
In general, these studies indicated that the sites of OTR expression are granulosa cells (GCs; Okuda et al., 1997), including cumulus cells (Furuya et al., 1995) of the antral pre-ovulatory follicle and the cells of the CL (Pitzel et al. 1993; Furuya et al., 1995; Einspanier et al., 1997). Consistent with these localizations is the assumption of a role in luteinization and/or luteolytic actions of OT, as reported for example in the rhesus monkey (Auletta et al., 1984).
The local ovarian OT/OTR system can also be studied in isolated GCs (Plevrakis et al., 1990; Mayerhofer et al., 1993; Copland et al., 2002). For instance, human (h)GCs isolated from the pre-ovulatory follicles of women, secrete OT when cultured, especially upon stimulation with HCG. They also respond to OT, which caused transient elevations of intracellular Ca2+ (Mayerhofer et al., 1993; Copland et al., 2002), as part of the expected OTR signaling cascade. Finally, OT can augment the effects of HCG on progesterone production by cultured human granulosa cells (hGCs), an effect that is dependent on the age of the cultures (Mayerhofer et al., 1993). Beyond these actions the role of OT in the human ovary is not known.
The present study was undertaken to identify the molecular nature of the presumed OTR in hGCs, to test OTR(s) functionality and to determine the biological responses initiated by OTRs.
Materials and Methods
Materials
OT, tocinoic acid (selective peptide OTR antagonist, TA) and staurosporine (ST) were purchased from Sigma (Munich, Germany) and dissolved in H2O to a 1 mM stock concentration. Fetal calf serum (FCS) was from Gibco (Berlin, Germany) and Dulbecco's Modified Eagle's Medium (DMEM), Ham's F-12 medium (1:1) and penicillin/streptomycin were from Sigma.
Human granulosa cells
Follicular fluid, containing hGCs, was obtained from IVF patients stimulated according to routine protocols. The local ethics committee of the Ludwig-Maximilians University of Munich approved the experimental procedure and the use of the cells, and the women gave written consent. Aspirates with cells from two to four patients were pooled for each experiment. Cells were separated by centrifugation at 560g for 3 min and washed in serum-free DMEM/Ham's F-12 medium. Washed cells were suspended in culture medium supplemented with penicillin (100 U/ml), streptomycin (100 µg/ml) and 10% FCS, as previously described (Mayerhofer et al. 1992, 1993, 2006; Bulling et al., 2000; Rey-Ares et al., 2007).
RT–PCR
Total RNA from several batches of cultured hGCs (1, 2, 3, 4 and 5 days after isolation) was prepared using RNeasy kit (Qiagen, Hilden, Germany). As previously described (Rey-Ares et al., 2007), total RNA (200–500 ng) was subjected to RT using random primers (pdN6) and Superscript-RT II (Life Technologies, Karlsruhe, Germany). Commercial human small intestine, brain and ovary complementary DNAs (cDNAs, BD CLONTECH, Inc., Heidelberg, Germany) were used for PCR as controls. PCR steps consisted of 34 cycles of denaturing (at 94°C for 60 s), annealing (at 60°C for 60 s) and extension (at 72°C for 60 s; for primers see Table I). Reaction tubes lacking RT product input were used as PCR controls. In some cases, control reactions, in which cDNA was replaced by RNA, were also performed. The PCR reaction products were separated on 2.0% agarose gels and visualized with ethidium bromide. The identities of all PCR products were verified by direct sequencing, using one of the specific primers. Oligonucleotide primers were designed to span at least one intron. Primers used also match common stretches in the human and monkey OTR mRNA sequences (accession numbers for OTR: Macaca mulatta: nM_001044732, Homo sapiens: nM_000916). RT–PCR results were analyzed by a semi-quantitative approach using co-amplification of cyclophilin.
Table I.
Oligonucleotide primer pairs for RT–PCR using human ovary and cultured human granulosa cells, and following LMD of human ovary sections.
| Receptor type | Primer sequence (5′-3′) | GenBank accession no. |
|---|---|---|
| Cyclophilin-sense | ctc ctt tga gct gtt tgc ag | NM_021130 |
| Cyclophilin-antisense | cac cac atg ctt gcc atc c | NM_021130 |
| OTR-sense | cag cta cct gaa ggg cag ac | NM_000916 |
| OTR-antisense | tgc tac ggc ctt atc agc tt | NM_000916 |
| OT/NPHI-sense | cgc ctg cta cat cca gaa ct | M25 650 |
| OT/NPHI-antisense | ata ttg ggc ccg aag cag | M25 650 |
| V1a-sense | aca gga agc agg act cca ga | NM_000706 |
| V1a-antisense | tca gta ttg tgg ccg tgg ta | NM_000706 |
| V1b-sense | aag gtg gag atc gga gtc ct | NM_000707 |
| V1b-antisense | ctg gaa gcg gta ggt gat gt | NM_000707 |
| V2-sense | ttc atc gtg agg agc tgt ttg | NM_000054 |
| V2-antisense | ata cag ctg ggg atg tgg ag | NM_000054 |
| OTR-LMD-sense | tgc tac ggc ctt atc agc tt | NM_000916 |
| OTR-LMD-antisense | gcc ttg gag atg agc ttg ac | NM_000916 |
| OTR-LMD-nested-sense | tgg cag aac ttg cgg ctc aag | NM_000916 |
OTR, oxytocin receptor; OT/NPHI, oxytocin/neurophysin I gene; V1/V2, vasopressin receptors 1/2.
OTR immunocytochemistry in hGCs
OTR protein in cultured hGCs was examined by immunocytochemistry using a commercially available polyclonal antiserum (rabbit anti-OTR, Sigma, 1:200), as described (Mayerhofer et al., 2006). Cells were cultured on glass cover slips for up to 2 days at low density, fixed [4% paraformaldehyde in 10 mM phosphate-buffered saline (PSB)] and used after rinsing in 10 mM PBS (pH 7.4). Incubations with the antiserum were performed overnight in a humidified chamber at 4°C. After washing steps, a fluorescein isothiocyanate-labeled goat anti-rabbit antiserum was used. For control purposes, the first antiserum was omitted, and incubations with normal rabbit serum were carried out instead. Sections were examined with a Zeiss Axiovert microscope (Zeiss, Oberkochen, Germany), equipped with a fluorescein filter set.
Immunohistochemistry for OTR in monkey and human ovaries
Monkey ovarian sections (post-natal age 0–1 day; adult; the same as used in previous studies, Mayerhofer et al., 2006) and human ovarian sections (from the tissue collection of the Institute of Anatomy and Cell Biology, Munich) were subjected to immunohistochemistry. The same specific OTR antiserum (rabbit anti-OTR, Sigma, 1:200) used for hGCs was used for these tissues, according to the procedure previously reported (Geigerseder et al., 2003; Mayerhofer et al., 2006). In brief, sections of 6 µm were deparaffinized and endogenous peroxidase activity was blocked. Sections were submitted to antigen retrieval by heating in citrate buffer (1.8 mM citric acid, 8.2 mM sodium citrate, pH 6.0) at 90°C for 30 min, followed by a 20 min cooling phase in the same solution. Sections were incubated overnight at 4°C with the antisera followed by a second antibody (anti-rabbit biotinylated gamma globulin; 1:250) (Vector Laboratories, Inc. Burlingame, CA; USA), and avidin–biotin complex peroxidase (ABC, Vector Laboratories). The binding was visualized with 3,3′-diaminobenzidine (DAB, Vector Laboratories). For control purposes the primary antiserum was replaced by buffer or by non-immune serum. Sections were observed with a Zeiss Axiovert microscope.
Laser microdissection and RT–PCR
Human and Monkey ovaries embedded in paraffin were cut into sections (5 µm) and mounted onto a 1.35-µm thin polyethylene naphthalene membrane fixed to a glass slide which had been pretreated with UV light for 30 min. The sections were deparaffinized and processed for laser capture microdissection (LMD) as previously described (Geigerseder et al., 2003). In brief, employing a nitrogen laser of the Robot-MicroBeam (P.A.L.M. GmbH Mikrolaser Technologie, Bernried, Germany), groups of GCs, luteal cells or follicles were circumscribed and thus isolated from the surrounding tissue. This microdissected sample was ejected from the object slide and catapulted directly into the cap of a microfuge tube. Fifty microliter of RNA stabilization reagent (RNeasy Protect Mini-Kit, Qiagen) were added into the cap. Samples were frozen at −70°C until RNA extraction (RNeasy, Qiagen). RT followed by nested PCR amplifications was then performed. The identities of all PCR products were verified by direct sequencing, using one of the specific primers.
Cell viability assay
Cell viability was estimated by measuring ATP content, which correlates with cell number and/or viability (Rey-Ares et al., 2007). For the ATP-assay cells were cultured up to Day 4 and then treated with different concentrations of OT and/or TA for 24 h. For the reaction 100 µl of CellTiter-Glo® reagent (Promega, Mannheim, Germany) were added to each well of a black-walled 96-well plate containing 100 µl of control cells or treated cells. In the dark, contents of wells were mixed on a plate shaker at 500 rpm for 2 min and then incubated for 10 min. The luminescence of each sample was measured in a plate-reading luminometer (BMG LABTECH GmbH, Fluostar, Offenburg, Germany).
Caspase assay
For the caspase assay, which determines activities of the effector caspases 3 and 7, cells were cultured for 4 days and then treated with different concentrations of OT and/or TA for 24 h. ST was used as a positive control. For the reaction 100 µl of Caspase-Glo® 3/7 reagent (Promega) were added to each well of a white-walled 96-well plate containing 100 µl of negative control cells or treated cells. Contents of wells were mixed on a plate shaker at 500 rpm for 30 s and then incubated for 1.5 h. The luminescence of each sample was measured in a plate-reading luminometer (BMG, Fluostar).
Electron microscopy
Ultrastructural details of untreated and treated hGCs were studied by electron microscopy, as previously described (Bulling et al., 2000). Briefly, hGCs (Day 4 in culture) were treated (1 µM OT with/without 50 µM TA for 24 h) and then fixed in 2% glutaraldehyde in cacodylate (pH 7.4). Finally, they were washed, embedded in Epon resin, sectioned and analyzed by electron microscopy (EM10; Carl Zeiss, Oberkochen, Germany).
Calcium monitoring
As described (Mayerhofer et al. 1992, 1993; Rey-Ares et al., 2007), hGCs were grown on glass cover slips. Before measurement, cells were loaded with 5 µM fluo-4, acetoxy-methylester (Invitrogen GmbH, Karlsruhe, Germany) in medium (+10% FCS) at 37°C and 5% CO2 for 30 min. Thereafter, they were washed and transferred into a recording chamber mounted on a TCS SP2 confocal microscope (Leica Microsystems, Wetzlar, Germany). The bath solution contained 140 mM NaCl, 3 mM KCl, 1 mM CaCl2, 1 mM MgCl2, 10 mM Hepes and 10 mM glucose (pH 7.4). Fluorescence was monitored at 500–540 nm (excitation at 488 nm) every 2 s and the intensity was quantified over single cells. Substance application was achieved by means of a distributor-type fuel-injection pump (CHROMAPHOR Analysen-Technik GmbH, Duisburg, Germany).
Statistical analyses
Data were analyzed and depicted using Prism 4 (GraphPad Software, San Diego, CA, USA). Results of cell viability- and caspase-luminescence data were statistically analyzed by repeated-measures analysis of variance followed by the Newman–Keuls multiple comparison post-test. P < 0.05 was considered statistically significant.
Results
Detection of OTR mRNA and protein in hGCs
We found that neither hGCs in culture, nor the ovary as a whole, express V1a/b or V2 mRNA. Expression of all three VP receptors was however found in small intestine (Fig. 1A).
Figure 1.

Demonstration of OTR mRNA and protein.
(A) RT–PCR analysis of vasopressin receptors V1a, V1b and V2 in hGCs, human ovary (Ov) and human small intestine (Int), which served as positive control. (B) Left: RT–PCR analysis of OTR in hGCs cultured in absence or presence of HCG (hCG) and in human ovary (Ov). GCs were treated with control medium (−) or 10 IU/ml HCG for 24 h. Cyclophilin was coamplified as an internal standard. Right: RT–PCR analysis of oxytocin (OT) in hGCs. Control (Co) was without input RNA. (C) Immunocytochemical staining of hGCs (culture Day 3) for OTR and control staining (buffer instead of primary antiserum). Bars = 50 µm.
Using a similar approach followed by sequencing, we found that the genuine OTR is expressed in both the human ovary and hGCs (Fig. 1B). When cells were treated with 10 IU/ml HCG from Day 2 to 5 of culture, OTR mRNA levels were elevated in four of five samples. A similar effect was observed when cells were treated with HCG during either Days 1–3 or 4–5 of culture (not shown). As expected, OT mRNA was found in hGCs. Identities of all amplified products were verified by sequencing.
Immunocytochemical staining of hGCs with an OTR specific antibody confirmed the presence of OTR (Fig. 1C). Staining was predominantly located to the cytoplasm of the majority of cells. Sections incubated with normal rabbit serum instead of OTR antibodies showed no staining. Omission of the primary antiserum also yielded negative results.
OT acts via OTR to elevate intracellular Ca2+ levels
In all cells that exhibited OT-induced Ca2+ signals, the OTR-specific antagonist TA (Peter et al., 1995) virtually completely prevented the OT induced Ca2+ signal (composite Fig. 2 summarizing measurements of 24 cells). This provides strong evidence that OT acts solely via the genuine OTR and not via other related receptors.
Figure 2.
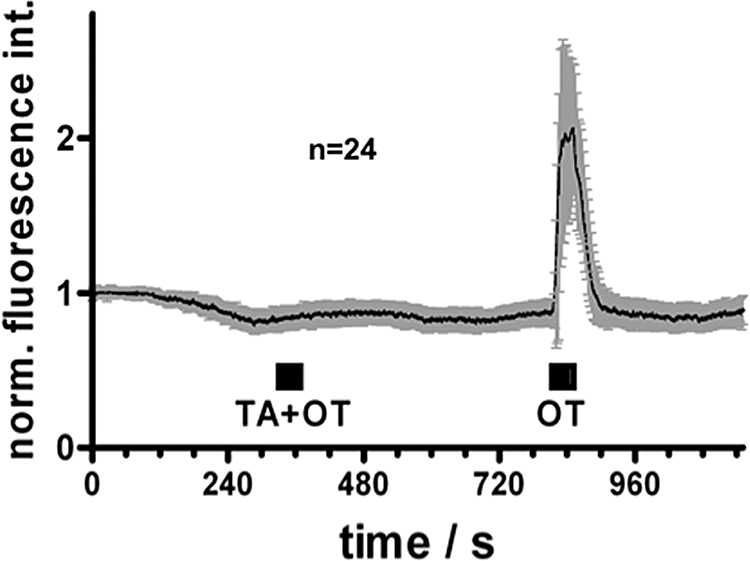
OT and Ca2+-signaling in hGCs: composite figure.
Intracellular Ca2+ levels were monitored during application of 10 nM OT alone or together with the OT antagonist tocinoic acid (TA, 10 µM). Depicted are mean fluorescence values (±SD) of OT-reactive cells (n = 24) normalized to the starting values.
OT acting via OTR reduces cellular ATP-levels and increases caspase 3/7-activities
Treatment of hGCs (Day 4 of culture) with 1 or 10 µM OT for 24 h resulted in decreased cellular ATP-levels, a measure of cell viability (Fig. 3A), whereas lower doses (10–100 nM) had no effect. The blocker TA (50 µM) abolished the inhibitory effect of 1 µM OT (Fig. 3A, lower panel).
Figure 3.

Measurements of intracellular ATP level and caspase 3/7 activity.
(A) Top: Representative example of effects of OT in different concentrations, on cell viability as determined by an ATP assay after a 24 h incubation period with OT (performed on culture Day 4). Each experiment was performed two times and each treatment group represents quadruplicate experiments. Values are the mean ± SEM. *P < 0.01; **P < 0.001. Bottom: Effects of OT (1 µM) and the OTR antagonist TA on cell viability (performed on culture Day 3). Each experiment was performed six times and each treatment group represents quadruplicate experiments. Values are the mean ± SEM. ***P < 0.05. (B) Top: Representative example of effects of OT on caspase 3/7 activity after a 24 h-incubation of hGCs with OT (10 nM–10 µM; performed on culture Day 4). Staurosporine (ST) served as a positive control. Each experiment was performed two times and each treatment group represents quadruplicate experiments. *P < 0.05. Bottom: Effects of OT (1 µM) and/or TA on caspase 3/7 activity. Twenty-four hours incubation with OT and TA (performed on culture Day 4). Each experiment was performed six times and each treatment group represents quadruplicate experiments. *P < 0.05.
Treatment of hGCs (Day 4 of culture) with 1 or 10 µM OT for 24 h caused an increase in caspase 3/7-activity. Lower OT concentrations (10 and 100 nM), had no significant effect (Fig. 3B). OT at 1 µM increased caspase 3/7-activity almost as much as the positive control (1 µM ST; Fig. 3B, lower panel). The addition of 10 µM TA significantly reduced the effects of both 1 and 10 µM OT (Fig. 3B). These results strongly suggest that the negative effect of OT on cell viability is mediated by OTR.
Ultrastructural signs of cellular regression after treatment with OT
Electron microscopical examination of hGCs treated on Day 4 of culture with 1 µM OT for 24 h showed swollen mitochondria and a deformation of the nucleus (Fig. 4A, B with inset), i.e. regressive changes found in cells undergoing apoptosis (Wyllie et al., 1980). In contrast, cells treated with 1 µM OT and 50 µM (TA) (Fig. 4D) showed normal mitochondria and normal nuclei, similar to the untreated control cells (Fig. 4C).
Figure 4.

Electron microscopic examination.
(A and B) Effects of 1 µM OT for 24 h on ultrastructure of hGCs (culture Day 4). Note swollen mitochondria in comparison to control (arrows). (B) Arrow points to the deformed nucleus and the swollen mitochondria. The inset shows the swollen mitochondria. (C) Control hGCs, in normal culture medium. (D) Lack of effect of stimulation with 1 µM OT in the presence of 50 µM TA. Note normal mitochondria in (C) and (D) (arrows).
Identification of multiple sites of OTR expression in the human and monkey ovary: immunohistochemistry and LMD/RT–PCR
Immunohistochemistry using paraffin sections of human ovary containing small pre-antral and large antral follicles (Fig. 5A–C), as well CL, revealed that immunoreactive OTR protein is detectable in GCs or luteal cells, respectively (Fig. 5E–G). These results were put to the test by LMD/RT–PCR studies (Fig. 6). Human GCs from large antral follicles, human CL (not shown) and small pre-antral follicles were isolated and analyzed by RT–PCR. Results of sequence analyses revealed the genuine OTR in all these samples (data not shown).
Figure 5.

Immunohistochemistry for OTR in human ovary.
(A) In paraffin sections of human ovary pre-antral follicles follicles in the cortex stained positive for OTR. Arrows point to a primary and two smaller primordial follicles. Bar ∼25 µm. (B) A primary follicle with OTR-immunoreactive GCs. Bar ∼15 µm. (C) Staining of GCs in a growing small antral follicle. Bar ∼50 µm. (D) Control staining (omission of antiserum). A survey view of the cortex is shown. Bar ∼25 µm. (E) Staining of GCs in a large antral follicle. Bar ∼30 µm. (F) Control corresponding to (E). Bar ∼30 µm. (G) As expected, luteal cells stain positive. Bar ∼30 µm.
Figure 6.

Example of experiments using laser microdissection (LMD) of GCs from sections of human ovaries of human pre-antral (A–C) and a large antral follicle (D–F) followed by RT–PCR.
(A) and (D) show the samples before, (B) and (E) after, excision of GCs, (C) and (F) depict results of RT–PCR experiments with (+) and without input RNA (co).
Similar studies were carried out using sections from adult monkeys, with different follicular stages and CL present, and post-natal monkey ovaries, which contain mainly primordial and early primary follicles (Figs 7 and 8). Again, OTR immunoreactive material was localized to GCs in all stages of follicular development and to luteal cells (Fig. 7). These results were corroborated after LMD/RT–PCR (Fig. 8). The identity of the monkey OTR sequence was confirmed after sequencing of the PCR products (data not shown).
Figure 7.

Immunohistochemistry for OTR in monkey ovaries (A and B: Post-natal Day 0–1; C–E adult). (A) Sections of a monkey ovary from a post-natal animal, which contains immunoreactive small pre-antral follicles (asterisk: primordial; arrow: primary). Bar ∼15 µm. (B) Corresponding control staining to (A) (omission of antiserum). Bar ∼15 µm. (C) Adult monkey ovary: staining of GCs (GCs) in a growing antral follicle is seen, as well as staining in small pre-antral follicles (arrows). Bar ∼15 µm. (D) Control corresponding to approximately. Bar ∼15 µm. (E) As expected, luteal cells stain positive. Bar ∼25 µm.
Figure 8.

Example of experiments in monkey ovary using LMD of GCs from sections of adult ovaries.
A pre-antral (A–C) and a large antral follicle (D–F) were excised, mRNA was extracted and subjected to RT–PCR and sequencing. (A) and (D) show the samples before, (B) and (E) after excision of GCs, (C) and (F) depict OTR expression, as found by RT–PCR with (+) and without input RNA (co). Bar ∼25 µm.
Discussion
The present study reveals that the OTR gene is expressed in both human and monkey GCs and that activation of OTR by OT entails a signaling cascade which includes elevated Ca2+ levels and results in reduced cell viability of hGCs. Furthermore, OTRs were expressed not only in cultured hGCs and GCs of large follicles, as well as the CL, but surprisingly also in GCs of small pre-antral follicles in the non-human primate and human ovary.
Our RT–PCR studies identified OTR, but none of the known VP receptors types (V1a/b and V2) in hGCs. The VP receptors were also not found when human commercial cDNA from ovary was probed. This is in contrast to a previous study, in which commercial cDNA from human ovary was subjected to PCR and the results indicated presence of V1a and V2 mRNAs (Monstein et al., 2008). As expression of VPs by smooth muscle cells (Laszlo et al., 1991; Monstein et al., 2008) can be expected, we assume that different sampling (with or without ovarian vasculature) may account for this discrepancy.
That VPs are absent from, and OTRs are present on hGCs, is furthermore supported by the ability of TA, a selective OTR blocker (Peter et al., 1995), to block OT-induced Ca2+ signaling. Hence these measurements confirmed both functionality and specificity of the OTR in hGCs and support the notion that OT acts solely via the OTR, and not via the receptors for VP in hGCs.
Previous studies showed that primary hGCs, as well as a human GC line and other cells (Mayerhofer et al., 1993; Evans et al., 1997; Copland et al. 1999, 2002), respond to OT, as judged from OT-induced increased intracellular Ca2+ levels. In primary hGCs the magnitude of this response depended on the culture day (Mayerhofer et al., 1993): the percentage of responsive cells increased to a maximum (56–66%) on culture Days 4–5. The reasons for this are not known, but we used cells cultured for 4–5 days for functional studies, i.e. a period of time after which maximal response rates were observed.
Our results show that OT induces a concentration-dependent reduction of cellular ATP-levels, indicative of reduced vitality, and a concomitant increase of caspase 3/7 activities, suggestive of apoptosis. Furthermore, ultrastructural signs of mitochondrial swelling and nuclear disintegration were observed, which suggest regressive changes and/or apoptosis (Wyllie et al., 1980). Because luteinized hGCs resemble large luteal cells, we conclude that OT may also have luteolytic abilities in the human, and not only in ruminants (Okuda et al., 1997) or the rhesus monkey (Auletta et al., 1984).
Our studies show that a high OT concentration (1 µM or higher) was necessary to induce the observed changes. Physiological plasma OT concentrations range from 1 to 4 pM in men and women. In women, there is an increase in plasma OT concentration in midcycle to 8 pM at the time of ovulation (Streeten, 1976; Amico et al., 1981a, b; Durr, 1987; Clayton, 1993; Cross and Leng, 1993). Levels of OT in follicular fluid in normal women are controversial and the values in two reports (Schaeffer et al., 1984; Tjugum et al., 1986) differ. One study reports about 5 nM in follicular fluid of follicles with a 6–14 mm diameter versus 13 nM in 15–20 mm sized follicles. In contrast, about 15-times higher levels were reported by the other group (Schaeffer et al., 1984). Reports of the levels of OT produced by cultured hGCs are not readily comparable (15 pM/105 cells; Plevrakis et al., 1990; versus 12.6–13.8 fmol OT/mg cellular protein after addition of HCG; Mayerhofer et al., 1993). Thus exact levels of OT within the human CL/follicle remain uncertain. As hGCs and the human CL (Khan-Dawood et al., 1989) produce OT, high local levels must be assumed after release, at least in the vicinity of these cells. Hence, effects exerted by OT as observed in our study appear to be of potential biological relevance and support a physiological role in the human ovary.
OTR has previously been detected in the pre-ovulatory follicle and the CL of primates (Khan-Dawood et al., 1988, 1989; Stormshak, 2003). Our study also provided some surprising insights into other cellular sites that express OTR in human and monkey ovaries. Combined immunohistochemical and RNA analyses after LMD revealed OTR presence already in pre-antral, as well as large antral, follicles in human and monkey ovary. In our experiments we observed that small growing follicles, i.e. primary and secondary follicles, were immunopositive in monkey and human. Immunoreactive primordial and primary follicles were also clearly found in post-natal monkey ovary, indicating that GCs in all stages of follicular development are endowed with this receptor.
Studies in other species (Voss and Fortune, 1991; Ivell et al., 1985; Jo and Fortune, 2003) and in the marmoset monkey (Einspanier et al., 1997) or the baboon (Khan-Dawood et al., 1988), do not report OTR expression in small pre-antral follicles, which may therefore be specific for rhesus monkey and human ovary. Whether OTRs in pre-antral follicles are functional and could be activated by blood-borne OT or ovarian OT produced by large follicles and the CL, remains to be determined. Also unknown are the physiological consequences of OTR activation in these small follicles.
Our results, together with previous studies (Stormshak, 2003), indicate that GCs and luteal cells of the human and rhesus monkey ovary are endowed with a functional OT/OTR signaling complex. Although activation of this system in luteal cells may facilitate the luteolytic process that leads to demise of the CL in every menstrual cycle, a role for OT in regulating follicular functions remains to be established.
Funding
This work was supported in parts by grants from DFG MA 1080/17 and NIH grants HD24870 (S.R.O.), the Eunice Kennedy Shriver NICHD/NIH through cooperative agreement HD18185 as part of the Specialized Cooperative Centers Program in Reproduction and Infertility Research (R.S., S.R.O.) and RR00163 for the operation of the Oregon National Primate Research Center (G.A.D., R.S., S.R.O.).
Acknowledgements
The expert technical assistance of Mrs G. Terfloth, Mrs A. Tiefenbacher, Mrs S. Raffael and Mrs A. Domokos are gratefully acknowledged.
References
- Amico JA, Seif SM, Robinson AG. Oxytocin in human plasma: correlation with neurophysin and stimulation with estrogen. J Clin Endocrinol Metab. 1981a;52:988–993. doi: 10.1210/jcem-52-5-988. [DOI] [PubMed] [Google Scholar]
- Amico JA, Seif SM, Robinson AG. Elevation of oxytocin and the oxytocin-associated neurophysin in the plasma of normal women during midcycle. J Clin Endocrinol Metab. 1981b;53:1229–1232. doi: 10.1210/jcem-53-6-1229. [DOI] [PubMed] [Google Scholar]
- Auletta FJ, Paradis DK, Wesley M, Duby RT. Oxytocin is luteolytic in the rhesus monkey (Macaca mulatta) J Reprod Fertil. 1984;72:401–406. doi: 10.1530/jrf.0.0720401. [DOI] [PubMed] [Google Scholar]
- Bulling A, Berg FD, Berg U, Duffy DM, Stouffer RL, Ojeda SR, Gratzl M, Mayerhofer A. Identification of an ovarian voltage-activated Na+-channel type: hints to involvement in luteolysis. Mol Endocrinol. 2000;14:1064–1074. doi: 10.1210/mend.14.7.0481. [DOI] [PubMed] [Google Scholar]
- Clayton B. Impairment of osmotically stimulated AVP release in patients with primary polydipsia. Am J Physiol. 1993;265:R1247. doi: 10.1152/ajpregu.1993.265.6.R1247. [DOI] [PubMed] [Google Scholar]
- Copland JA, Ives KL, Simmons DJ, Soloff MS. Functional oxytocin receptors discovered in human osteoblasts. Endocrinology. 1999;140:4371–4374. doi: 10.1210/endo.140.9.7130. [DOI] [PubMed] [Google Scholar]
- Copland JA, Zlatnik MG, Kirk LI, Soloff MS. Oxytocin receptor regulation and action in a human granulosa-lutein cell line. Biol Reprod. 2002;66:1230–1236. doi: 10.1095/biolreprod66.5.1230. [DOI] [PubMed] [Google Scholar]
- Cross BA, Leng G. The Neurohypophysis: Structure, Function and Control. Amsterdam: Elsevier; 1993. Progress in brain research; p. 60. [PubMed] [Google Scholar]
- Dawood MY, Khan-Dawood FS. Human ovarian oxytocin: its source and relationship to steroid hormones. Am J Obstet Gynecol. 1986;154:756–763. doi: 10.1016/0002-9378(86)90450-3. [DOI] [PubMed] [Google Scholar]
- Dawood MY, Khan-Dawood FS. Effect of the oxytocin antagonist antocin and agonist decomoton on baboon luteal cell production and release of progesterone. Fertil Steril. 2008;90:0015–0282. doi: 10.1016/j.fertnstert.2007.08.045. [DOI] [PubMed] [Google Scholar]
- Durr JA. Diabetes insipidus in pregnancy. Am J Kidney Dis. 1987;9:276. doi: 10.1016/s0272-6386(87)80122-1. [DOI] [PubMed] [Google Scholar]
- Einspanier A, Ivell R, Rune G, Hodges JK. Oxytocin gene expression and oxytocin immunoreactivity in the ovary of the common marmoset monkey (Callithrix jacchus) Biol Reprod. 1994;50:1216–1222. doi: 10.1095/biolreprod50.6.1216. [DOI] [PubMed] [Google Scholar]
- Einspanier A, Jurdzinski A, Hodges JK. A local oxytocin system is part of the luteinization process in the preovulatory follicle of the marmoset monkey (Callithrix jacchus) Biol Reprod. 1997;57:16–26. doi: 10.1095/biolreprod57.1.16. [DOI] [PubMed] [Google Scholar]
- Evans JJ, Forrest OW, McArdle CA. Oxytocin receptor-mediated activation of phosphoinositidase C and elevation of cytosolic calcium in the gonadotrope-derived alphaT3-1 cell line. Endocrinology. 1997;138:2049–2055. doi: 10.1210/endo.138.5.5138. [DOI] [PubMed] [Google Scholar]
- Furuya K, Mizumoto Y, Makimura N, Mitsui C, Murakami M, Tokuoka S, Ishikawa N, Imaizumi E, Katayama E, Seki K, et al. Gene expressions of oxytocin and oxytocin receptor in cumulus cells of human ovary. Horm Res. 1995;44:47–49. doi: 10.1159/000184661. [DOI] [PubMed] [Google Scholar]
- Geigerseder C, Doepner R, Thalhammer A, Frungieri MB, Gamel-Didelon K, Calandra RS, Köhn FM, Mayerhofer A. Evidence for a GABAergic system in rodent and human testis: local GABA production and GABA receptors. Neuroendocrinology. 2003;77:314–323. doi: 10.1159/000070897. [DOI] [PubMed] [Google Scholar]
- Gimpl G, Fahrenholz F. The oxytocin receptor system: structure, function, and regulation. Physiol Rev. 2001;81:629–683. doi: 10.1152/physrev.2001.81.2.629. [DOI] [PubMed] [Google Scholar]
- Ivell R, Brackett KH, Fields MJ, Richter D. Ovulation triggers oxytocin gene expression in the bovine ovary. FEBS Lett. 1985;190:263–267. doi: 10.1016/0014-5793(85)81296-5. [DOI] [PubMed] [Google Scholar]
- Ivell R, Furuya K, Brackmann B, Dawood Y, Khan-Dawood FS. Expression of the oxytocin and vasopressin genes in human and baboon gonadal tissues. Endocrinology. 1990;127:2990–2996. doi: 10.1210/endo-127-6-2990. [DOI] [PubMed] [Google Scholar]
- Jo M, Fortune JE. Changes in oxytocin receptor in bovine preovulatory follicles between the gonadotropin surge and ovulation. Mol Cell Endocrinol. 2003;200:31–43. doi: 10.1016/s0303-7207(02)00418-5. [DOI] [PubMed] [Google Scholar]
- Khan-Dawood FS, Dawood MY. Human ovaries contain immunoreactive oxytocin. J Clin Endocrinol Metab. 1983;57:1129–1132. doi: 10.1210/jcem-57-6-1129. [DOI] [PubMed] [Google Scholar]
- Khan-Dawood FS, Huang JS, Dawood MY. Baboon corpus luteum oxytocin: an intragonadal peptide modulator of luteal function. Am J Obstet Gynecol. 1988;158:882–891. doi: 10.1016/0002-9378(88)90089-0. [DOI] [PubMed] [Google Scholar]
- Khan-Dawood FS, Goldsmith LT, Weiss G, Dawood MY. Human corpus luteum secretion of relaxin, oxytocin and progesterone. J Clin Endocrinol Metab. 1989;68:627–631. doi: 10.1210/jcem-68-3-627. [DOI] [PubMed] [Google Scholar]
- Laszlo FA, Laszlo F, Jr, De Wied D. Pharmacology and clinical perspectives of vasopressin antagonists. Pharmacol Rev. 1991;43:73–108. [PubMed] [Google Scholar]
- Mayerhofer A, Föhr KJ, Sterzik K, Gratzl M. Carbachol increases intracellular free calcium concentrations in human granulosa-lutein cells. J Endocrinol. 1992;135:153–159. doi: 10.1677/joe.0.1350153. [DOI] [PubMed] [Google Scholar]
- Mayerhofer A, Sterzik K, Link H, Wiemann M, Gratzl M. Effect of oxytocin on free intracellular Ca2+ levels and progesterone release by human granulosa-lutein cells. J Clin Endocrinol Metab. 1993;93:1209–1214. doi: 10.1210/jcem.77.5.8077313. [DOI] [PubMed] [Google Scholar]
- Mayerhofer A, Kunz L, Krieger A, Proskocil B, Spindel E, Amsterdam A, Dissen GA, Ojeda SR, Wessler I. FSH regulates acetycholine production by ovarian granulosa cells. Reprod Biol Endocrinol. 2006;4:37. doi: 10.1186/1477-7827-4-37. [DOI] [PMC free article] [PubMed] [Google Scholar]
- Monstein HJ, Truedsson M, Ryberg A, Ohlsson B. Vasopressin receptor mRNA expression in the human gastrointestinal tract. Eur Surg Res. 2008;40:34–40. doi: 10.1159/000108655. [DOI] [PubMed] [Google Scholar]
- Okuda K, Uenoyama Y, Fujita Y, Iga K, Sakamoto K, Kimura T. Functional oxytocin receptors in bovine granulosa cells. Biol Reprod. 1997;56:625–631. doi: 10.1095/biolreprod56.3.625. [DOI] [PubMed] [Google Scholar]
- Peter J, Burbach H, Adan RA, Lolait SJ, van Leeuwen FW, Mezey E, Palkovits M, Barberis C. Molecular neurobiology and pharmacology of the vasopressin/oxytocin receptor family. Cell Mol Neurobiol. 1995;15:573–595. doi: 10.1007/BF02071318. [DOI] [PMC free article] [PubMed] [Google Scholar]
- Pitzel L, Jarry H, Wuttke W. Demonstration of oxytocin receptors in porcine corpora lutea: effects of the cycle stage and the distribution on small and large luteal cells. Biol Reprod. 1993;48:640–646. doi: 10.1095/biolreprod48.3.640. [DOI] [PubMed] [Google Scholar]
- Plevrakis I, Calmagirand C, Pontonnier G. Oxytocin biosynthesis in serum-free cultures of human granulosa cells. J Endocrinol. 1990;124:R5–R8. doi: 10.1677/joe.0.124r005. [DOI] [PubMed] [Google Scholar]
- Rey-Ares V, Lazarov N, Berg D, Berg U, Kunz L, Mayerhofer A. Dopamine receptor repertoire of human granulosa cells. Reprod Biol Endocrinol. 2007;5:40. doi: 10.1186/1477-7827-5-40. [DOI] [PMC free article] [PubMed] [Google Scholar]
- Schaeffer JM, Liu J, Hsueh AJ, Yen SS. Presence of oxytocin and arginine vasopressin in human ovary, oviduct, and follicular fluid. J Clin Endocrinol Metab. 1984;59:970–973. doi: 10.1210/jcem-59-5-970. [DOI] [PubMed] [Google Scholar]
- Stormshak F. Biochemical and endocrine aspects of oxytocin production by the mammalian corpus luteum. Reprod Biol Endocrinol. 2003;1:92. doi: 10.1186/1477-7827-1-92. [DOI] [PMC free article] [PubMed] [Google Scholar]
- Streeten DHP. Pathophysiologic and pharmacologic alterations in the release and action of ADH. Metabolism. 1976;25:697. doi: 10.1016/0026-0495(76)90067-6. [DOI] [PubMed] [Google Scholar]
- Tjugum J, Norström A, Dennefors B, Lundin S. Oxytocin in human follicular fluid and its possible role in the ovulatory process as studied in vitro. Hum Reprod. 1986;5:283–286. doi: 10.1093/oxfordjournals.humrep.a136405. [DOI] [PubMed] [Google Scholar]
- Voss AK, Fortune JE. Oxytocin secretion by bovine granulosa cells: effects of stage follicular development, gonadotropins, and coculture with theca interna. Endocrinology. 1991;128:1991–1999. doi: 10.1210/endo-128-4-1991. [DOI] [PubMed] [Google Scholar]
- Wathes DC, Pickering BT, Swann RW, Porter DG, Hall MGR, Drife JO. Neurohypophyseal hormones in the human ovary. Lancet. 1982;2:410–412. doi: 10.1016/s0140-6736(82)90441-x. [DOI] [PubMed] [Google Scholar]
- Wyllie AH, Kerr JF, Curie AR. Cell death: the significance of apoptosis. Int Rev Cytol. 1980;68:251–306. doi: 10.1016/s0074-7696(08)62312-8. [DOI] [PubMed] [Google Scholar]