Abstract
Homeostatic regulation of neuronal activity is fundamental for the stable functioning of the cerebral cortex. One form of homeostatic synaptic scaling has been recently shown to be mediated by glial cells that interact with neurons through the diffusible messenger tumour necrosis factor-α (TNF-α). Interestingly, TNF-α is also used by the immune system as a pro-inflammatory messenger, suggesting potential interactions between immune system signalling and the homeostatic regulation of neuronal activity. We present the first computational model of neuron–glia interaction in TNF-α-mediated synaptic scaling. The model shows how under normal conditions the homeostatic mechanism is effective in balancing network activity. After chronic immune activation or TNF-α overexpression by glia, however, the network develops seizure-like activity patterns. This may explain why under certain conditions brain inflammation increases the risk of seizures. Additionally, the model shows that TNF-α diffusion may be responsible for epileptogenesis after localized brain lesions.
Keywords: homeostasis, synaptic scaling, neuron–glia interaction, neuro-immune interaction, epilepsy
1. Introduction
For the brain, as for any biological system, the only constant is change. In order to maintain cortical networks in a dynamic regime that allows for efficient information processing a variety of homeostatic mechanisms are used (Turrigiano & Nelson 2004). Such activity regulation occurs on a wide range of time scales—from milliseconds to days—and affects both intrinsic neuron properties and synaptic strength.
A powerful mechanism for regulating overall network activity is synaptic scaling, which scales all excitatory synapses of a neuron to compensate for changes in synaptic drive. This type of homeostatic regulation has been demonstrated in various experimental settings (Turrigiano et al. 1998; Turrigiano 2007) and its theoretical properties have been studied in computational models (Abbott & Nelson 2000). The precise biological signalling mechanisms underlying synaptic scaling remain poorly understood, however.
Recent evidence suggests that glia—support cells in the brain—and the soluble form of tumour necrosis factor-α (TNF-α) may be involved in a specific form of synaptic scaling (Beattie et al. 2002; Stellwagen & Malenka 2006). It was shown that acute application of TNF-α or its long-term production after chronic activity blockade increases AMPA receptor surface expression in hippocampal neurons, thus strengthening excitatory synapses. Furthermore, the surplus TNF-α that accompanies chronic activity blockade is produced by local glial cells (Stellwagen & Malenka 2006). Specifically, it is thought that glial cells estimate the synaptic drive to neurons via neurotransmitter spillover at the synapses (Volterra & Meldolesi 2005). Activated glial cells, in turn, stimulate the post-synaptic neurons via TNF-α, inducing an increase in excitatory synaptic strength. The process is accompanied by the endocytosis of GABAA receptors (Stellwagen & Malenka 2006), which results in a decrease in inhibitory synaptic strength. In summary, the neuromodulator TNF-α (Pan et al. 1997; Vitkovic et al. 2000) seems to be of vital importance for balancing neuronal activity in the cortex.
Interestingly, TNF-α also plays an important role in the immune system. It is a pro-inflammatory cytokine whose levels can rise dramatically during local acute immune responses. A 10-fold increase in serum is frequently found, and even 100-fold increases are seen during sepsis (Damas et al. 1992; Haagmans et al. 1994; Galic et al. 2008). Produced by immune cells such as monocytes, T-lymphocytes and phagocytes, TNF-α can activate neutrophils and macrophages, control the recruitment of immune agents from the blood and regulate the permeability of the blood–brain barrier (BBB) to soluble molecules (Deli et al. 1995; Rosenberg et al. 1995; Bechmann et al. 2007).
The dual role of TNF-α as both pro-inflammatory cytokine and neuromodulator leads to the interesting hypothesis that TNF-α produced during an immune response in the brain may interfere with the homeostatic regulation of synapses, potentially increasing synaptic strength sufficient to trigger paroxysmal activity. This interference between different signalling pathways could explain some of the recent evidence suggesting an immune system influence in seizure initiation in certain pathological conditions (Vezzani 2005; Lucas et al. 2006).
In order to investigate the relationship between TNF-α and epileptiform activity, we have developed a computational model of the interaction of neurons and glial cells during homeostatic synaptic scaling. To the best of our knowledge, it is the first model to simulate a network of spiking neurons interacting with a population of glial cells. As a first attempt of this type, our model cannot aspire to capture the full complexity of neuron–glia interactions. Instead, it focuses on TNF-α-mediated homeostatic regulation and does not consider other ways through which glial cells can influence neuronal excitability, such as the regulation of extracellular potassium (Kofuji & Newman 2004) or the release of glutamate or ATP (Newman 2003).
Supporting our hypothesis, the model shows that an overall increase in TNF-α levels following chronic inflammation or TNF-α overexpression by glia can push the network activity into a paroxysmal regime. In addition, it shows that neuronal hyperexcitability also arises after localized disruptions in network structure, resulting from simulated local lesions. In particular, following partial deafferentation, TNF-α produced by glial cells within the lesion area diffuses to the neighbouring tissue and triggers network bursts.
2. Materials and methods
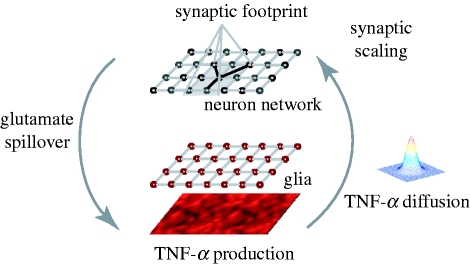
We model the interaction between a population of neurons and glial cells (figure 1). The neural network model is a two-dimensional sheet of recurrently connected spiking neurons. The synaptic scaling mechanism is modelled after the data from Beattie et al. (2002) and Stellwagen & Malenka (2006). Specifically, glial cells estimate total synaptic drive via glutamate spillover and produce TNF-α in response. The TNF-α diffuses to neurons and its concentration controls the strength of synaptic connections by scaling all excitatory weights of a neuron in a multiplicative fashion. The translation of local glutamate levels into TNF-α and the adjustment of synaptic weights are modelled by two sigmoid functions, with parameters established by a calibration step.
Figure 1.
Overview of the model of homeostatic synaptic scaling by neuron–glia interaction: glial cells estimate the synaptic drive received by neurons via glutamate spillover. Glial cells adjust their TNF-α production as a function of the estimated glutamate level. Diffusing TNF-α reaches the neurons and triggers the scaling of excitatory synapses.
2.1. Neural network
We use a two-dimensional spiking neuron model (Izhikevich 2003) that can produce a rich set of dynamical behaviours, while remaining computationally feasible,
and
 |
where v(t) is the membrane potential; u(t) is the recovery variable; I(t) is the total post-synaptic current for the neuron; and a and b are model parameters. When the membrane potential reaches the threshold value of 30, a spike occurs, the membrane potential is reset to its rest value and the recovery variable is updated:  and
and  , where c is the membrane rest potential and d is a parameter of the recovery variable. Different dynamic behaviours can be obtained by varying the parameters a, b, c and d. We consider only pyramidal neurons (regularly spiking RS, with a=0.02, b=0.1, c=−65 and d=8) and inhibitory interneurons (fast spiking FS, a=0.1, b=0.2, c=−65 and d=2).
AMPA and GABAA synapses are modelled as exponentially decaying conductances g, which are instantaneously increased upon the arrival of an afferent spike:  where
where  represents the maximum synaptic increase per spike event (here,
  ); t
i is the time of the ith spike; and D(t
i) is a synaptic depression variable described below. The time constant τ
syn is the synaptic conductance decay, with default values 10 and 20 ms for AMPA and GABAA synapses, respectively (Moreno-Bote & Parga 2005; for details, see appendix A.1).
Excitatory synapses in our model exhibit short-term synaptic depression, arising due to the temporary depletion of presynaptic vesicles, with an exponential recovery to baseline level (Abbott et al. 1997; Tsodyks & Markram, 1997)
 |
where U is the fraction of synaptic resources, which is consumed by a single event (U=0.05) and τ D is the time constant of recovery for the synaptic resources (in the range 450–700 ms) (Abbott et al. 1997). In some experiments we also considered synaptic delays, in the range [0,d max], drawn from a uniform distribution (d max=32 ms).
The total input current I received by a neuron obtained by summing up the post-synaptic currents for all incoming synapses is
 |
where A
i is a scaling factor, with different values for a synapse connecting an excitatory/inhibitory neuron to an excitatory/inhibitory neuron (default values are A
EE=0.02 for excitatory–excitatory connections and A
EI=A
IE=A
II=0.03 for the rest);  is the strength of the ith synapse (w
i∈[0,1]; g
i(t) measures the instantaneous synaptic conductance for synapse i; E
i is the reversal potential of the synapse (0 for excitatory synapses and −70 for inhibitory synapses); and v(t) is the membrane potential of the post-synaptic neuron.
The network consists of N×N neurons (N=25), 80 per cent RS excitatory and 20 per cent FS inhibitory neurons, organized in a two-dimensional lattice. Neurons connect locally, within a square synaptic footprint of size r×r (r=7), with probability p conn=0.2 and periodic boundary conditions. A weak excitatory input (A in=0.03) is provided from N in=25 input neurons, which connect to each neuron in the network with probability p in=0.2 and spike as independent Poisson processes with a frequency f in=10 Hz.
2.2. Glial model
The glial tissue is organized in a lattice similar to the neuron network, with one glial cell per neuron. Consistent with the assumptions in Stellwagen & Malenka (2006), the glial cells monitor excitatory drive to neighbouring neurons via glutamate spillover, considered to be proportional to the total drive received by the neuron at each position (x,y), averaged over a time window  The neuronal activity is regulated by changes in the excitatory synaptic strength, corresponding to the AMPAr increases described experimentally. As the reported reduction in GABAA receptors is smaller in relative magnitude (Stellwagen & Malenka 2006) and given that the analysis of the network properties reveals a weak dependence of the activity on A
IE (see appendix A.1), our model does not consider GABAA receptor regulation. However, such regulation is expected to exacerbate the results described below (simulations showed no quantitative difference in the case when the same gain factors are considered for both the excitatory and the inhibitory regulation). Although experimental reports on synaptic scaling involve pyramidal neurons (Turrigiano et al. 1998; Ogoshi et al. 2005), the modelled scaling affects excitatory synapses on both pyramidal and inhibitory neurons, for simplicity.
To account for the astrocytic arborization, the local glutamate estimates are convolved with a normalized Gaussian kernel:  where
where  , and
, and  is the matrix of glutamate estimates for all neurons at time t (σ
1=1.22, corresponding to a cell radius 3).
The TNF-α concentration is determined by the glial production, computed as a function of the local glutamate concentration, with an exponential decay,
 |
and
 |
where c tnf(t) is the local TNF-α concentration at time step t; c tnfα(t) represents target TNF-α concentration for the current activity level; and τ tnf is a time constant for TNF-α concentration decay. The asymptotic value of the TNF-α concentration is a function of the glutamate concentration at a glial cell c glut(t), while the parameter c glut0 specifies the target glutamate concentration value, and K glut is a scaling parameter (unless specified otherwise, c glut0=0.52, K glut=2.5).
TNF-α diffuses to the neighbouring neurons, a process modelled by the convolution with another Gaussian kernel  , with the default value σ
2=1.58 (cell radius 4):
  where C and C′ denote the matrices corresponding to the concentration at each glial cell c and neuron c′. The TNF-α triggers a change in the average synaptic conductance of the neuron w(t),
  described by the equation,
 |
and
 |
where c′(t) is the local TNF-α concentration at the neuron; τ w gives the time scale of the synaptic strength change; and c 0 and K c are model parameters with default values c 0=0.5 and K c=0.03.
The total change in conductance is distributed to the synapses  in a way that preserves their relative strength,
  .
.
While the estimation of synaptic drive and the production of TNF-α by glial cells are very slow processes, such that observable changes occur on a time scale of minutes to days (Stellwagen & Malenka 2006), the model uses much faster time constants in order to reduce simulation time. Specifically, for all results presented, the homeostatic regulation of synaptic strength occurs of the order of seconds rather than hours or days (time constants for glutamate estimation τ glut, the glial TNF-α production τ tnf and the synaptic modification τ w were reduced to 1, 10 and 1 s, respectively). However, since the time constants of the homeostatic plasticity are still much slower than the activity dynamics of the spiking network, the qualitative behaviour of the overall model is not altered.
Little is known quantitatively about the processes underlying TNF-α production and the corresponding synaptic scaling. Further experiments are needed to constrain the model parameters relating neuronal activity to TNF-α production and increase in synaptic strength. In order to set these ‘free’ parameters of the model, we use a calibration procedure that assumes that the synaptic scaling robustly maintains homeostasis of the neuronal activity after changes in input (see appendix A.2 for details).
3. Results
3.1. Increases in TNF-α can induce seizures
It is established that during chronic inflammation the TNF-α concentration inside the brain can increase (Gutierrez et al. 1993; Hanisch & Kettenmann 2007). Additional TNF-α can either be produced locally or can originate in serum and penetrate the BBB. Local production is owed mostly to activated microglia, but additional TNF-α sources are monocytes or lymphocytes, which can enter the brain due to changes in BBB permeability (Prat et al. 2005). Also, systemic infections can trigger the activation of immune system agents inside the brain, in response to endotoxaemia (Rivest et al. 2000; Galic et al. 2008), for example. This is of particular interest since bacterial infection (such as bacterial meningitis) is sometimes accompanied by seizures (Vezzani & Granata 2005), suggesting that TNF-α or other pro-inflammatory cytokines might be part of the mechanisms inducing an increased susceptibility to seizures during brain infections.
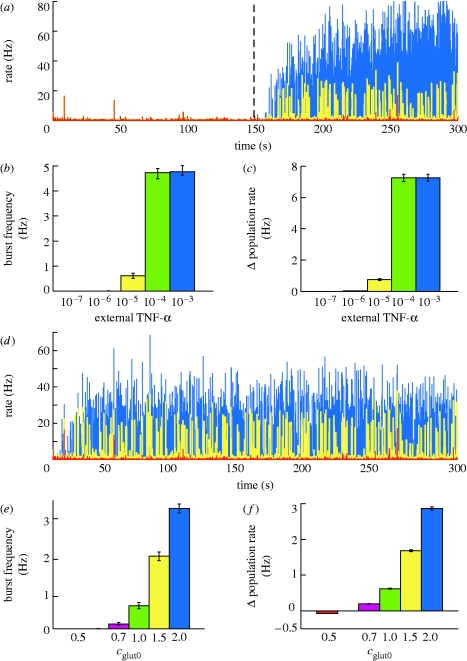
In order to investigate this hypothesis, we consider the case of a chronic inflammation. As a first approximation, we model the increases in TNF-α levels caused by an immune system activation by a spatially homogeneous TNF-α source. As the synaptic weights are initialized at random, the disruption is induced after the network has reached the homeostatic regime (t=150 s) and involves adding a small constant amount of TNF-α at each time step to the local glial production (figure 2 a–c).
Figure 2.
Effects on network activity due to a TNF-α increase. (a) Changes in average neuronal activity after chronic inflammation (external TNF-α values displayed in different colours; blue, 10−3; yellow, 10−5; red, 10−7). The severity of immune response (b) affects burst frequency and (c) induces an increase in the average firing rate. (d) Changes in average neuronal activity in the case of TNF-α overexpression by glia (for different c 0 values; blue, 2.0; yellow, 1.0; red, 0.5). The degree of overexpression affects (e) burst frequency and (f) the average firing rate. Results are averaged over 10 trials, with error bars indicating standard error.
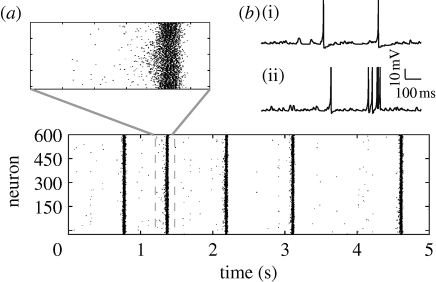
If the external TNF-α contribution is big enough (greater than 10−6; figure 2 b), the local TNF-α concentration remains elevated, causing an increase in the average synaptic conductance, accompanied by a rise in the average firing rate of the neurons (figure 2 c). Additionally, as the excitatory synapses are strengthened, the activity becomes increasingly synchronized (a detailed analysis of how neuronal synchronization depends on the scaling of excitatory synapses can be found in appendix A.1). Transient increases in the input, due to normal activity fluctuations, are amplified by the recurrent excitatory connections and the neuronal network experiences seizure-like bursts (similar to those in figure 3 a). Consistent with the experimental findings (Nita et al. 2006), regular spiking neurons exhibit spike bursts (figure 3 b, lower curve), synchronized over the population. For high values of external TNF-α, the effect saturates (figure 2 b). The relationship between average excitatory synaptic strength and the development of network bursts is investigated in detail in appendix A.1. Importantly, the analysis of a reduced population-level version of the system shows that the robustness of the system to additional TNF-α sources depends on the parameters K glut and K C, a result confirmed in simulation (see appendix A.3). Specifically, the stable state of the system is determined by the total gain of the feedback loop (essentially by the product K glut*K C). The stability of the system to a certain destabilizing scenario, such as a chronic immune response, depends critically on the individual parameters, however. For a mild inflammatory state, the network can either remain stable or develop strong seizure-like patterns of activity, as a function of K C (See appendix A.3).
Figure 3.
(a) Typical example of network bursts occurring after a 10% increase in excitatory synaptic strength. (b) Voltage traces of a neuron in the control case (upper) and during a network burst (lower).
Transgenic mice mildly overexpressing TNF-α can develop spontaneous seizures (Akassoglou et al. 1997) (strong overexpression is usually fatal), an effect also captured by our model. In order to model various levels of TNF-α overexpression, we simulate an increase in the target glutamate level of the system (measured by parameter c glut0). This manipulation forces glia to produce more TNF-α than in the control case. Similar to the effects observed experimentally, the network reaches a hyperexcitable state, with the probability of developing seizures being related to the degree of TNF-α overexpression. As shown in figure 2 d,e, if the change in synaptic strength is big enough, the network activity becomes paroxysmal.
3.2. A sustained reduction in input can trigger seizures
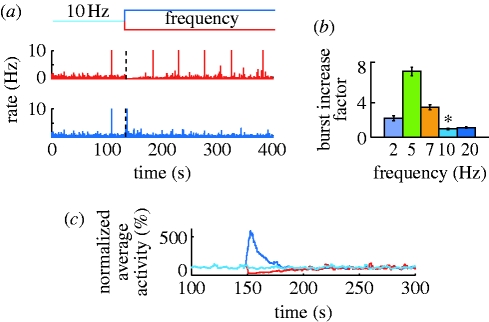
Simulations used for the calibration of system parameters, which involve changes in input firing rate (see appendix A.2), suggest that the dynamics of the network can change qualitatively due to chronic changes in the input rates. Therefore, we investigate the degree of network synchronization, for different input frequencies. As before, the system is first allowed to converge to the homeostatic state (150 s). Afterwards, the mean input frequency is changed in a step function-like fashion to different levels and the frequency of the network bursts is evaluated (figure 4).
Figure 4.
Network adaptation following changes in input frequency. (a) Time evolution of average population rate after a ±50% change in mean firing of the input population. (b) Increase in burst probability relative to baseline (marked by asterisk). (c) A low-pass filtered version of the average firing rate. Results are averaged over 10 trials, with error bars representing the standard error.
After a sudden but sustained reduction in input, the network initially falls almost silent, but later recovers its normal activity level due to the strengthening of excitatory synapses by synaptic scaling. However, as a result of the adaptation, the network generates bursts at irregular intervals, provided the remaining input is sufficient to drive the network (figure 4 b, the 2 Hz case). Correspondingly, after a sudden increase in input, the network responds with an initial burst of activity, after which it slowly recovers to a low-activity regime without any seizures. In both the cases, the homeostatic mechanism brings the average firing rate of the neuronal population back to baseline (figure 4 c). These results are consistent with those from a recently published work (Fröhlich et al. 2008) that considered only a simplified one-dimensional network structure, with local connections, facilitating burst propagation.
3.3. Local lesions induce seizures
The experiments involving variations in input rates described above suggest that the dynamics of the network can change qualitatively for a long-term reduction in input. Thus, it is plausible to assume that lesions can also enhance seizure predisposition (Timofeev et al. 2000; Houweling et al. 2005). In contrast to previous approaches, here we focus on the mechanism of homeostatic regulation, specifically on the spatial effects due to TNF-α diffusion.
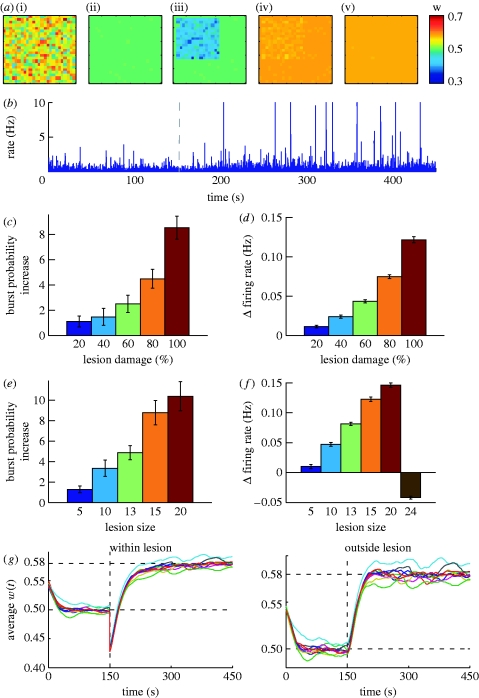
We consider localized lesions in the shape of a square of varying size (figure 5 a). The network starts from random initial conditions (t=0), individual neurons having variable average excitatory synaptic strength. In time, the TNF-α-mediated synaptic scaling equalizes the total excitatory drive to neurons. Deafferentation is induced when the network has reached a homeostatic state (t=150 s) and causes a certain percentage of the synapses from the input neurons to neurons in the lesion area to be removed. We study the dynamic regime after the lesion, for various lesion sizes and different extents of synaptic damage.
Figure 5.
Effects of local lesions. (a) Evolution in time of average synaptic strength for individual neurons after a local lesion ((i) t=0 s, (ii) t=150 s, (iii) t=lesion, (iv) t=300 s, (v) t=450 s). (b) Corresponding average firing rate for the neuronal population. (c) Increase in burst frequency and (d) firing rate relative to baseline for different lesion severity levels and (e,f) lesion sizes. (g) Time evolution of average excitatory synaptic strength for the neurons (i) within and (ii) outside lesions, for a lesion size 15×15 and 100% damage of input synapses. Different colours mark different trials. (c–f) Results estimated over 10 trials, with error bars measuring the standard error.
When varying the proportion of deafferentation for a fixed lesion size (15×15), the strength of remaining synapses reaches a value large enough to facilitate network bursts (figure 5 b). The burst probability increases with the severity of the lesion (figure 5 c), consistent with the results in Houweling et al. (2005). Furthermore, the effect is observable for a wide range of partial deafferentation levels, as observed experimentally (Timofeev et al. 2000). Similarly, when the lesion affects a fixed percentage of the input synapses (100%), the network dynamics depend on the size of the affected area. For small lesions the effect is negligible, but it increases with the size of the lesion, as shown in figure 5 e. For almost complete deafferentation, however, the seizure-like behaviour disappears (not shown). As neurons in our model have no intrinsic spontaneous activity, the network is driven by the external input. Consequently, when the lesion damages a large number of input connections, the remaining drive is insufficient to generate any activity (also, the overall firing rate decreases, as shown in figure 5 f). It may trigger large bursts if the input configuration is right, but most of the times the network is quiescent.
A closer inspection of the evolution of average excitatory strength within and outside the lesion area (figure 5 g) reveals a potential explanation of the effect. Owing to the decrease in glutamatergic input, glial cells in the lesion area start producing TNF-α and the average excitatory strength increases (to a value higher than before the lesion, as the rate of the input is higher than the population firing rate). However, TNF-α diffusion causes the same increase to the weights outside the lesion.
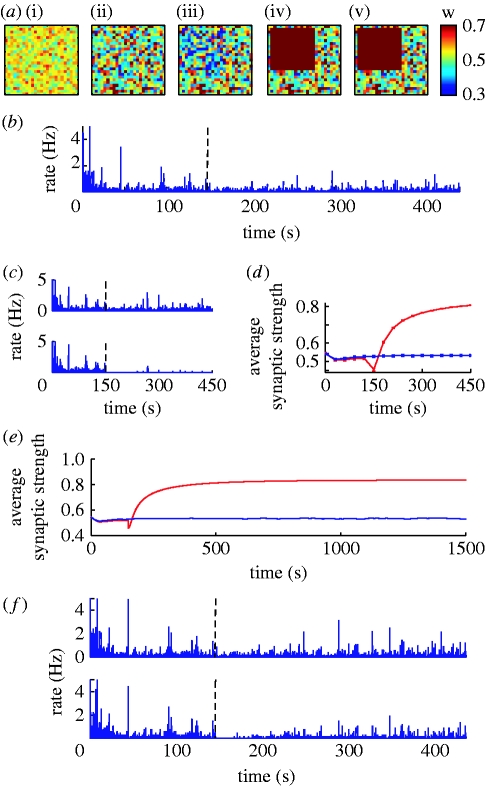
As the increased TNF-α production within the lesion also affects the neighbouring ‘healthy’ neurons, we can assume that TNF-α diffusion may be an important cause of increased synchrony in the network. In order to test this hypothesis, we compare the dynamics of the network after 100 per cent deafferentation, within a 15×15 area, for various diffusion coefficients. As predicted, when the synaptic scaling process is local to each neuron, the response is restricted to the lesion area (figure 6 a) and bursts disappear completely, as shown in figure 6 b. Also, note that local synaptic scaling leads to an increased variability in average excitatory strength for neurons (figure 6 a). For the case of 100 per cent lesion, the damage is too severe for the homeostatic mechanism to be able to recover the original activity level (figure 6 c). Also, for local regulation convergence becomes significantly slower (figure 6 d,e). For an 80 per cent lesion, the activity within the lesion goes back to baseline (figure 6 f).
Figure 6.
Effects of local lesions for local synaptic scaling. (a) Evolution in time of average synaptic strength for individual neurons during a 100%, 15×15 local lesion ((i) t=0 s, (ii) t=150 s, (iii) t=lesion, (iv) t=300 s, (v) t=450 s). (b) Corresponding average activity for the entire neuronal population, and (c) for separate affected and unaffected neuron populations. (d) Evolution of average weights within (red) and outside (blue) the lesion. (e) Single trial converge of average excitatory weights for a 100% lesion (red, in; blue, out). (f) Average activity within and outside an 80% 15×15 lesion.
Our result suggests that, as predicted, the strengthening of synapses in neighbouring neurons due to TNF-α diffusion is responsible for the network hyperexcitability in the case of localized lesions. When diffusion does occur, the actual parameters controlling the astrocytic arborization range and TNF-α diffusion are not very important, and no systematic differences are observed in the system dynamics. Importantly, the result suggests that homeostatic regulation mechanisms that rely on the diffusion of neuromodulators are prone to become maladaptive in cases of localized disruptions in the system.
4. Discussion
We have presented a first model of glial cells interacting with a population of neurons by homeostatic synaptic plasticity. The model suggests that the dual role of TNF-α as both a pro-inflammatory messenger of the immune system and as a mediator of synaptic scaling can lead to interesting interactions. Specifically, it offers a novel mechanism through which immune activity in the brain can influence the dynamics of cortical circuits and increase seizure susceptibility. In addition, our model builds on previous data linking homeostatic mechanisms and seizures (Timofeev et al. 2000; Houweling et al. 2005; Fröhlich et al. 2008) in the context of localized lesions. It implements a biologically plausible mechanism for the synaptic upregulation following deafferentation. Interestingly, in our model, diffusion of TNF-α through cortical circuits was shown to be critical for the development of paroxysmal activity. This represents a clear distinction to previous models (Houweling et al. 2005; Fröhlich et al. 2008), which explicitly implement the homeostatic regulation of synapses as a function of the global population activity (corresponding to a large TNF-α diffusion in our model). This is particularly relevant because the degree of locality of the process was shown to affect the final outcome after deafferentation. This effect could be enhanced by other means for spreading of TNF-α from the lesion area, such as the range of the astrocytic arborization (a result confirmed in simulations) or by glial communication (e.g. via gap junctions; Giaume & McCarthy 1996). Currently, little is known about how TNF-α and other proteins diffuse through cortical tissue and more data are needed to constrain future models.
At present, the immune system's influence on seizures is still controversial. Positive evidence for an immune system role in triggering seizures comes from clinical practice, as anti-inflammatory drugs can provide effective anti-epileptic treatment in some cases. Another strong indication comes from conditions, such as Rasmussen's encephalitis, that are associated with an increase in pro-inflammatory markers (Aarli 2000; Vezzani & Granata 2005). More evidence comes from animal models. Chronic inflammation was shown to trigger spontaneous seizures in mouse models of pneumococcal meningitis, cerebral malaria or cysticercosis. In the case of meningitis, the incidence of seizures was decreased by treatment using an inhibitor of a TNF-α-converting enzyme, which reduces the levels of soluble TNF-α (Meli et al. 2004). Additionally, inflammation induced by lipopolysaccharide (LPS), for example, is known to enhance the effect of proconvulsive drugs (such as kainic acid), an effect blocked by anti-inflammatory drugs (Vezzani & Granata 2005). In a different study, systemic infection caused by Shigella dysenteriae was reported to enhance the seizure-inducing effect of pentylenetetrazol, an effect mediated by TNF-α and interleukin-1β, which a subsequent study revealed to be non-monotonic as a function of the TNF-α concentration (Yuhas et al. 2003).
All in all, the outcome of pharmacological manipulations of TNF-α levels depends on a variety of factors including concentration, time scale, activated pathway and receptors involved. As part of a complicated molecular network, with multiple regulatory mechanisms running in parallel, TNF-α effects on seizures are manifold. When activating a different signalling pathway, the cytokine can have beneficial effects, improving neuronal survival by the release of neurotrophic factors (Akassoglou et al. 1997; Balosso et al. 2005). In the case of brain immune system interference, a beneficial pharmacological manipulation would ideally affect the synaptic scaling mechanism, without blocking the protective effects of TNF-α. A potential target for selectively disabling homeostatic regulation is the TNF-α receptor p55, as protective effects are mediated by a different receptor (p75) (Balosso et al. 2005).
Recent experimental evidence (Galic et al. 2008) has shown that a LPS-induced infection in rats, occurring during a critical period in development, induces a long-lasting increase in neuronal excitability and seizure susceptibility. The effect is mediated by TNF-α and can be mimicked by the intracerebral administration of rat recombinant TNF-α. The nature of the changes induced by a transient inflammatory response during development is still unclear. However, it is interesting to note that, although the baseline TNF-α levels seem not to be altered in the adult, the cytokine levels following an induced seizure are increased, potentially also due to an increase in the number of astrocytes. In the context of our model, it is possible to imagine that the initial inflammation may alter the ‘gain function’ for the astrocytic TNF-α production, making the system more unstable and thus more prone to seizures. Further experiments are needed to clarify whether TNF-α-mediated synaptic scaling plays a role in this case.
An interesting question in this context is why the immune system and the synaptic scaling mechanism rely on the same messenger protein, if this can lead to such unwanted crosstalk. One possible answer is that the immune and nervous systems are usually well isolated from one another through the BBB. According to an alternative view, TNF-α has an immune-related role in the brain under normal circumstances. Immune agents are frequently observed in the brain (Bechmann et al. 2007) and glial cells can also acquire immune functions (Sebire et al. 1993). From this vantage point, TNF-α is part of a well-balanced network of molecular mechanisms in the homeostatic state. It is only under chronic conditions that the excess of TNF-α turns harmful and increases seizure susceptibility, while short and local brain infections do not affect the stability of the system.
Taken together, our results illustrate that the reliance of immune signalling and synaptic scaling on the same messenger molecule, TNF-α, may be responsible for infection-related seizures in a number of conditions. A great challenge for future experiments would be to carefully analyse the interference between the signalling pathways regulating an inflammatory response and homeostatic synaptic regulation. Specifically, we need a better understanding of how the TNF-α signal is translated into AMPAr changes in neurons.
Acknowledgments
We would like to thank Philipp Wolfrum for helping with the control system analysis and Dr Michael Madeja and Dr Karsten Krakow for fruitful discussions. The authors gratefully acknowledge the support of the Frankfurt Center for Scientific Computing. FIAS is supported by the ALTANA AG and the Hertie Foundation. J.T. and C.S. are supported by EC MEXT-project PLICON. M.M.H. is supported by the EC NEST project MAMOCELL within FP6.
Appendix A
A.1. Network parameters
We address the question of how changes in the parameters of the neuron network model alone affect the dynamics of the neural circuit, especially in relation to the generation of seizure-like events. Such an activity burst is considered to occur when the population firing rate (estimated for 10 ms time bins) is higher than the burst threshold (default, 10 Hz). We analyse the effects of varying the connectivity, synaptic properties and input frequency in order to determine the conditions under which the network becomes hyperexcitable. These results are also used for optimizing the width of the time bin and the burst threshold for the synaptic scaling simulations (specifically, 30 ms and 10 Hz).
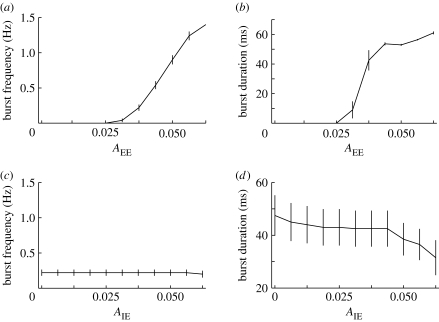
We start by analysing the importance of varying the synaptic strength of excitatory–excitatory connections. As the strength of excitatory synapses is increased, the network dynamics change from a low firing to large synchronized population bursts. As shown in figure 7 a,b, both the number and duration of burst events can be significantly altered by varying the strength between excitatory synapses. As high TNF-α concentrations scale up excitatory synapses, this result supports the idea that for inflammatory responses which raise the TNF-α levels inside the brain sufficiently the network activity can become paroxysmal.
Figure 7.
The dependence of burst frequency and average duration on (a,b) the strength of excitatory-to-excitatory and (c,d) inhibitory-to-excitatory synapses, respectively. Values are estimated over 10 trials, with error bars indicating standard error.
In order to determine the effects of inhibition, we have studied the impact of varying the amount of inhibition within the neuron population, i.e. the scaling factor for the inhibitory to excitatory synapses (A IE). The results in figure 7 c,d show a decrease in burst duration, but no significant effect on their frequency, in the parameter range considered.
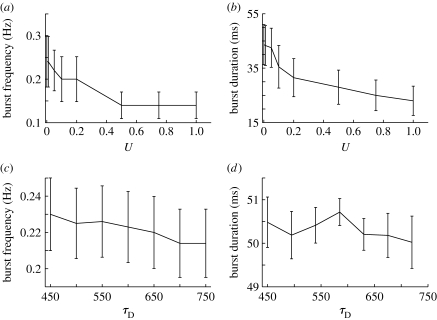
It was shown that some amount of inhibition is required for preventing the network activity from ‘exploding’, but burst termination can also be achieved by other mechanisms as well. As synaptic depression reduces the efficacy of synapses in response to high activity, it is probable that the mechanism is also important for burst termination. To test this hypothesis, we study the parameters influencing synaptic resources consumption (U) and recovery (τ D) and their effects on burst properties. The results illustrated in figure 8 demonstrate that short-term synaptic depression plays a role in burst termination, consistent with the findings reported in Houweling et al. (2005). The fraction of resources consumed per burst event influences significantly the burst duration, as slower exhaustion of the synaptic resources makes bursts last longer. It also increases to some extent the burst frequency. The time constant of the recovery τ D influences the burst frequency, since the longer it takes to recover the initial amount of synaptic resources, the longer it takes to trigger another network burst event.
Figure 8.
The effects of synaptic depression on network bursts. Burst frequency and duration as a function of parameters (a,c) U and (b,d) τ D, respectively.
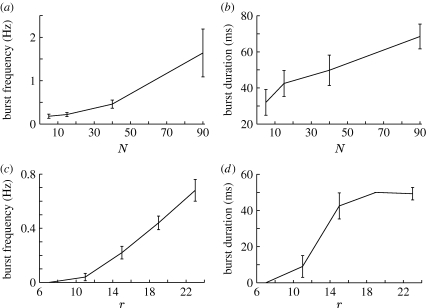
Burst duration values suggested by experimental findings are typically larger than those produced in our model, of the order of 200–400 ms (Nita et al. 2006), as compared with 60–100 ms in simulations. We hypothesize that the network size is too small for sustaining the synchronous activity for longer times. In order to test this assumption, we have systematically varied the network size, while maintaining the connectivity parameters constant. This variation is still insufficient to match experimental values, but burst duration is increased for larger networks, as seen in figure 9. Synaptic delays can be a potential mechanism for prolonging bursts further. By introducing synaptic delays (d max=32 ms), we have been able to prolong burst events by as much as 25–30 per cent. Owing to the computational overhead, most experiments do not consider synaptic delays, however.
Figure 9.
Dependence of burst properties on (a,b) network size and (c,d) connectivity range.
The range of lateral connectivity also plays a role in the generation of bursts. When varying the range of connectivity and the connection probability such that the average incoming drive to neurons is kept constant, bursts occur only if the synaptic footprint is large enough, suggesting that excitatory loops are essential for the emergence of seizure-like behaviour.
Owing to the variability in times between burst events, it is likely that bursts are triggered by fluctuations in network input. In order to test this hypothesis, we compute a cross-correlogram of the instantaneous (bin size of 10 ms) rates of input and the population rate of the network, on one hand, and of the inputs and burst events, on the other. Both show a strong peak for the network at a time lag of approximately 20 ms, as shown in figure 10 a. To further confirm that transient increases in input can, on their own, trigger bursts, we perform an additional experiment. We change the average frequency of the Poisson process in a short time window (of length 10 ms) and monitor whether or not a burst occurs 100 ms after this input increase. The cross-correlation of the input–output rates shows similar results to the initial experiment (figure 10 b). Additionally, the burst probability increases with the increase in frequency during the window, further supporting the idea of bursts as input triggered events (figure 10 c).
Figure 10.
(a) Cross-correlation between input and population rate for a 5 s trial, in bursting conditions (A EE=0.03). (b) Cross-correlation between input rate and burst events, for transient increases the input frequency by an amount Δf (A EE=0.02) (light grey curve, 5; dark grey curve, 15; black curve, 20). (c) Increase in burst probability, following a transient increase in input frequency.
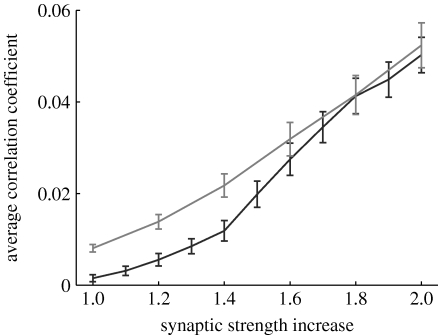
It is reasonable to assume that network bursts also lead to an increase in overall neuronal synchronization. More specifically, we analyse how network synchronization depends on average excitatory synaptic strength, the quantity affected by synaptic scaling (specifically, A EE and A EI). For different scaling factors, the network activity is analysed (10 trials, each lasting 10 s). A total of 1000 pairs of neurons are selected at random and the cross-correlation coefficient is computed for each pair. The average cross-correlation coefficients show that strengthening of lateral excitatory synapses increases the synchronization of individual neurons in the network (figure 11).
Figure 11.
Average correlation coefficient of neurons for an increase of average excitatory strength relative to baseline, for different values of τ syn (see text for details; black curve, 10 ms; grey curve, 5 ms).
The synaptic time constants used in our model are larger than those used in similar experiments (Houweling et al. 2005). However, these values do not play a critical role in the network dynamics. Theoretical work predicts that, for an exponentially coupled network of excitatory and inhibitory neurons, synchronized firing is facilitated by shorter synaptic decay times (Kanamaru & Sekine 2005). We observe the same result in simulation for τ syn=5 ms, after changing the synapse scaling parameters such that the total current of an ESP is preserved (namely, A EE=0.04, A EI=0.06, A IE=0.12, A II=0.12). Our experiments show an increase in synchronization at lower values of the excitatory coupling, for faster synaptic dynamics (figure 11, grey curve).
To summarize the results above, in the neuronal network model considered bursts are triggered by transient increases in the input, which are amplified by the recurrent excitatory architecture to a full network burst. The activation of the local inhibitory population, together with the depletion of synaptic resources terminates a burst event.
A.2. Model calibration
Current experimental data are insufficient for fully determining the parameters of the processes involved in TNF-α-mediated synaptic scaling. A reasonable constraint is that, under normal conditions, the synaptic scaling mechanism should be able to maintain homeostasis of neuronal activity. In particular, the synaptic regulation should be able to preserve the average firing of the neurons in response to changes in the input firing rate.
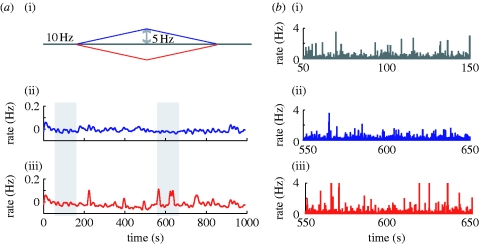
The specific experiment performed involves slow ramp changes in input (figure 12 a). As previously, the system is allowed 150 s to reach a homeostatic state before the input rates are modulated. The analysis focuses on two of the model parameters—the gain values for the TNF-α production as a function of glutamate (K glut) and the adjustment of excitatory synaptic strength as a function of TNF-α concentration (K c). The reciprocal of their product is an important parameter of the model and can be viewed as a total gain of the feedback loop (see appendix A.3).
Figure 12.
(a) Homeostatic regulation of activity in response to changes in input (i). The low-pass filtered population firing rate after an input increase (ii) or decrease (iii) is shown. (b) A closer view of the activity corresponding to the grey bars: after chronic input reduction (iii), the strengthening of excitatory synapses makes neuron firing more synchronized, compared with the homeostatic regime (i) or the reverse input change (ii). Population rates are estimated in 30 ms time bins.
As a calibration step, we select the gain that maintains the average population rate constant in time, independent of the change in input. For smaller gains, the homeostatic mechanism is not able to fully compensate for the changes in input, while for large gains the system overcompensates for these variations. As the gain defines a set of possible values for the two model parameters mentioned above, we select one such pair for the subsequent experiments. The particular choice can, however, be important for some pathological disruptions affecting the feedback loop (e.g. during an immune response), and the robustness of the system to such events can be enhanced by larger values for K c (see the analysis of the population behaviours below for a more detailed discussion).
For the selected parameters, the firing rates of the neuron population are maintained, as seen in figure 12 a (the time average is computed by convolving the output firing rate with a Gaussian kernel, with σ=6 s). A more detailed study of the structure of the population firing rate (figure 12 b) reveals similar firing patterns for the increase in input (blue) and constant firing (grey) regime. In the case of a chronic decrease in input (red), although the mean output rate is maintained the activity of individual neurons becomes more correlated, as the excitatory weights are increased to compensate for the input change.
A.3. Stability analysis
Although the homeostatic loop is not linear, looking at a large-scale linear approximation of the system may enhance our understanding of its behaviour. For a homogeneous connectivity structure, it is possible to consider a spatial average of the variables and construct a reduced model of the system, whose stability can be analysed in the framework of linear control systems.
The block diagram of the reduced system is shown in figure 13. Several assumptions are required for this approximation to be valid. Firstly, we consider the case of small variations around the fixed point. Hence, the two sigmoid functions that describe the processes translating glutamate in TNF-α and corresponding synaptic strength can be linearized around this fixed point. Secondly, we assume a linear mapping between the average value of excitatory synaptic strength and the glutamate level averaged for the neuronal population.
Figure 13.
Diagram of the large-scale linear approximation of the system.
More specifically, when considering the asymptotic value of the TNF-α concentration, as a function of glutamate, linearized around the fixed point c tnf0, together with the exponential decay, we obtain the transfer function for the TNF-α production as
 |
where  is the gain of the process.
Similarly, the transfer function for the synaptic strengths regulation is
 |
with  .
.
Based on the simulated data, we develop a phenomenological model of the network activity as a function of average synaptic strength and input frequency. For this, we consider average synaptic weights in the range of 0.4–0.6 and input frequencies between 8 and 12 Hz (10 trials are considered for each parameter pair). For each trial, the strength of excitatory synapses of each neuron is multiplicatively scaled such that w is the same for all neurons. The glutamate levels are estimated for 30 ms large bins and a low-pass filtered version of the signal is computed, similar to the averaging assumed for the glial cells. The resulting data points are fitted with a linear function by using the least mean-squares method, resulting in a transfer function, G 3(s)=α 3 with α 3=0.44.
The transfer function of the system can then be computed as
 |
After replacing the expressions for the transfer functions above, the stability analysis is reduced to studying the poles of G(s), i.e. the solutions s 1 and s 2 of the equation
The roots have negative real parts in all cases, and the output is oscillatory for complex solutions, corresponding to
 |
which reduces to a bound for the product K tnf K c<0.0643. The analytical results are confirmed by simulations in the neuronal network model. Firstly, experiments confirm that network dynamics do not change when the total gain of the feedback loop is maintained constant. Secondly, for the lesion experiment (80%, r=10), lower gains (K tnf K c=0.125) result in low burst probability (less than 10%), while for the underdamped regime (K tnf K c=0.0075) bursts occur in 80 per cent of the cases (results averaged over 10 trials), as predicted by the constraint on the product K tnf K c.
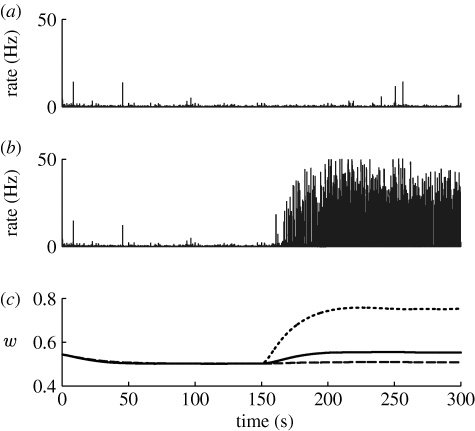
The actual values for the parameters K tnf and K c matter in the cases when disruptions are induced within the control loop, e.g. during inflammation. In this case, although the total gain is preserved, the network dynamics change, depending on how sensitive the synaptic strength is to TNF-α fluctuations. For a mild inflammatory state, induced by an homogeneous TNF-α source with c ext=10−5, the network can either remain stable or develop strong seizure-like patterns of activity, as a function of α 2 (figure 14). Note that the network dynamics prior to the disruption are virtually indistinguishable for all pairs, as predicted by the population-level analysis.
Figure 14.
Dependence of excitability increase following inflammation on K c, for constant total gain. (a) Population activity for K c =2.5, single trial. (b) Population activity for K c=0.025, single trial. (c) Time evolution of average excitatory strength for different values of K c, averaged over 10 trials (dashed curve, 2.5; solid curve, 0.25; dotted curve, 0.025).
References
- Aarli J.2000Epilepsy and the immune system. Arch. Neurol. 57, 1689–1692. 10.1001/archneur.57.12.1689. [DOI] [PubMed] [Google Scholar]
- Abbott L, Nelson S.2000Synaptic plasticity: taming the beast. Nat. Neurosci. 3, 1178–1183. 10.1038/81453. [DOI] [PubMed] [Google Scholar]
- Abbott L, Varela J, Sen K, Nelson S.1997Synaptic depression and cortical gain control. Science. 275, 220–224. 10.1126/science.275.5297.221. [DOI] [PubMed] [Google Scholar]
- Akassoglou K, Probert L, Kontogeorgos G, Kollias G.1997Astrocyte-specific but not neuron-specific transmembrane TNF triggers inflammation and degeneration in the central nervous system of transgenic mice. J. Immunol. 158, 438–445. [PubMed] [Google Scholar]
- Balosso S, Ravizza T, Perego C, Peschon J, Campbell I, De Simoni M, Vezzani A.2005Tumor necrosis factor-alpha inhibits seizures in mice via p75 receptors. Ann. Neurol. 57, 804–812. 10.1002/ana.20480. [DOI] [PubMed] [Google Scholar]
- Beattie E, Stellwagen D, Morishita W, Bresnahan J, Ha B, Von Zastrow M, Beattie M, Malenka R.2002Control of synaptic strength by glial TNF-α. Science. 295, 2282–2285. 10.1126/science.1067859. [DOI] [PubMed] [Google Scholar]
- Bechmann I, Galea I, Perry V.2007What is the blood-brain barrier (not)?. Trends Neuroimmunol. 28, 5–11. 10.1016/j.it.2006.11.007. [DOI] [PubMed] [Google Scholar]
- Damas P, Ledoux D, Nys M, Vrindts Y, De Groote D, Franchimont P, Lamy M.1992Cytokine serum level during severe sepsis in human IL-6 as a marker of severity. Ann. Surg. 215, 356–362. [DOI] [PMC free article] [PubMed] [Google Scholar]
- Deli M.A, Descamps L, Dehouck M.P, Cecchelli R, Joo F, Abraham C.S, Torpier G.1995Exposure of tumor necrosis factor-alpha to luminal membrane of bovine brain capillary endothelial cells cocultured with astrocytes induces a delayed increase of permeability and cytoplasmic stress fiber formation of actin. J. Neurosci. Res. 41, 717–726. 10.1002/jnr.490410602. [DOI] [PubMed] [Google Scholar]
- Fröhlich F, Bazhenov M, Sejnowski T.2008Pathological effects of homeostatic synapting scaling on network dynamics in diseases of the cortex. J. Neurosci. 28, 1709–1720. 10.1523/JNEUROSCI.4263-07.2008. [DOI] [PMC free article] [PubMed] [Google Scholar]
- Galic M, Riazi K, Heida J, Mouihate A, Fournier N, Spencer S, Kalynchuk L, Teskey G, Pittman Q.2008Postnatal inflammation increases seizure susceptibility in adult rats. J. Neurosci. 28, 6904–6913. 10.1523/JNEUROSCI.1901-08.2008. [DOI] [PMC free article] [PubMed] [Google Scholar]
- Giaume C, McCarthy K.1996Control of gap-junctional communication in astrocytic networks. Trends Neurosci. 19, 319–325. 10.1016/0166-2236(96)10046-1. [DOI] [PubMed] [Google Scholar]
- Gutierrez E.G, Banks W, Kastin J.1993Murine tumor necrosis factor alpha is transported from blood to brain in the mouse. J. Neuroimmunol. 47, 169–176. 10.1016/0165-5728(93)90027-V. [DOI] [PubMed] [Google Scholar]
- Haagmans B, von den Eertwegh A, Claassen E, Hoarzinek M, Schijns V.1994Tumour necrosis factor-α production during cytomegalovirus infection in immunosuppressed rats. J. Gen. Virol. 75, 779–787. 10.1099/0022-1317-75-4-779. [DOI] [PubMed] [Google Scholar]
- Hanisch U, Kettenmann H.2007Microglia: active sensor and versatile effector cells in the normal and pathologic brain. Nat. Neurosci. 10, 1387–1394. 10.1038/nn1997. [DOI] [PubMed] [Google Scholar]
- Houweling A, Bazhenov M, Timofeev I, Steriade M, Sejnowski T.2005Homeostatic synaptic plasticity can explain post-traumatic epileptogenesis in chronically isolated neocortex. Cereb. Cortex. 15, 834–845. 10.1093/cercor/bhh184. [DOI] [PMC free article] [PubMed] [Google Scholar]
- Izhikevich E.2003Simple model of spiking neurons. IEEE Trans. Neural Netw. 14, 1569–1572. 10.1109/TNN.2003.820440. [DOI] [PubMed] [Google Scholar]
- Kanamaru T, Sekine M.2005Synchronized firings in the networks of class 1 excitable neurons with excitatory and inhibitory connections and their dependences on the forms of interactions. Neural Comput. 17, 1315–1338. 10.1162/0899766053630387. [DOI] [PubMed] [Google Scholar]
- Kofuji P, Newman E.2004Potassium buffering in the central nervous system. Neuroscience. 129, 1045–1056. 10.1016/j.neuroscience.2004.06.008. [DOI] [PMC free article] [PubMed] [Google Scholar]
- Lucas S, Rothwell N, Gibson R.2006The role of inflammation in CNS injury and disease. Br. J. Pharmacol. 147, 232–240. 10.1038/sj.bjp.0706400. [DOI] [PMC free article] [PubMed] [Google Scholar]
- Meli D, Loefflera J, Baumann P, Neumann U, Buhlb T, Leppert D, Leib S.2004In pneumococcal meningitis a novel water-soluble inhibitor of matrix metalloproteinases and TNF-α converting enzyme attenuates seizures and injury of the cerebral cortex. J. Neuroinflam. 151, 6–11. [DOI] [PubMed] [Google Scholar]
- Moreno-Bote R, Parga N.2005Simple model neurons with AMPA and NMDA filters: role of synaptic time scales. Neurocomputing. 65, 441–448. 10.1016/j.neucom.2004.10.016. [DOI] [Google Scholar]
- Newman E.2003New roles for astrocytes: regulation of synaptic transmission. Trends Neurosci. 26, 536–542. 10.1016/S0166-2236(03)00237-6. [DOI] [PubMed] [Google Scholar]
- Nita D, Cissé Y, Timofeev I, Steriade M.2006Increased propensity to seizures after chronic cortical deafferentation in vivo. J. Neurophysiol. 95, 902–913. 10.1152/jn.00742.2005. [DOI] [PubMed] [Google Scholar]
- Ogoshi F, Yin H, Kuppumbatti Y, Song B, Amindari S, Weiss J.2005Tumor necrosis-factor-alpha (TNF-α) induces rapid insertion of Ca2+-permeable α-amino-3-hydroxyl-5-methyl-4-isoxazole-propionate (AMPA)/kainate (Ca-A/K) channels in a subset of hippocampal pyramidal neurons. Exp. Neurol. 193, 384–393. 10.1016/j.expneurol.2004.12.026. [DOI] [PubMed] [Google Scholar]
- Pan W, Zadina J, Harlan R, Weber J, Banks W, Kastin A.1997Tumor necrosis factor-α: a neuromodulator in the CNS. Neurosci. Biobehav. Rev. 21, 603–613. 10.1016/S0149-7634(96)00047-4. [DOI] [PubMed] [Google Scholar]
- Prat A, Biernacki K, Antel J.P.2005Th1 and Th2 lymphocyte migration across the human BBB is specifically regulated by interferon beta and copolymer-1. J. Autoimmunol. 24, 119–124. 10.1016/j.jaut.2005.01.004. [DOI] [PubMed] [Google Scholar]
- Rivest S, Lacroix S, Valliéres L, Nadeau S, Zhang L, Laflamme N.2000How the blood talks to the brain parenchyma and the paraventricular nucleus of the hypothalamus during systemic inflammatory and infectious stimuli. Proc. Soc. Exp. Biol. 223, 22–38. 10.1046/j.1525-1373.2000.22304.x. [DOI] [PubMed] [Google Scholar]
- Rosenberg G.A, Estrada E.Y, Dencoff J.E, Stetler-Stevenson W.G.1995Tumor necrosis factor-alpha-induced gelatinase B causes delayed opening of the blood-brain barrier: an expanded therapeutic window. Brain Res. 703, 151–155. 10.1016/0006-8993(95)01089-0. [DOI] [PubMed] [Google Scholar]
- Sebire G, Emilie D, Wallon C, Hery C, Devergne O, Delfraissy J, Galanaud P, Tardieu M.1993In vitro production of IL-6, IL-1 beta, and tumor necrosis factor-alpha by human embryonic microglial and neural cells. J. Immunol. 150, 1517–1523. [PubMed] [Google Scholar]
- Stellwagen D, Malenka R.2006Synaptic scaling mediated by glial TNF-α. Nature. 440, 1054–1059. 10.1038/nature04671. [DOI] [PubMed] [Google Scholar]
- Timofeev I, Grenier F, Bazhenov M, Sejnowski T, Steriade M.2000Origin of slow cortical oscillations in deafferented cortical slabs. Cereb. Cortex. 10, 1185–1199. 10.1093/cercor/10.12.1185. [DOI] [PubMed] [Google Scholar]
- Tsodyks M, Markram H.1997The neural code between neocortical pyramidal neurons depends on neurotransmitter release probability. Proc. Natl Acad. Sci. USA. 94, 719–723. 10.1073/pnas.94.2.719. [DOI] [PMC free article] [PubMed] [Google Scholar]
- Turrigiano G.2007Homeostatic signaling:the positive side of negative feedback. Curr. Opin. Neurobiol. 17, 318–324. 10.1016/j.conb.2007.04.004. [DOI] [PubMed] [Google Scholar]
- Turrigiano G, Nelson S.2004Homeostatic plasticity in the developing nervous system. Nat. Rev. Neurosci. 5, 97–107. 10.1038/nrn1327. [DOI] [PubMed] [Google Scholar]
- Turrigiano G, Leslie K, Desai N, Rutherford L, Nelson S.1998Activity-dependent scaling of quantal amplitude in neocortical neurons. Nature. 391, 892–896. 10.1038/36103. [DOI] [PubMed] [Google Scholar]
- Vezzani A.2005Inflammationn and epilepsy. Epilepsy Curr. 5, 1–6. 10.1111/j.1535-7597.2005.05101.x. [DOI] [PMC free article] [PubMed] [Google Scholar]
- Vezzani A, Granata T.2005Brain inflammation in epilepsy: experimental and clinical evidence. Epilepsia. 46, 1724–1743. 10.1111/j.1528-1167.2005.00298.x. [DOI] [PubMed] [Google Scholar]
- Vitkovic L, Bockaert J, Jacque C.2000“Inflammatory” cytokines: neuromodulators in normal brain?. J. Neurochem. 74, 457–471. 10.1046/j.1471-4159.2000.740457.x. [DOI] [PubMed] [Google Scholar]
- Volterra A, Meldolesi J.2005Astrocytes, from brain glue to communication elements: the revolution continues. Nat. Rev. Neurosci. 6, 626–640. 10.1038/nrn1722. [DOI] [PubMed] [Google Scholar]
- Yuhas Y, Weizman A, Ashkenazi S.2003Bidirectional concentration-dependent effects of tumor necrosis factor alpha in Shigella dysenteriae-related seizures. Infect. Immun. 71, 2288–2291. 10.1128/IAI.71.4.2288-2291.2003. [DOI] [PMC free article] [PubMed] [Google Scholar]


