Abstract
Young mussel beds on soft sediments can display large-scale regular spatial patterns. This phenomenon can be explained relatively simply by a reaction–diffusion–advection (RDA) model of the interaction between algae and mussel, which includes the diffusive spread of mussel and the advection of algae. We present a detailed analysis of pattern formation in this RDA model. We derived the conditions for differential-flow instability that cause the formation of spatial patterns, and then systematically investigated how these patterns depend on model parameters. We also present a detailed study of the patterned solutions in the full nonlinear model, using numerical bifurcation analysis of the ordinary differential equations, which were obtained from the RDA model. We show that spatial patterns occur for a wide range of algal concentrations, even when algal concentration is much lower than the prediction by linear analysis in the RDA model. That is to say, spatial patterns result from the interaction of nonlinear terms. Moreover, patterns with different wavelength, amplitude and movement speed may coexist. The results obtained are consistent with the previous observation that self-organization allows mussels to persist with algal concentrations that would not permit survival of mussels in a homogeneous bed.
Keywords: self-organization, mussel bed, differential-flow instability, bifurcation, spatially explicit models
1. Introduction
The study of pattern formation in reaction–diffusion (RD) systems is a very active area of research. Following Turing's (1952) work, many studies have focused on the mechanism behind the formation of regular patterns throughout science. Today Turing's scenario lies at the heart of many applications attempting to explain patterns in fish skin, mammalian coat markings, phyllotaxis, predator–prey systems, terrestrial vegetation, plankton, intertidal communities and so on (Hassell et al. 1991; Murray 1993; Rovinsky et al. 1997; Gurney et al. 1998; van de Koppel & Crain 2006; Rietkerk & van de Koppel 2008). RD models can exhibit a great variety of spatial patterns (see Cross & Hohenberg (1993), Murray (1993) and Maini et al. (1997) for reviews). However, their relevance to biological systems has been criticized due to their extreme sensitivity to parameter values. Murray (1993) has illustrated this by linear stability analysis and showed that the parameter regime in which a number of RD models gave rise to diffusion-driven instability is really very small. Hence, there is a clear need for a thorough mathematical analysis of case studies that reveal Turing-like patterns in biological systems.
The role of flow in pattern formation has been studied only recently. Differential flow, which is flow of species at different rates (Rovinsky & Menzinger 1992; Rovinsky et al. 1997; Sherratt 2005; Liu et al. 2008), has been shown to have a similar destabilizing effect on the homogeneous steady state in reaction–diffusion–advection (RDA) systems as differential diffusion has in the Turing case. The potential result of differential-flow instability (DIFI) is periodic travelling waves. Analysis of a generic RDA model revealed the domain in which spatial patterns occur and clarified the relation between Turing and DIFI patterns. In particular, it was shown that DIFI waves exist in parameters space that lies outside the Turing domain (Satnoianu & Menzinger 2000; Satnoianu et al. 2001). There is a broad potential application for DIFI mechanisms in explaining wave-like patterns, as is indicted by the occurrence of travelling wave patterns in animal growth, flow of cells, gene oscillations, early embryo development (Palmeirim et al. (1997) and Kaern et al. (2002), in which these cases correspond to the special case: the flow rate of one species is zero and the other one is not), skin patterning or gametogenesis. Moreover, DIFI patterns are very robust, with a wide domain of pattern occurrence in parameter space when compared with stationary pattern forming systems such as Turing patterns in RD systems.
Recently, many examples have emerged in the literature pointing at regular self-organized patterns in a broad range of ecosystems, such as arid vegetation, peat lands and mussel beds (Klausmeier 1999; Rietkerk et al. 2004; van de Koppel et al. 2005; Rietkerk & van de Koppel 2008). In a number of these studies, the mechanisms that were highlighted followed the RDA or DIFI framework. An example is the blue mussel Mytilus edulis, which is an important component of many intertidal ecosystems and a main resource for aquaculture (King et al. 1990; Dobretsov & Wahl 2008). Beds of young M. edulis in the Wadden Sea are typically characterized by banded patterns that are aligned perpendicular to the average incoming tidal flow, and have a wavelength of approximately 6 m. Within these bands, mussel can reach high densities of over 30 kg m−2 fresh weight, alternating with almost bare sediment in the interband areas. Van de Koppel et al. (2005) provided a potential explanation for the emergence of banded patterns, based on the scale difference in facilitation between neighbouring mussels and competition among the mussels for algal food sources. The scale difference was caused by the flow of the algae in the water with the tidal currents, causing mussels to compete over extensive distances.
In this paper, we provide a systematic analysis of the model of mussel stripe formation proposed by van de Koppel et al. (2005), extending the analysis in two directions presented in that paper. First, we compare the parameter regimes by linear analysis in which the mussel patterns occur with nonlinear analysis, focusing on their parametric sensitivity. Second, we assess the influence of the form of the nonlinearity in the kinetics on mussel pattern speed, amplitude and wavelength. We investigate the hypothesis that DIFI yields a richer class of patterns which are found in a larger parameter range than those obtained from Turing instability. Our mathematical analysis may provide a putative explanation for the widespread occurrence of banded patterns in mussel beds and other striped ecosystems.
2. Model
The spatio-temporal dynamics of mussel growth and survival in soft sediment mussel beds are determined to a large extent by the availability of algal food sources and loss rates due to dislodgment and predation (Cote & Isabelle 1999; van de Koppel et al. 2005). Dislodgment and predation strongly depend on local mussel density, because nearby conspecifics are the main substrate for attachment on soft sediments. The effects of competition are spread out over much large distances because water that is depleted in algae by the mussels is carried over the mussel bed by the tidal currents. Based on a simple mathematical model, van de Koppel et al. (2005) have recently hypothesized that this scale-dependent interaction between short-range facilitation and long-range competition for algae could explain the observed patterning in mussel beds.
The hypothesis of van de Koppel et al. (2005) has been formulated in two coupled differential equations for mussel biomass M(x, t) on the sediment and algae A(x, t) in the water layer overlying the mussel bed,
 |
2.1a |
 |
2.1b |
where A up describes the concentration of algae in the benthic boundary layer; f is the rate of exchange between the boundary layer and the upper water layers; c is a consumption constant; and h is the height of the lower water layer. Advection by tidal current is represented by the gradient operator ∂ A/∂ X multiplied by the advection constant V. Parameter e is the conversion constant of ingested algae to mussel production; d M is the maximal per capita mussel mortality rate; k M is the saturation constant; and D is the diffusion rate of the mussels. Here, we assume that movement of mussels is random and therefore adopt the classical diffusion approximation, where diffusion is a linear function of the Laplacian operator ∂ 2 M/∂ X 2. Note that here we simply assume that flow of water is the main source of transport for algae, and that diffusion (in the horizontal dimension) can be neglected. This is a simplification of course, but it shows that diffusion is not essential to explain the patterns. With parameter values as in table 1, van de Koppel et al. (2005) showed numerically that system (2.1a) and (2.1b) can be used to predict mussel bed stripe formation. Hence, at a general level, the model of van de Koppel et al. (2005) provided a potential explanation for the patterning observed in natural mussel beds, but a mathematical analysis of spatial instability and the characteristics of the developing spatial patterns is currently lacking. In this paper, we present a mathematical analysis of the conditions for development of spatial patterns, and analyse how the properties of the periodic solution depend on parameter values.
Table 1.
Parameter values used in the nonlinear analysis and simulation are from the study of van de Koppel et al. (2005). (For the numerical simulation went way faster for two-dimensional space PDEs (2.1a) and (2.1b) (or equations (3.2a) and (3.2b)), we multiplied e, d M and D with the same constant factor EX, but the predictions were the same as EX=1.)
| symbol | value | unit | source | comments |
|---|---|---|---|---|
| A up | 1 | g m−3 | Cadee & Hegeman (2002) | algae density in upper water layer |
| H | 0.1 | m | Wildish & Kristmanson (1984) and Muschenheim & Newell (1992) | height of lower water layer |
| f | 100 | m3 m−3 h−1 | van de Koppel et al. (2005) | exch. rate between lower and upper |
| c | 0.1 | m3 g−1 h−1 | Scholten & Smaal (1998) and Riisgard (2001) | consumption constant |
| e | 0.21×EX | g g−1 | Sukhotin et al. (2002) | ingested constant |
| d M | 0.02×EX | g g−1 h−1 | van de Koppel et al. (2005) | maximum per capita mussel mortality rate |
| k M | 150 | g m−2 | van de Koppel et al. (2005) | saturation constant of mussel |
| V | 360 | m h−1 | Brinkman et al. (2002) | advection constant algae |
| D | 0.0005×EX | m2 h−1 | Cadee & Hegeman (2002) | diffusion rate of mussel |
3. Conditions for patterns formation
To simplify, we rescale the system (2.1a) and (2.1b) as follows:
 |
3.1 |
These rescalings are taken from van de Koppel et al. (2005), although our notation is different. The resulting dimensionless equations are
 |
3.2a |
 |
3.2b |
In this case, the non-dimensional model has only four essential parameters that determine the dynamics of the model: renewal rate α; water flow rate β; scaled potential growth rate δ; and mussel maximal mortality γ. Therefore, in the remainder of the paper we study dimensionless equations (3.2a) and (3.2b), focusing on the conditions for patterning, and the way in which the patterns vary with these four parameters.
For all parameter values, system (3.2a) and (3.2b) has a stable trivial steady state a=1, m=0, corresponding to the existence of algae and absence of mussels. When δ>γ>δα, a non-trivial homogeneous steady state defined by
 |
3.3 |
By the linear analysis in appendix A and straightforward manipulation of (A 5) one obtains the dispersion relation expressed as
 |
3.4 |
where j=±1, and Re λ and Im λ denote the real part and imaginary part of λ, respectively. Although there is no Turing instability in system (3.2a) and (3.2b) (see appendix B), note that the dispersion relation (A 4) is similar to the relation for linear dispersion in RD systems (Satnoianu et al. 1998, 2001; Satnoianu & Menzinger 2000; Satnoianu 2003; Míguez et al. 2006), in which the Turing case is included. This indicates that we might expect a preferred direction for any possible instability mechanism resulting from equation (A 4) or directly from expression (3.4).
The condition for a spatial mode (referred as k) to be unstable and thus to grow into a pattern is that Re λ>0. Therefore, pattern formation will occur if Re λ>0 for any values of k≠0. In appendix C, we derive that the trivial state (1, 0) is linearly stable to non-uniform perturbations (Re λ>0). On the other hand, the non-trivial state (a
s, m
s) exhibits a stationary finite wavenumber instability also known as the Turing instability (Turing 1952; Cross & Hohenberg 1993; Murray 1993). For general advection–diffusion equations, this was first investigated by Jorne (1974), with a number of subsequent studies. In particular, previous analysis (Rovinsky & Menzinger 1992; Perumpanani et al. 1995; Satnoianu et al. 1998; Sherratt 2005) shows that spatial patterns occur if the advection rate (β in equations (3.2a) and (3.2b)) is above critical values, but the authors are unable to obtain an analytical expression for these critical values. So it is important to identify this parameter for the particular problem of mussel stripes. In what follows, we consider the equations (3.2a) and (3.2b) for the parameter values in table 1 with β and δ allowed to vary and take j=1 in equation (3.4), since we need only consider the maximum value of Re λ. At β=β
c≃13.0, there exists λ(k=k
c)=0,  and
and  , where k
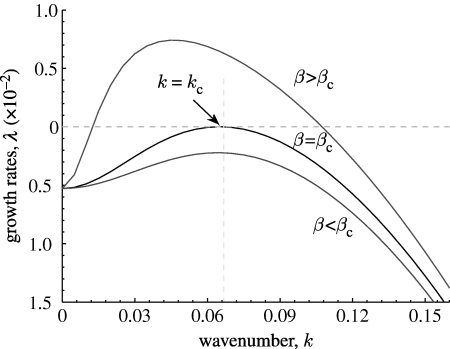
c=0.065 is the critical wavenumber, as is shown in figure 1, as well as in movie-growth 1 (see the electronic supplementary material and http://7y.nuc.edu.cn/jinzhen/English1.aspx). For β>β
c, the uniform state (a
s, m
s) becomes unstable to a continuous band of wavenumbers. Note that Re λ<0 at k=0 reflecting the purely temporal stability of this state in the non-spatial model.
Figure 1.
An illustration of growth rate, λ(k), according to equation (A 5) (see movie-growth 1 in the electronic supplementary material). The critical mode k=k c≃0.065 is obtained at β=β c≃13.0 (middle), while other curves correspond to (bottom) β=10.0 and (top) β=41.0. The other parameter values are based on the estimates of table 1: α=0.6667, γ=0.1333 and δ=0.140.
From equation (3.4) we can derive the DIFI neutral curves, i.e. those curves in β–k space on which Re λ=0. After a simple calculation we find that these are given by
 |
3.5 |
A necessary condition for equation (3.5) to hold is that k
2<b
22 since b
11<0 and Δ>0. Generically, equation (3.5) has a strictly positive minimum β
c, and DIFI is predicted for all β>max{0, β
c}. The expression on the right-hand side of equation (3.5) is positive for all k within  and the neutral curve β=β(k, δ) has a minimum at a non-zero value of β=β
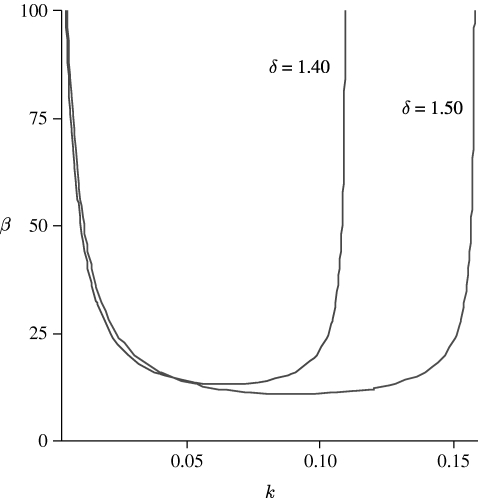
c>0. A graph of a typical neutral curve as given by equation (3.5) is shown in figure 2. This figure shows that the neutral curve is convex with a unique minimum in the range
  having vertical asymptotes at k=0 and
  and 0.1582, respectively. Note that in fact β
c=β
min=β(k
c, δ) and the most unstable mode k
c is obtained by solving ∂β/∂k=0.
Figure 2.
A typical neutral curve β, defined in equation (3.5) for different δ. The other parameter values are based on the estimates of table 1: α=0.6667 and γ=0.1333.
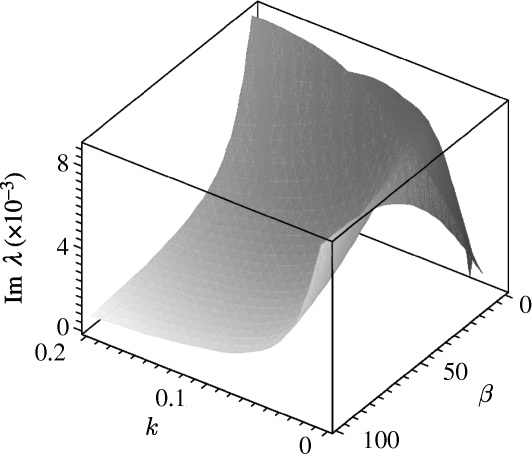
From the above analysis, we now deduce two important conclusions based on dispersion relation (A 5). First, Im λ≠0 for all  (figure 3) and β>β
c, which leads naturally to a pattern classification that is periodic in both space and time. Hence, this is a type I
0 system, following Cross & Hohenberg (1993), also referred to as spatial periodic travelling waves (see §4). Second, the emergence of the spatially periodic patterns (as observed in field given by van de Koppel et al. 2005) is found for a wide range of flow rates β, with a lower bound of β
c. This conclusion can be confirmed by using the data in table 1, which derives to the non-dimensional β=41.5692, which is more than the critical value of 13.0. In addition, it is instructive to note that the critical DIFI wavenumber does not equal the critical wavenumber provided by Turing theory (Murray 1993), since no stationary space-periodic DIFI waves are found in system (3.2a) and (3.2b) by stationary bifurcation analysis (see Satnoianu et al. (1998, 2001) and Satnoianu & Menzinger (2000) for full details).
Figure 3.
An illustration of imaginary values of λ, defined in equation (3.4) for different β. The other parameter values are based on the estimates of table 1: α=0.6667, γ=0.1333 and δ=0.140.
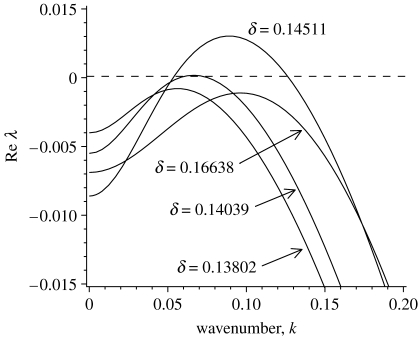
We now define an extended DIFI bifurcation as a bifurcation to spatial-periodic solutions in a coupled RDA system from a spatially homogeneous reference state (which may be temporally stable or unstable). Near the bifurcation onset, wavenumber selection can be addressed using a weakly nonlinear analysis (Cross & Hohenberg 1993; Hoyle 2006). However, numerical integration of system (3.2a) and (3.2b) on a large domain (L≫2π/k c≡L c≃96.6644) with either periodic or fixed boundary conditions, slightly above β c yields large amplitude periodic patterns whose amplitudes approach (1, 0) and (a s, m s). This behaviour indicates the presence of a subcritical bifurcation, i.e. the branch of periodic states should bifurcate first, in direction β<β c (Kuznetsov 2004). Thus, in our case a weakly nonlinear analysis will not provide substantial insights into the nonlinear problem of pattern selection. Note that we also find that there exists a similar relation for parameter δ, but the difference is that the large δ leads again to a stable state for the homogeneous state. These can be seen from figures 4 and 9, as well as in movie-growth 2 in the electronic supplementary material.
Figure 4.
An illustration of growth rate, Re λ(k), according to equation (A 5). The critical mode k=k c is obtained for the first instable at δ=δ c≃0.14039, while other curves correspond to different β. Note that for the homogeneous, the larger δ leads to stable again (see movie-growth 2 in the electronic supplementary material). The other parameter values are based on the estimates of table 1: α=0.6667, γ=0.1333 and β=13.0.
Figure 9.
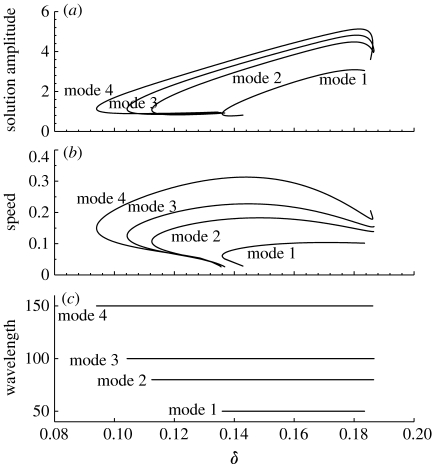
Bifurcation diagrams of pattern solutions in the ODEs (4.1). Solid lines correspond to solutions that include the stable/unstable solutions. We plot: (a) solution amplitude; (b) speed; and (c) wavelength as a function of parameter δ. The parameter values are based on the estimates of table 1: γ=0.1333, β=41.5692 and α=0.6667. The solution branches with different spatial modes arise via separate Hopf bifurcations.
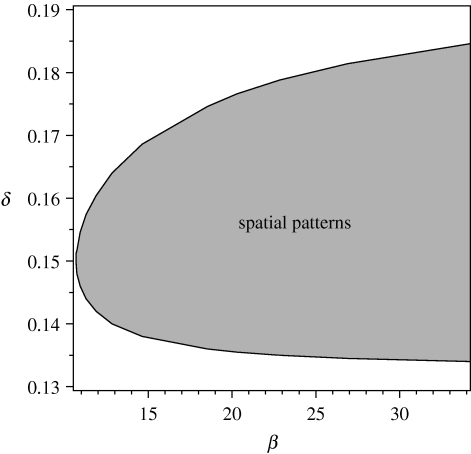
Figure 5 illustrates the results of a numerical analysis of stability within the (β, δ) space, obtained by computing the maximal Re λ directly from formula (A 5). Recall that δ is linearly related to the algal concentration A up, while β is a measure of advection constant V in table 1. Intuitively, figure 5 can be explained as follows: if δ (e.g. algal concentration) is too small, then mussels will simply die out. On the other hand, if δ is sufficiently large, then the competition among mussels for algae will not be very strong, resulting in homogeneous mussel. For intermediate levels of algal concentration, mussels can survive but with strong competition among mussels for algae, leading to the development of a striped mussel bed. The dependence of the lower threshold on β occurs because large advection will increase the competitive advantage of mussels in areas of high mussel density over those in low-density areas. So advection must be limited by a lower bound to form spatial patterns.
Figure 5.
The numerical calculation of stability on (β, δ) space. Numerical calculation of Re λ(k) from (A 5) implies that a striped pattern will form for parameters indicated by the shaded domain, between the two solid curves. The parameter values are based on the estimates of table 1: α=0.6667 and γ=0.1333.
To understand the pattern selection mechanism, we first use the method of spatial dynamics (Champneys 1998; Yochelis et al. 2008) presented below, which was found to be an effective method to explore the properties of the steady-state solutions (Burke & Knobloch 2006; Yochelis et al. 2006; Gomila et al. 2007; Sherratt & Lord 2007; Knobloch 2008) of the spatial system.
4. Existence and properties of pattern solutions
A key issue for mussel bed stripes is to determine their wavelength and pattern speed, and the way in which these vary with model parameters. Note that some insight into the wavelength and speed can be obtained from linear analysis (Sherratt 2005). When patterns occur, one expects that these will be dominated by the fastest growing mode (k c) although this only holds when the parameters are sufficiently close to the DIFI bifurcation curve defined by equation (3.4). However, these are properties of the nonlinear system (3.2a) and (3.2b), and a detailed investigation requires nonlinear analysis (Perumpanani et al. 1995; Satnoianu et al. 2001), which is the scope of §5.
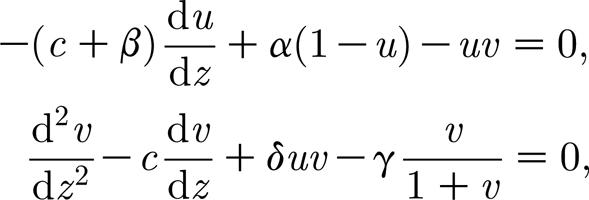
When Re λ≠0 and Im λ≠0 in dispersion relation (3.4) (i.e. λ is a complex number), a Hopf bifurcation occurs which gives rise to space- and time-periodic travelling DIFI waves. From an ecological viewpoint, some field studies report such movement. Although van de Koppel et al. (2005) have showed that the mature mussel bands do not move much in the real world because the mussels fix themselves when they get older, young mussels move around extensively (or move around by the waves), and the wavelength of the pattern is, on average, approximately 6 m (i.e. approx. 103.9230 units in the dimensionless system (3.2a) and (3.2b)). We use numerical analysis to investigate pattern form, wavelength selection, and their dependence on model parameters in the fully nonlinear regime by using numerical analysis. The numerical analysis suggests that system (2.1a) and (2.1b) does not have any stationary patterns, with the homogeneous steady states being the only stationary solution. Instead, the patterns move at a constant speed, so that they have the mathematical form a(x, τ)=u(z) and m(x, τ)=v(z), where z=x+cτ and c is the migration speed; the patterns are periodic travelling wave solutions. Substituting these solution forms into (3.2a) and (3.2b) gives the ordinary differential equations (ODEs; Murray 1993; Ai & Huang 2005; Yochelis et al. 2008)
 |
4.1 |
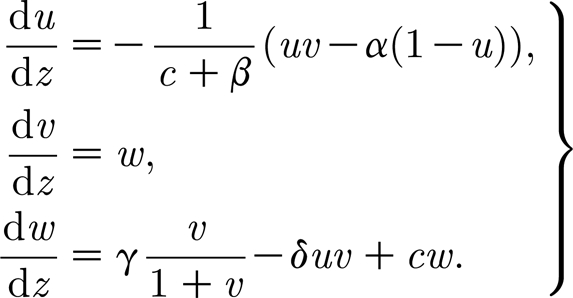
where z is now treated as a variable. This second-order system of ODEs predicts spatial periodic wave forms in the co-moving frame. Equation (4.1) can then be written as a system of three first-order ODEs in the standard way
 |
4.2 |
Steady-state solutions of this system are of the form (u, v, w)=(a s, m s, 0), with (a s, m s) being the spatially uniform steady-state solutions of equations (3.2a) and (3.2b). There exist a monotone or oscillatory travelling waves solutions with respect to z from −∞ to +∞ in equation (4.2) when the parameters lie outside the Hopf instability, which correspond to a heteroclinic orbit that connects the trivial uniform steady-state solution (1, 0, 0) and non-trivial uniform steady-state solutions (u, v, w)=(a s, m s, 0). By contrast, the periodic travelling wave solutions will emerge when Hopf instability occurs.
Standard linear analysis of equations (4.2) reveals that a Hopf bifurcation occurs when the wave speed drops below a critical value c Hopf. Steady-state solutions are generally stable for speeds above c Hopf but unstable for speeds below c Hopf. This Hopf bifurcation point is the point of origin for travelling wave families and can be calculated analytically (we omit the calculation here for brevity). Using the software package Auto (Doedel et al. 2001) we track the family of travelling wave solutions that arise from c Hopf in equations (4.2) and study the changes in the wave family shape caused by varying parameter values. We use Auto to locate a particular periodic solution (a periodic travelling wave) to equations (4.2), and then track how the properties of that periodic travelling wave vary as we gradually change the equation parameters. We first use Auto to compute the eigenvalues for equations (4.2) with a given set of parameters and (u, v, w)=(a s, m s, 0), for c increasing through c Hopf identifying the position of the Hopf bifurcations. We then continue along the bifurcation curve by increasing c.
We first located the wave speed at which a Hopf bifurcation occurs in equation (4.2), using the homogeneous steady state of system (4.2) as a starting point. When c=0 this steady state is stable, but provided β is sufficiently large (β>β c), the system undergoes a Hopf bifurcation as c is increased. The periodic solutions that emanate from this Hopf bifurcation are the slowly moving patterns that correspond to mussel stripes, where the spatial wavelength equals the period. As c is increased beyond the Hopf point, the steady state is at first unstable, but regains stability through a second Hopf bifurcation. Here, we use the terms ‘stable’ and ‘unstable’ as referring to the ODEs (4.2) rather than the model partial differential equations (PDEs) (3.2a) and (3.2b). There is no direct relationship between the stability of solutions in one system and the stability in the other. Determination of periodic-travelling wave stability, even numerically, is a notoriously difficult problem (Sandstede & Scheel 1999, 2000; Sandstede 2002).
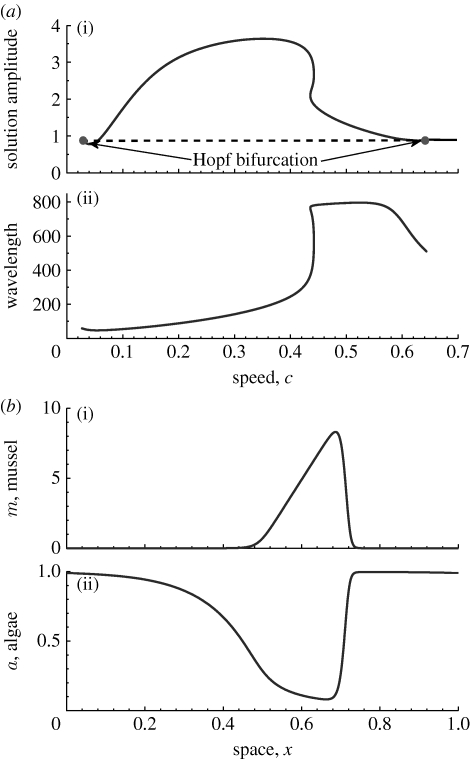
A typical bifurcation diagram and associated spatial solutions are illustrated in figure 6, which shows that for large values of β, changes in stability occur via Hopf bifurcations with respect to speed c, from which a single branch extends that links the two Hopf points. When the speed is above the critical values c c, equilibrium stability is lost and a periodic orbit emanates. We present the bifurcation diagrams for solution amplitudes in figure 6, using the standard definition for the L 2-norm
 |
4.3 |
to distinguish among solutions, where L and U k(x) (k=1, 2, 3) are the spatial period and three variables of equation (4.2), respectively. Note that the standard interval [0,1] is used in the interval of integration by Auto (Doedel et al. 2001). Careful investigation shows that the periodic orbits are formed by bifurcation with an intermediate range of speeds; for large speed no pattern solutions occur (figure 6 a). This is also illustrated by the plot of pattern wavelength against speed c in (ii) of figure 6 a, which uses the same parameter values as (i) of figure 6 a. The wavelength initially increases with c being increased, reaches a maximum, and then decreases in the bifurcation diagram.
Figure 6.
Typical bifurcation diagrams and spatial solutions for the pattern ODEs (4.1). (a) (i) The homogeneous steady state of (4.2) is stable (solid dark line) for large values of the speed c, but unstable (dashed line) at intermediate values of c. The changes in stability occur via Hopf bifurcations, from which branches of periodic orbits (filled circles) emanate; these are the mussel stripe patterns. (ii) The wavelength along the periodic orbit branches. (b) Snapshots of spatial periodic travelling solution within unit period/wavelength (scaled as [0,1]) for instant time. The parameter values are based on table 1 but EX=1000: (a,b) α=0.6667, γ=0.1333, δ=0.14 and β=41.5692.
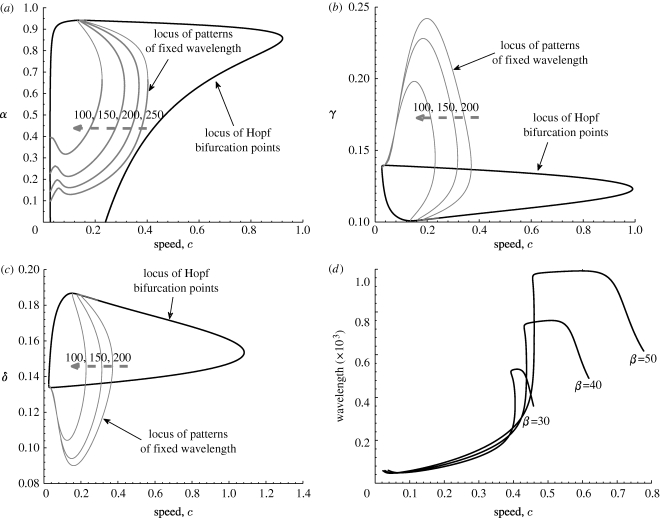
From a practical viewpoint, one may also be concerned about the effect of other parameters such as α, γ and δ on the solution amplitude and wavelength. Using Auto, we track the locus of both the Hopf bifurcation points and the fixed wavelength in the two-dimensional parameter planes. Figure 7 a presents a bifurcation analysis of the c–α parameter plane. As c is increased, the two Hopf bifurcation points move towards one another and eventually meet, so that the locus of Hopf points becomes a single curve. The maximum value of c along this curve corresponds to the maximal velocity of mussel bed patterning. Patterned solutions exist for all combinations of c and α lying in between these two loci. Using Auto, we also track the loci of patterns for particular wavelengths (figure 7, thin curves). Each curve belonging to a particular wavelength emanates from the Hopf bifurcation, and ends at the other branch (figure 7 a). Note that for any given value of the migration speed c (below the fold point), large α is required for different pattern coexistence. In ecological terms, this suggests that the enhanced maximal rate of exchange between the lower- and upper water layers f also will lead to coexistence of different patterns. The corresponding loci are shown for the c–γ and c–δ planes in figure 7 b,c, respectively. The basic structure is the same; in both cases, all the loci of patterns of fixed wavelength are close to the Hopf bifurcation curve. The minimum of δ and the maximal values of γ required for fixed wavelength are exactly predicted by nonlinear analysis, which correspond to the steady state (a s, m s, 0) becoming unstable to inhomogeneous perturbations.
Figure 7.
An illustration of the variations in parameter space of the solution structure of the pattern ODEs (4.1). We plot the loci of Hopf bifurcation points and patterns of fixed wavelength for (a) α versus c, (b) γ versus c and (c) δ versus c. In (a–c) the value of the wavelength along the dashed curve is 20 000. (d) Comparison of travelling wave families for system (4.2) with different values of the parameter β (labelled). The parameter values are based on the estimates of table 1: γ=0.1333, δ=0.140, β=41.5692 and α=0.6667.
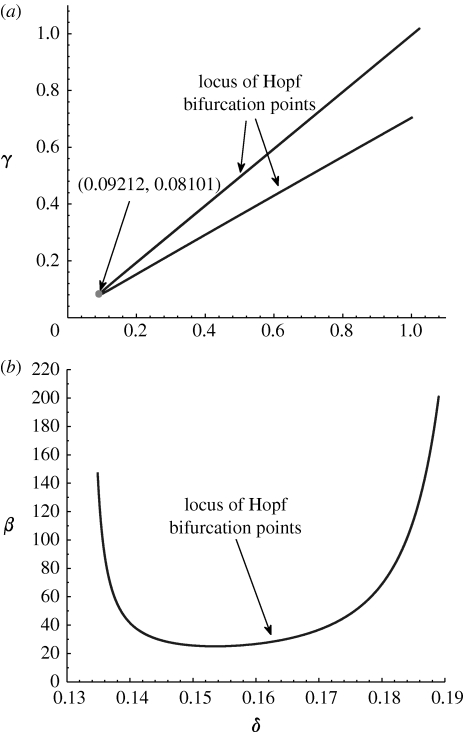
Next, we track the loci of Hopf bifurcation points for particular wave speed c at 0.6433. Figure 8 a,b presents a bifurcation analysis of the δ–γ and δ–β parameter planes, respectively. As δ is decreased, the two Hopf bifurcation points move towards one another and eventually meet together, at a bifurcation of higher co-dimension (seen as the cusps in figure 8 a). Patterned solutions exist for values of δ and γ lying in between these two loci. Figure 8 b presents the nonlinear bifurcation analysis of predicted δ–β parameter plane for the fixed wave speed. Note that the ‘U’-shape is the same as the linear prediction results for appropriate speed value due to the equilibrium independent of β (cf. figure 5). Hence, the limited value of β can be predicted by both linear and nonlinear analysis.
Figure 8.
An illustration of the variations in parameter space of the solution structure of the pattern ODEs (4.1). We plot the loci of Hopf bifurcation points for fixed wave speed at c=0.6433 for (a) δ versus γ and (b) δ versus β. The parameter values are based on the estimates of table 1: γ=0.1333, δ=0.140, β=41.5692 and α=0.6667.
The above results give a detailed understanding of the existence of patterned solutions for a mussel bed, as a function of the model parameters α, γ and δ and the speed c of spatial pattern, as well as β (see §3). Moreover, we also find that for these equations (4.2) c Hopf only exists when β>β c. If a Hopf bifurcation exists for a chosen value of β then the wave family can be calculated by using an identical procedure as described above. We provide an Auto analysis given in the electronic supplementary material (mussel-auto1.tar.gz).
In the following, we concentrate on the effects of algal concentration on the spatial patterns. Figure 9 illustrates the comparison of bifurcation diagrams of pattern solution with different fixed wavelength. For a sufficiently large value of δ, no pattern formation occurs, because the homogeneous equilibrium is resistant to small spatially heterogeneous perturbations. As δ is decreased, the steady state becomes unstable via a Hopf bifurcation at δ≃0.188 (figure 9), which is consistent with the bifurcation analysis of system (3.2a) and (3.2b) (van de Koppel et al. 2005) and our prediction in §3 (figure 5). The branch of periodic solutions emanating from this Hopf bifurcation is spatially as well as temporally periodic, with a wavelength of 100. This is a mode 3 pattern. If we continue this branch, both δ and the solution amplitude gradually decrease until reaching a limited point, after which δ then increases. The speed approaches zero, while the amplitude tends to a non-zero finite limit.
Note that the upper limit of δ with respect to pattern formation is exactly as predicted by the linear analysis in figure 5, and corresponds to steady state (3.3) becoming unstable to inhomogeneous perturbations, owing to DIFI. However, the minimum value of δ where DIFI is predicted by the linear analysis (where δ=γ) exceeds the level where stable patterns are predicted by nonlinear analysis in figure 9, namely the minimal value of δ below which a positive homogeneous equilibrium (3.3) does not exist. Hence, spatial patterns occur in a range that well exceeds the range for which DIFI is predicted, as a result of the nonlinear nature of model (3.2a) and (3.2b). In addition, the patterns with a variety of different wavelengths, speeds and amplitudes may coexist for the intermediate δ, namely algal concentration (figure 9). These have been confirmed by numerical simulation with equation (3.2a) and (3.2b) (figures 10 and 11), as well as the field observation (figure 12). In our understanding, this is caused by the nonlinear interaction in model (3.2a) and (3.2b).
Figure 10.
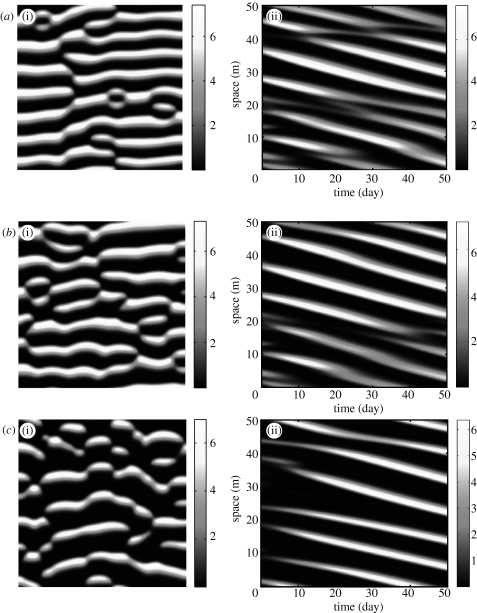
An illustration of the spatial patterns and spatio-temporary formation in mussel density on the sediment from equations (3.2a) and (3.2b). (i) Simulation spatial pattern in two-dimensional space, (ii) space–time plots showing the temporal evolution. The parameter values are based on the estimates of table 1, rescaled parameter values used: γ=0.1333, β=41.5692, α=0.6667. (a) δ=0.140>γ; (b) δ=γ=0.1333, (c) δ=0.12<γ.
Figure 11.
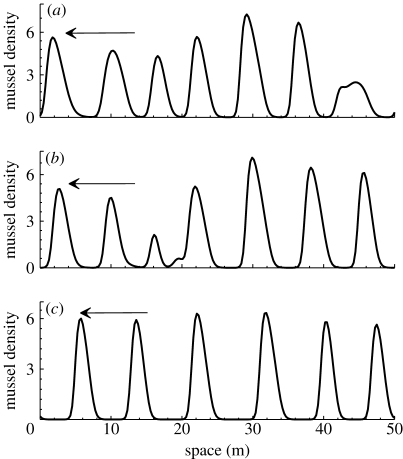
An illustration of typical spatial patterns after 50 days in mussel density. There are periodic patterns of peaks in mussel density m, separated by regions in which mussel is almost absent. The arrows indicate the direction of movement. The parameter values correspond to (a–c) in figure 10.
Figure 12.
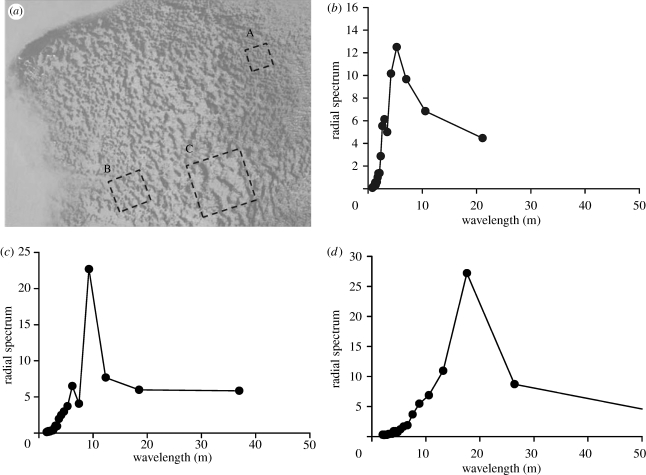
An illustration of different wavelengths occurring in a single mussel bed. (a) A patterned mussel bank in the Wadden Sea, The Netherlands (53°27.64′ N, 6°13.95′ E taken on 12 October 2001). (b–d) Spectral analysis of the mussel patterns as observed in three cut-outs A, B and C, respectively, within the aerial image. The three graphs represent the amount of variance explained by a cosine of a specific wavelength, as specified by the x-axis direction.
5. Numerical results
In the previous sections, we provided a detailed understanding of the effects of parameters β, δ and c (wave speed) on spatial patterns. Note that the wave speed is not a parameter in system (3.2a) and (3.2b), but rather is a property of the PDEs (3.2a) and (3.2b). We find that for system (3.2a) and (3.2b), the central features of a travelling wave, being wavelength and speed, as well as spatial pattern can be captured by analysing a model where space is represented in a one-dimensional model instead of in two dimensions. Therefore, we focus on the results obtained in one-dimensional space in the previous sections. In this section, we analyse the numerical solution to the PDEs (3.2a) and (3.2b) in both one- and two-dimensional space. We have taken the approach of discretizing the PDEs in space, applying upwinding to the convective term and Euler integration of the finite-difference equations. We used a rectangular spatial grid consisting of 200×200 cells (50×50 m), with a unidirectional water flow in the y-axis direction. We assume the simulated domain to be a section of a large mussel bed. For this reason, we adopted periodic boundary condition (in y-axis direction). To start off, we filled a grid of points with algal and mussel levels corresponding the homogeneous equilibrium, for a certain level of δ (here 0.14). Next, we perturbed this uniform solution by increasing or decreasing the mussel at some point in a random way. From those initial values, we let equation (3.2a) and (3.2b) evolve with time, where mussel and algal growth at each grid point slowly evolved towards a fixed pattern. Mussel patterns emerged, depending on the level of δ and β (figure 10), where the (i) a–c shows the two-dimensional mussel patterns and (ii) a–c shows space-temporal pattern, respectively. As we predicted in §4, our numerical results confirm these predictions by linear analysis that the mussel striped pattern occurs when the parameter is within the shaded domain (figure 10 a). However, the spatial pattern also can survive when δ<γ, confirming our nonlinear analysis in §3 (figure 9).
Note that from these simulations, we find that long-term solutions presented in figure 10 are travelling waves. In figure 10 a, we observe the emergence of both parallel crossed patterns, which indicate that patterns of different speed are coexisting in system (3.2a) and (3.2b). Figure 11 shows a typical spatial pattern after 50 days (approx. 7500 units in the dimensionless system (3.2a) and (3.2b)) in mussel density on the sediment for equations (2.1a) and (2.1b). There are periodic patterns of peaks in mussel density m, separated by regions in which mussel is almost absent. One can see from figures 10 a and 11 a that multiple patterns with different wavelengths, speed and amplitudes coexist for the intermediate algal concentration. In contrast to the lower algal concentration, only a single spatial pattern appears in the space (figures 10 c and 11 c).
6. Field observation of spatial patterns in mussel beds
Our previous analysis predicts that spatial patterns with different wavelengths may coexist in mussel beds. Here, we study aerial photographs of patterned mussel beds in the Wadden Sea using digitized images to estimate spatial wavelengths. We subsampled a single digital image to show that different spatial wavelengths can occur within a single mussel bed (figure 12). We tested for regular spacing in extracted panels A, B and C in figure 12 a by applying two-dimensional spectral analysis. Spectral analysis provides a measure of the amount of variance within the image, referred to as I l,d, that is explained by a simple cosine with a specific wavelength l and direction d. To investigate the dependence of I on wavelength, we plotted the radial spectrum of I, which reveals the dominant wavelength that fits within the analysed image, irrespective of direction. Detailed treatments of the method can be found in articles by Renshaw & Ford (1983, 1984), David (1988), Mugglestone & Renshaw (1998), Couteron & Lejeune (2001) and van de Koppel & Crain (2006).
The spectral analysis reveals that different wavelengths can be observed within a single mussel bed. Specific wavelengths are found to be 5.3, 9.2 and 17.6 m for A, B and C, respectively. Note that although both intrinsic (i.e. depletion of algae) and external processes (high differences) can cause variation in conditions that could explain variation in wavelength, it is unlikely that on the scale of this mussel bed (approx. 200 m across), abiotic conditions such as flow rates vary considerably. Hence, our spectral analysis provides evidence for the co-occurrence of wave patterns with different wavelengths within a single bed. Note that there also exist some wide ranges of different wavelengths within each panel.
7. Discussion
Regular pattern formation is an intriguing natural phenomenon found in a broad range of ecosystems, such as mussel beds, arid ecosystems, wetland ecosystems, savannahs, coral reefs, ribbon forests, intertidal mudflats and marsh tussocks (see Rietkerk & van de Koppel (2008) for a review). Recent studies point at an important use of spatial patterns as indicators for eminent catastrophic shifts in response to changing conditions, such as climate change (Rietkerk et al. 2004; Kéfi et al. 2007; Solé 2007). However, a systematic mathematical analysis of pattern characteristics is lacking for most ecosystems with regular patterns. We provide a mathematical analysis of the formation of spatial, stripe-like regular patterns in mussel beds occurring on soft sediment (Gascoigne et al. 2005; van de Koppel et al. 2005), and assess their potential use as indicators for the resilience of mussel beds. Using the model proposed by van de Koppel et al. (2005), we present the first systematic analysis of the dependence of these striped patterns on key ecological parameters. Our results show that at low mortality or high algal input rates where the resilience of mussel beds is high, many wavelengths can potentially be found. At high mortality or low algal input rates, only high wavelengths are predicted. In this region, disturbances can induce a collapse of the mussel bed, as the boundary equilibrium (a *, 0) is stable and single wavelength dominance indicates proximity of a collapse threshold. Furthermore, our results show that for a spatial pattern of a particular wavelength, the amplitude of spatial oscillation is an increasing function of algal concentration. These results point at the potential use of pattern characteristics for assessing the resilience of mussel beds to disturbances, for instance winter storms.
Our combined results suggest that a multitude of wavelengths can coexist for a wide range of algal concentrations. These predictions are in agreement with the results of spectral analysis of aerial photographs obtained from the Wadden Sea. Although we cannot exclude the possibility that underlying gradients in abiotic conditions, such as flow rates, cause the observed variation in wavelength, hydrodynamic conditions within mussel beds are unlikely to vary considerably within the scale of the studied mussel bed and hence wavelength coexistence is a potential explanation. Our mathematical analysis points at the potential usefulness of combined measurement of variation in stripe wavelength, amplitude, at potentially stripe movement speed in assessing the resilience of mussel beds. Moreover, it indicates that integration of numerical hydrodynamic models with ecological benthic–pelagic exchange models provides a feasible approach to the development of an indicator system for assessing the resilience and vulnerability of mussel bed ecosystems.
The idea put forward by Turing that diffusive instability can lead to the formation of patterns is a simple but profound one. His work puts forward that if, in the absence of diffusion, a linearly stable homogeneous steady-state exists, spatially inhomogeneous patterns can evolve through a spatial symmetry-breaking instability. This instability is caused by differential diffusion rates of the system's components, and is therefore called diffusion driven instability. We analyse an alternative mechanism that causes a similar instability, arising from DIFI. While diffusion driven instability solely generates stationary spatial patterns, DIFI can generate both stationary and travelling patterns. Linear analysis predicts that spatial patterns may form only within the bifurcation curve, where patterns will be of low amplitude around the equilibrium. However, exponentially growing modes become bounded by nonlinear terms and a spatially inhomogeneous steady-state emerges. In this case, it is well known that linear analysis fails to predict the potential for large amplitude and strongly nonlinear patterns, as it does not take into account the nonlinear interaction among the variables (Satnoianu et al. 1998, 2001; Mei 2000). However, for large amplitude patterns, nonlinear effects will be important and may alter the parameter dependencies (see our nonlinear continuum based on package Auto in §4). In addition, these properties extend to other ecosystems that follow the same differential-flow structure, such as Klausmeier's (1999) model by Sherratt (2005) and Sherratt & Lord (2007).
There is a pressing need for suitable and accessible indicators for degradation in systems under anthropogenic stress (Solé 2007). From the pattern characteristics that we have analysed in this paper, wavelength is the most accessible indicator. Wavelength can be determined from aerial observation at a single instance using spectral or wavelet analysis, although georeferencing and hence inclusion of reference points is required for an accurate determination of wavelength. Determination of wave speed is more difficult to assess, as it requires time series of georeferenced aerial images. Amplitude can only be derived from biomass measurements, thus requiring a ground-based study. When combined with mathematical analysis of the bifurcation structure of the mussel bed system, empirical determination of wavelength, wave speed and amplitude provides a potential indication of the state, resilience and vulnerability of mussel bed ecosystems.
Acknowledgments
We thank Norbert Dankers and Kees Kersting for providing and permitting us to use the satellite images. This work is supported by the National Natural Science Foundation of China under grant no. 60771026, the Program for New Century Excellent Talents in University (NCET050271), the Special Scientific Research Foundation for the Subjects of Doctors in University no. 20060110005 and the Natural Science Foundation of Shan'xi Province grant no. 2006011009.
Appendix A
Below, we analyse the conditions for the development of spatial, DIFI patterns, which develop as a consequence of DIFI of the uniform solution of system (3.2a) and (3.2b). First, we address the temporal stability of the uniform state to non-uniform perturbations (Cross & Hohenberg 1993)
 |
A1 |
where (a *, m *) is either (1, 0) or (a s, m s); λ is the perturbation growth rate; k is the wavenumber; imaginary unit i2=−1; and c.c. stands for complex conjugate. The linear instability (ϵ≪1) of each of the uniform states is deduced from the dispersion relations. After substituting expression (A 1) into equation (3.2a) and (3.2b) and neglecting all nonlinear terms in a and m, one finds the characteristic equation for the growth rate λ as the determinant det(J), where
 |
A2 |
b
11=−α−m
*, b
12=−a
*, b
21=δm
* and  . For the non-trivial steady state (3.3), the coefficients b
11, b
12, b
21 and b
22 have entries given by
 |
A3 |
Furthermore, it is easy to see that b 11, b 12 are negative, and b 21, b 22 are manifestly positive. When we consider pattern formation about the non-trivial solutions, the characteristic equation (A 2) can be written as
| A4 |
with trace Tr=b 11+b 22, determinant Δ=b 11 b 22−b 12 b 21, which gives the dispersion relation
 |
A5 |
where Φ=(k 2+b 11−b 22)2−β 2 k 2+4b 12 b 21 and Θ=−2βk(k 2+b 11−b 22).
Appendix B
In this appendix, we demonstrate there is no Turing instability range in system (3.2a) and (3.2b). A general linear analysis (Cross & Hohenberg 1993; Murray 1993) shows that the necessary conditions for yielding Turing patterns are given by
| B1 |
| B2 |
| B3 |
 |
B4 |
where D a and D m denote the diffusive coefficient of algae and mussel, respectively. Since D a=0, D m>0 and b 11<0, condition (B 3) is not satisfied in system (3.2a) and (3.2b).
Appendix C
For the trivial state (1, 0), we obtain
| C1 |
Hence, we only need to consider the case δ<γ due to the fact that the homogeneous state should be stable. By equation (3.4), the dispersion relations are given by
 |
C2 |
Φ=(α+δ−γ−k 2)2−β 2 k 2, Θ=−2βk(k 2−α−δ+γ), again with j=±1. By direct calculation, we obtain that
| C3 |
It is easy to have that Re λ=−α or Re λ=−k 2+(δ−γ)<0.
References
- Ai S, Huang W.2005Travelling waves for a reaction–diffusion system in population dynamics and epidemiology. Proc. R. Soc. Edinb. Sect. A. 135, 663–675. 10.1017/S0308210500004054. [DOI] [Google Scholar]
- Brinkman A, Dankers N, van Stralen M.2002An analysis of mussel bed habitats in the Dutch Wadden Sea. Helgoland Mar. Res. 56, 59–75. 10.1007/s10152-001-0093-8. [DOI] [Google Scholar]
- Burke J, Knobloch E.2006Localized states in the generalized Swift–Hohenberg equation. Phys. Rev. E. 73, 056 211. 10.1103/PhysRevE.73.056211. [DOI] [PubMed] [Google Scholar]
- Cadee G.C, Hegeman J.2002Phytoplankton in the Marsdiep at the end of the 20th century: 30 years monitoring biomass, primary production, and Phaeocystis blooms. J. Sea Res. 48, 97–110. 10.1016/S1385-1101(02)00161-2. [DOI] [Google Scholar]
- Champneys A.R.1998Homoclinic orbits in reversible systems and their applications in mechanics, fluids and optics. Physica D. 112, 158–186. 10.1016/S0167-2789(97)00209-1. [DOI] [Google Scholar]
- Cote I.M, Isabelle M.1999Predator-induced clumping behaviour in mussels (Mytilus edulis Linnaeus). J. Exp. Mar. Biol. Ecol. 235, 201–211. 10.1016/S0022-0981(98)00155-5. [DOI] [Google Scholar]
- Couteron P, Lejeune O.2001Periodic spotted patterns in semi-arid vegetation explained by a propagation-inhibition model. J. Ecol. 89, 616–628. 10.1046/j.0022-0477.2001.00588.x. [DOI] [Google Scholar]
- Cross M.C, Hohenberg P.C.1993Pattern formation outside of equilibrium. Rev. Mod. Phys. 65, 851. 10.1103/RevModPhys.65.851. [DOI] [Google Scholar]
- David J.M.1988Using geostatistics and spectral analysis to study spatial patterns in the topography of southeastern Washington state, U.S.A. Earth Surf. Proc. Land. 13, 389–405. 10.1002/esp.3290130505. [DOI] [Google Scholar]
- Dobretsov S, Wahl M.2008Larval recruitment of the blue mussel Mytilus edulis: the effect of flow and algae. J. Exp. Mar. Biol. Ecol. 355, 137–144. 10.1016/j.jembe.2007.12.018. [DOI] [Google Scholar]
- Doedel E. J., Paffenroth R. C., Champneys A., Fairgrieve T. F., Kuznetsov Y. A., Oldman B. E., Sandstede B., Wang X. 2001. AUTO 2000: continuation and bifurcation software for ordinary differential equations (with HomCont). Technical report, Concordia University (http://indy.cs.concordia.ca/auto/). [Google Scholar]
- Gascoigne J.C, Beadman H.A, Saurel C, Kaiser M.J.2005Density dependence, spatial scale and patterning in sessile biota. Oecologia. 145, 371–381. 10.1007/s00442-005-0137-x. [DOI] [PubMed] [Google Scholar]
- Gomila D, Scroggie A.J, Firth W.J.2007Bifurcation structure of dissipative solitons. Physica D. 227, 70–77. 10.1016/j.physd.2006.12.008. [DOI] [Google Scholar]
- Gurney W.S.C, Veitch A.R, Cruickshank I, McGeachin G.1998Circles and spirals: population persistence in a spatially explicit predator–prey model. Ecology. 79, 2516–2530. 10.2307/176840. [DOI] [Google Scholar]
- Hassell M.P, Comins H.N, May R.M.1991Spatial structure and chaos in insect population-dynamics. Nature. 353, 255–258. 10.1038/353255a0. [DOI] [Google Scholar]
- Hoyle R.Pattern formation: an introduction to methods.2006Cambridge, UK:Cambridge University Press [Google Scholar]
- Jorne J.1974The effects of ionic migration on oscillations and pattern formation in chemical systems. J. Theor. Biol. 43, 375–380. 10.1016/S0022-5193(74)80067-6. [DOI] [PubMed] [Google Scholar]
- Kaern M, Menzinger M, Satnoianu R, Hunding A.2002Chemical waves in open flows of active media: their relevance to axial segmentation in biology. Faraday Discuss. 120, 295–312. 10.1039/b103244p. [DOI] [PubMed] [Google Scholar]
- Kéfi S, Rietkerk M, Alados C.L, Pueyo Y, Papanastasis V.P, ElAich A, de Ruiter P.C.2007Spatial vegetation patterns and imminent desertification in Mediterranean arid ecosystems. Nature. 449, 213–217. 10.1038/nature06111. [DOI] [PubMed] [Google Scholar]
- King P.A, Mcgrath D, Britton W.1990The use of artificial substrates in monitoring mussel (Mytilus edulis L.) settlement on an exposed rocky shore in the west of Ireland. J. Mar. Biol. Assoc. UK. 70, 371–380. [Google Scholar]
- Klausmeier C.A.1999Regular and irregular patterns in semiarid vegetation. Science. 284, 1826–1828. 10.1126/science.284.5421.1826. [DOI] [PubMed] [Google Scholar]
- Knobloch E.2008Spatially localized structures in dissipative systems: open problems. Nonlinearity. 21, T45–T60. 10.1088/0951-7715/21/4/T02. [DOI] [Google Scholar]
- Kuznetsov Y.A.Elements of applied bifurcation theory.3rd edn.2004New York, NY:Springer [Google Scholar]
- Liu Q.-X, Jin Z, Li B.-L.2008Numerical investigation of spatial pattern in a vegetation model with feedback function. J. Theor. Biol. 254, 350–360. 10.1016/j.jtbi.2008.05.017. [DOI] [PubMed] [Google Scholar]
- Maini P.K, Painter K.J, Chau H.N.P.1997Spatial pattern formation in chemical and biological media. J. Chem. Soc. Faraday Trans. 93, 3601–3610. 10.1039/a702602a. [DOI] [Google Scholar]
- Mei Z.Numerical bifurcation analysis for reaction–diffusion equations.2000Berlin, Germany:Springer [Google Scholar]
- Míguez D.G, Satnoianu R.A, Munuzuri A.P.2006Experimental steady pattern formation in reaction–diffusion–advection systems. Phys. Rev. E. 73, 025 201. 10.1103/PhysRevE.73.025201. [DOI] [PubMed] [Google Scholar]
- Mugglestone M.A, Renshaw E.1998Detection of geological lineations on aerial photographs using two-dimensional spectral analysis. Comput. Geosci. 24, 771–784. 10.1016/S0098-3004(98)00065-X. [DOI] [Google Scholar]
- Murray J.D.Mathematical biology.. In Biomathematics 2nd edn.vol. 191993Berlin, Germany; New York, NY:Springer [Google Scholar]
- Muschenheim D.K, Newell C.R.1992Utilization of seston flux over a mussel bed. Mar. Ecol. Prog. Ser. 85, 131–136. 10.3354/meps085131. [DOI] [Google Scholar]
- Palmeirim I, Henrique D, Ish-Horowicz D, Pourquie O.1997Avian hairy gene expression identifies a molecular clock linked to vertebrate segmentation and somitogenesis. Cell. 91, 639–648. 10.1016/S0092-8674(00)80451-1. [DOI] [PubMed] [Google Scholar]
- Perumpanani A.J, Sherratt J.A, Maini P.K.1995Phase differences in reaction–diffusion–advection systems and applications to morphogenesis. IMA J. Appl. Math. 55, 19–33. 10.1093/imamat/55.1.19. [DOI] [Google Scholar]
- Renshaw E, Ford E.D.1983The interpretation of process from pattern using two-dimensional spectral analysis: methods and problems of interpretation. Appl. Stat. 32, 51–63. 10.2307/2348042. [DOI] [Google Scholar]
- Renshaw E, Ford E.D.1984The description of spatial pattern using two-dimensional spectral analysis. Vegetatio. 56, 75–85. [Google Scholar]
- Rietkerk M, van de Koppel J.2008Regular pattern formation in real ecosystems. Trends Ecol. Evol. 23, 169–175. 10.1016/j.tree.2007.10.013. [DOI] [PubMed] [Google Scholar]
- Rietkerk M, Dekker S.C, de Ruiter P.C, van de Koppel J.2004Self-organized patchiness and catastrophic shifts in ecosystems. Science. 305, 1926–1929. 10.1126/science.1101867. [DOI] [PubMed] [Google Scholar]
- Riisgard H.U.2001On measurement of filtration rates in bivalves—the stony road to reliable data: review and interpretation. Mar. Ecol. Prog. Ser. 211, 275–291. 10.3354/meps211275. [DOI] [Google Scholar]
- Rovinsky A.B, Menzinger M.1992Chemical instability induced by a differential flow. Phys. Rev. Lett. 69, 1193–1196. 10.1103/PhysRevLett.69.1193. [DOI] [PubMed] [Google Scholar]
- Rovinsky A.B, Adiwidjaja H, Yakhnin V.Z, Menzinger M.1997Patchiness and enhancement of productivity in plankton ecosystems due to the differential advection of predator and prey. Oikos. 78, 101–106. 10.2307/3545805. [DOI] [Google Scholar]
- Sandstede B.Stability of travelling waves. In Handbook of dynamical systems II 2002. pp. 983–1055. Amsterdam, The Netherlands: North-Holland [Google Scholar]
- Sandstede B, Scheel A.Essential instability of pulses and bifurcations to modulated travelling waves. Proc. R. Soc. Edinb. A. 1999. 129, 1263–1290. [Google Scholar]
- Sandstede B, Scheel A.2000Spectral stability of modulated travelling waves bifurcating near essential instabilities. Proc. R. Soc. Edinb. A. 130, 419–448. 10.1017/S0308210500000238. [DOI] [Google Scholar]
- Satnoianu R.A.2003Coexistence of stationary and traveling waves in reaction–diffusion–advection systems. Phys. Rev. E. 68, 032 101. 10.1103/PhysRevE.68.032101. [DOI] [PubMed] [Google Scholar]
- Satnoianu R.A, Menzinger M.2000Non-Turing stationary patterns in flow-distributed oscillators with general diffusion and flow rates. Phys. Rev. E. 62, 113–119. 10.1103/PhysRevE.62.113. [DOI] [PubMed] [Google Scholar]
- Satnoianu R.A, Merkin J.H, Scott S.K.1998Spatio-temporal structures in a differential flow reactor with cubic autocatalator kinetics. Physica D. 124, 345–367. 10.1016/S0167-2789(98)00206-1. [DOI] [Google Scholar]
- Satnoianu R.A, Maini P.K, Menzinger M.2001Parameter space analysis, pattern sensitivity and model comparison for Turing and stationary flow-distributed waves (FDS). Physica D. 160, 79–102. 10.1016/S0167-2789(01)00345-1. [DOI] [Google Scholar]
- Scholten H, Smaal A.C.1998Responses of Mytilus edulis L. to varying food concentrations: testing EMMY, an ecophysiological model. J. Exp. Mar. Biol. Ecol. 219, 217–239. 10.1016/S0022-0981(97)00182-2. [DOI] [Google Scholar]
- Sherratt J.A.2005An analysis of vegetation stripes formation in semi-arid landscapes. J. Math. Biol. 51, 183–197. 10.1007/s00285-005-0319-5. [DOI] [PubMed] [Google Scholar]
- Sherratt J.A, Lord G.J.2007Nonlinear dynamics and pattern bifurcations in a model for vegetation stripes in semi-arid environments. Theor. Popul. Biol. 71, 1–11. 10.1016/j.tpb.2006.07.009. [DOI] [PubMed] [Google Scholar]
- Solé R.2007Scaling laws in the drier. Nature. 449, 151–153. 10.1038/449151a. [DOI] [PubMed] [Google Scholar]
- Sukhotin A.A, Abele D, Portner H.-O.2002Growth, metabolism and lipid peroxidation in Mytilus edulis: age and size effects. Mar. Ecol. Prog. Ser. 226, 223–234. 10.3354/meps226223. [DOI] [Google Scholar]
- Turing A.M.1952The chemical basis of morphogenesis. Phil. Trans. R. Soc. B. 237, 37–72. 10.1098/rstb.1952.0012. [DOI] [Google Scholar]
- van de Koppel J, Crain C.M.2006Scale-dependent inhibition drives regular tussock spacing in a freshwater marsh. Am. Nat. 168, E136–E147. 10.1086/508671. [DOI] [PubMed] [Google Scholar]
- van de Koppel J, Rietkerk M, Dankers N, Herman P.M.J.2005Scale-dependent feedback and regular spatial patterns in young mussel beds. Am. Nat. 165, E66–E77. 10.1086/428362. [DOI] [PubMed] [Google Scholar]
- Wildish D.J, Kristmanson D.D.1984Importance to mussels of the benthic boundary layer. Can. J. Fish. Aquat. Sci. 41, 1618–1625. 10.1139/f84-200. [DOI] [Google Scholar]
- Yochelis A, Burke J, Knobloch E.2006Reciprocal oscillations and nonmonotonic fronts in forced nonequilibrium systems. Phys. Rev. Lett. 97, 254 501. 10.1103/PhysRevLett.97.254501. [DOI] [PubMed] [Google Scholar]
- Yochelis A, Tintut Y, Demer L.L, Garfinkel A.2008The formation of labyrinths, spots and stripe patterns in a biochemical approach to cardiovascular calcification. New J. Phys. 10, 055 002. 10.1088/1367-2630/10/5/055002. [DOI] [Google Scholar]


