Abstract
The micromechanical properties of spider air flow hair sensilla (trichobothria) were characterized with nanometre resolution using surface force spectroscopy (SFS) under conditions of different constant deflection angular velocities  (rad s−1) for hairs 900–950 μm long prior to shortening for measurement purposes. In the range of angular velocities examined (4×10⁻⁴−2.6×10⁻¹ rad s−1), the torque T (Nm) resisting hair motion and its time rate of change
  (Nm s−1) were found to vary with deflection velocity according to power functions. In this range of angular velocities, the motion of the hair is most accurately captured by a three-parameter solid model, which numerically describes the properties of the hair suspension. A fit of the three-parameter model (3p) to the experimental data yielded the two torsional restoring parameters, S
3p=2.91×10⁻¹¹ Nm rad−1 and
  =2.77×10⁻¹¹ Nm rad−1 and the damping parameter R
3p=1.46×10⁻¹² Nm s rad−1. For angular velocities larger than 0.05 rad s−1, which are common under natural conditions, a more accurate angular momentum equation was found to be given by a two-parameter Kelvin solid model. For this case, the multiple regression fit yielded S
2p=4.89×10⁻¹¹ Nm rad−1 and R
2p=2.83×10⁻¹⁴ Nm s rad−1 for the model parameters. While the two-parameter model has been used extensively in earlier work primarily at high hair angular velocities, to correctly capture the motion of the hair at both low and high angular velocities it is necessary to employ the three-parameter model. It is suggested that the viscoelastic mechanical properties of the hair suspension work to promote the phasic response behaviour of the sensilla.
Keywords: trichobothria, spider, arthropod medium flow sensilla, atomic force microscope, force spectroscopy
1. Introduction
Trichobothria are wind-sensing hair-like sensilla on the legs and pedipalps of spiders capable of absorbing the energy of air flowing around them with outstanding efficiency (for reviews see Barth 2000; Barth 2002; Humphrey & Barth 2008). They serve the spider to detect and localize prey and predators. The measurements reported to date on spider trichobothria have been used in physical–mathematical models describing mechanical hair behaviour for oscillating air flows in the biologically relevant frequency range between 10 and 950 Hz. In earlier studies, the frequency dependence of hair deflection was explained considering factors, such as the relationship of hair morphology with boundary-layer thickness and inertial effects. Both the hair suspension torsional restoring constant S and the damping constant R were calculated to be extremely small, being S=5.77×10⁻¹² Nm rad−1, and R=2.20×10⁻¹⁵ Nm s rad−1 for a 750 μm long hair, and S=0.62×10⁻¹² Nm rad−1 and R=0.27×10⁻¹⁵ Nm s rad−1 for a 250 μm long hair (Barth et al. 1993).
To date, trichobothria have been modelled using the data acquired by conventional optical microscopy, scanning electron microscopy and laser Doppler anemometry (Barth et al. 1993; Bathellier et al. 2005). The mechanical hair behaviour was modelled using fluid mechanics to predict the amount of mechanical energy transferred from the air flow to the hair (Barth et al. 1993; Humphrey et al. 1993, 1998, 2001, 2003; Devarakonda et al. 1996; Humphrey & Barth 2008). These considerations quantitatively described the air–hair phase relationship, which allows the torsional restoring force of the hair suspension to be calculated under various assumptions related to the air–hair interactions. From the minimum deflection (measured with the optical microscope) that elicits an action potential combined with the estimates of the torsional restoring constant S, the minimum mechanical energy that effectively elicits a nervous response was estimated to be between 1.5×10⁻¹⁹ and 2.5×10⁻²⁰ J (Humphrey et al. 2003). These are extremely small values indicating that trichobothria are among the most sensitive biological receptors.
In the present study, the mechanical properties of the trichobothrium suspension and of the hair shaft proper are measured directly. Mechanical stimuli were applied in different spatial and temporal regimes for both the small nanoscale deflections and the larger microscale deflections, and for a wide range of angular deflection velocities ranging from 0.0004 to 0.26 rad s−1 at triangular wave frequencies ranging from 0.07 to 102 Hz (calculated as the reciprocal value of the duration of the triangular displacement). Moreover, this study is conducted with particularly high experimental precision (fraction of nanometre) by using surface force spectroscopy (SFS) and the application of directly calibrated forces in the range of nano-Newtons. SFS provides a force spectrum with pico-Newton precision, nano-Newton applied forces and nanoscale deflections (Tsukruk et al. 2000). SFS has already been proven to be an invaluable tool for studying biological receptors and the structures associated with them (Fuchigami et al. 2001; Gorbunov et al. 2002; McConney et al. 2007; Peleshanko et al. 2007). Here, we report on a methodology that combines representing the suspension of a trichobothrium as a linear viscoelastic material with direct measurements to determine the values of the three-parameter and two-parameter viscoelastic models explored. These are the torsional restoring constants, S
3p and 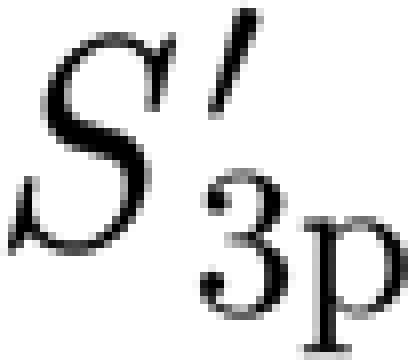 , and the damping constant R
3p, and the torsional restoring constant S
2p and the damping constant R2p, inherent to the trichobothrium suspension represented by the spring and the dashpot elements of the models. The angles and velocities of the trichobothrium deflections measured are within the range relevant for the spider to distinguish air flow stimuli originating from prey, mates and predators from its noisy environment.
2. Materials and methods
2.1. Sample preparation
Live adult female Cupiennius salei (Ctenidae; figure 1 a) spiders from the Vienna laboratory stock were anaesthetized with a CO2/air mixture for 5 min and then attached to a Perspex substrate using adhesive tape (3M Micropore), such that the metatarsus and tarsus of one of their first legs protruded beyond the substrate. Trichobothria on the tarsus of the first walking leg were identified optically (TaD group; for details of trichobothria topography see Barth et al. 1993) and other hairs in their vicinity removed (figure 1 b). Particularly, two to four of the most distal trichobothria in the most frontal row on the tarsus were prepared in this way. For technical reasons the tarsus was secured on a metal sample mounting disc, so that the long axes of the trichobothria were oriented horizontally. To avoid mechanical interference with the atomic force microscope's (AFM) cantilever and to minimize air drag forces, the trichobothria were cut to lengths of approximately 100 μm and less using microscissors. The lengths of the trichobothria were measured using an optical microscope (Leica DM4000M) before and after the cutting procedure. A piece of silicon wafer cleaned with ‘piranha solution’ (1 : 2 hydrogen peroxide : sulphuric acid) was mounted beside the spider's tarsus on the metal disc. This was done to calibrate the sensitivity of the photodetector that measures the cantilever deflection used in SFS experiments. This is explained in detail in §2.2. Following the SFS measurements, the tarsus together with the trichobothrium tested was examined in a scanning electron microscope (JEOL JSM-6060V) for changes in the hair's surface structure owing to the interaction with the AFM cantilever probe.
Figure 1.
The spider and its trichobothria. (a) An adult female Cupiennius salei. The yellow arrows point to the leg segments carrying trichobothria. The red arrows point to the tarsi of the first walking legs whose trichobothria were examined in this study. (b) Three trichobothria in a row on the dorsal side of the first walking leg tarsus.
2.2. SFS: hair deflection measurements
All AFM and SFS measurements were performed using a Multimode, Nanoscope IIIa microscope with a Picoforce module and a Dimension 3000, Nanoscope IIIa microscope in accordance with well-established procedures (Cappella & Dietler 1999; LeMieux et al. 2003, Kovalev et al. 2004).
The AFM was warmed up by actuating the piezo elements for at least 30 min before the measurements began in order to prevent piezo thermal drift. The quadrant photodiode, which measured the deflection of the AFM cantilever, was calibrated by relating the distance of the cantilever tip deflection and the change in position of the laser light shone on the photodiode. To calibrate the sensitivity of the photodiode, force curves were determined on a clean piece of silicon. A simple equation was used, P+D=PM, which relates the sum of the cantilever tip penetration into the substrate P and its deflection D to the movement of the piezo element PM. The freshly cleaned silicon was considered as an infinitely hard surface. Thus, the cantilever tip penetrated into the silicon by a negligible amount (P=0), and the piezo movement equalled the deflection of the cantilever tip (PM=D). The voltage change in the photodiode was due to the same amount of deflection of the cantilever as the movement of the piezo element. Therefore, the photodiode was calibrated by setting the slope of the force–distance curve on silicon to 1. The photodiode was calibrated every time a new cantilever was used.
For the measurements, silicon cantilevers back-side coated with aluminium and with silicon nitride tips (nanometre-scale radius of cantilever tip end curvature) were used. Initially, microsphere-tipped probes seemed the most appropriate to prevent penetration into the hair surface, but owing to the large surface contact area adhesion of the hair to the microsphere persisted between two measurement cycles. The loss of contact between the two measurements provided a reference point when quantifying the total deflection of the hair during a measurement. The spring constants of the AFM cantilevers were calibrated using the standard ‘tip-on-tip’ method, as well as the thermal tuning method for softer cantilevers (Hutter & Bechhoefer 1993a , b ; Gibson et al. 1996; Hazel & Tsukruk 1998, 1999).
For all measurements, the trichobothria were loaded by deflecting them in a triangular way at a constant angular velocity, with a predetermined repeat frequency and perpendicular to the long axis of the hair shaft. The hair shaft was deflected towards the posterior aspect of the tarsus. In oscillating air, the mechanical directional characteristics of hair deflection are nearly isotropic for the hairs examined here, with only a slight preference for the anterior–posterior plane (large to medium-sized hairs; Barth et al. 1993).
The trichobothria and the AFM cantilever were positioned under optical control (fibre optics, magnification by objective lens (×50) with large working distance, observation on video monitor). The metal disc, with the sample and the silicon, was placed onto the magnetic sample holder so that the long axis of the hair and the cantilever were in parallel. The micropositioning stage of the AFM was used to position the cantilever with respect to the hair. Then, the tip position was fine adjusted to land in the centre of the hair. This was achieved by adjusting the offset of the horizontal plane piezo elements of the AFM to minimize the torsional deflection of the cantilever (monitored with the quadrant photodiode). The torsional motion was caused by a twisting motion of the cantilever when it contacted the hair not on its centre.
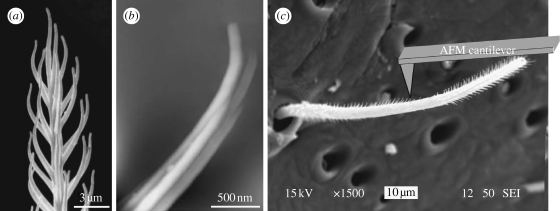
All hairs (of 910, 923, 950 μm length before cutting) were initially loaded using soft AFM cantilevers (spring constants between 0.018 and 0.045 N m−1) to limit the forces applied to several nano-Newtons and to keep deflections below 100 nm. However, after the initial engagement, the force–distance curves showed significant instabilities caused by interactions between the AFM cantilever tip and the microtrichs on the main hair shaft (figure 2 a,b). Repetition of the loading with the AFM cantilever tip at 1 Hz effectively micro-shaved the hair shaft owing to the cantilever's slight horizontal displacements relative to the hair shaft, making the selected surface areas smooth and acceptable for stable engagement of the AFM cantilever tip (figure 2 c). Because this horizontal displacement of the AFM cantilever (which can change the effective distance to the pivotal point and thus the resistance forces measured) was very small, it did not affect the calculations. Indeed, for hair deflection angles below 0.1° for high-resolution measurements, and below 12° for large deflection measurements, the corresponding correction factor was estimated to fall within 1–10 per cent. All critical experimental conditions are summarized in table 1. The cantilever force–distance curves were converted to hair loading curves (hair deflection versus normal load) by taking into account the preceding cantilever calibration. The contact point was defined in accordance with an adaptation of the well-established approach given in Tsukruk et al. (1998). Specifically, we used the minimum deflection point of the approach curve, where the cantilever ‘snaps into’ the surface of the hair.
Figure 2.
Hair shaft morphology. (a) SEM micrograph of the tip of a trichobothrium; note the hairs-on-hair morphology (microtrichs). (b) High-resolution AFM image of a single microtrich (z-range, 100 nm). Note that several striations make up a single microtrich. (c) SEM micrograph of a trichobothrium with partially removed microtrichs in the area close to the cantilever tip. Note the bald spot where the microtrichs were rubbed off by the cantilever tip (nanoshaving).
Table 1.
Experimental conditions for SFS measurements.
| testing variables | length, L a (μm) | AFM cantilever stiffness (N m−1) | ramp sizeb (nm) | velocity (μm s−1) | triggerc (nm) |
|---|---|---|---|---|---|
| small forces (<10 nN) | 20–50 | 0.018–0.045 | 3000–5000 | 0.05–41.9 | 10–150 |
| large forces (>500 nN) | 21–62 | 8.9 | 5000–20 000 | 5–20 | 60–none |
The position of the cantilever on the hair is essential for the calculation of the torque.
Ramp size is the maximum distance that the sample can travel vertically when a single force–distance curve is measured. Ramp sizes had to be very large to ensure that the cantilever loses contact with the hair between measurements.
The trigger defines the maximum deflection of the cantilever when recording a force–distance curve.
After performing the high-resolution SFS measurements within the limited range of deflections and forces, the soft AFM cantilever (spring constant less than or equal to 0.045 N m−1) was replaced with a stiffer cantilever that had a spring constant of 8.9 N m−1. The stiff cantilever allowed for loading forces exceeding 0.5 μN and led to hair deflections from 1 nm to 10 μm. The measurements done with large hair deflections and the shaft-bending measurements were performed with and without a deflection trigger point (which is the maximum cantilever deflection before the displacement of the piezo element changes direction) to achieve the widest possible ranges of deflections and bending, respectively (figure 3; table 1).
Figure 3.
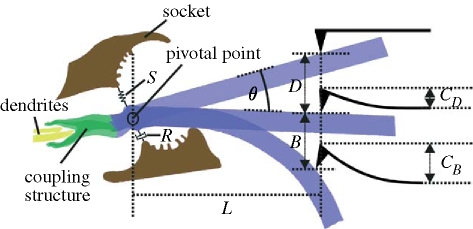
Hair parameters used for the calculations. The diagram defines the geometrical variables for the two regimes investigated: hair pivoting (deflection only) D and bending B, and the corresponding cantilever deflections C D and C B. L denotes the distance of the AFM cantilever tip from the pivotal point and θ, the deflection angle. The torsional restoring element S is represented by a spring, and the damping element R by a dashpot.
For the theoretical considerations in the following paragraph, it is important to state that each force measurement curve was obtained at a constant angular velocity ( ), and thus zero angular acceleration (
 ).
).
2.3. Theoretical basis for the determination of the viscoelastic model parameters
In this section, we obtain two equations for the angular momentum of a trichobothrium. One, based on a three-parameter solid model for the viscoelastic hair suspension, will be shown to apply over the entire range of angular velocities explored (4×10⁻⁴< <2.6×10⁻¹ rad s−1). The other, based on a two-parameter Kelvin solid model, will be shown to predict the motion of a hair with much better accuracy for angular velocities
  >0.05 rad s−1, which is in the most biologically relevant range. For ease of presentation, we describe the two-parameter model first.
2.3.1. Two-parameter Kelvin solid model
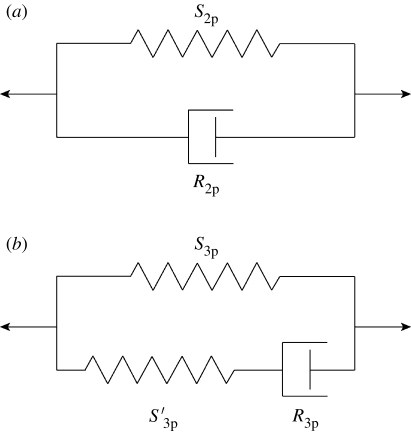
In this approach, the suspension supporting the hair is approximated as a two-parameter Kelvin solid model consisting of a spring and a dashpot element connected in parallel (figure 4 a). The hair is assumed to behave as a simple forced damped harmonic oscillator for which the conservation of angular momentum is given by
 |
2.1 |
where I (Nm s2 rad−1) is the hair's moment of inertia; R
2p (Nm s rad−1) is the hair's damping constant; S
2p (Nm rad−1) is the hair's torsional restoring constant; T (Nm) is the torque applied to the hair; and θ (rad),  (rad s−1) and
  (rad s−2) are the hair's deflection angle, angular velocity and angular acceleration, respectively. The subscript notation ‘2p’ denotes ‘two-parameter’ model. Using this model, we show in appendix A that the torque terms associated with air friction and air added mass are negligible relative to the torque T
SFS imposed by the mechanical probe. The smallness of these effects is further confirmed by the fact that the loading curves showed no nonlinearities that could be due to these two medium-related forces.
Figure 4.
‘Spring’ and ‘dashpot’ representations of (a) the two-parameter (2p) and (b) the three-parameter (3p) viscoelastic models representing the trichobothrium suspension material. In (a) the spring constant S
2p and the dashpot constant R
2p refer to the two-parameter model constants. In (b) the two spring constants S
3p and 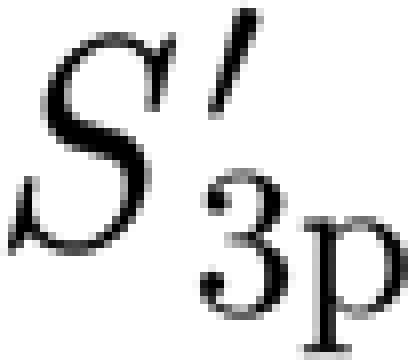 , and the dashpot constant R
3p refer to the three-parameter model constants.
Each experiment was conducted at a predetermined constant angular velocity  , and as a consequence, equation (2.1) simplifies to
 |
2.2 |
Using the experimentally determined data for  and T
SFS at a fixed angle θ, a multiple linear regression was performed using equation (2.2) to determine the model parameters.
2.3.2. Three-parameter solid model
The inability of the two-parameter model to correctly capture the variation of the hair's torque over the full range of angular velocities prompted us to explore a three-parameter solid model consisting of a spring element in parallel with a spring and a dashpot element in series (figure 4 b). This type of linear viscoelastic model is documented in Flügge (1967), Fung (1993) and Fuchigami et al. (2001) for example, and the corresponding angular momentum equation for a trichobothrium is given by
 |
2.3 |
In this case, the model parameters are the damping constant R
3p (Nm s rad−1) and two torsional restoring constants, S
3p (Nm rad−1) and  (Nm rad−1). Here, the subscript notation ‘3p’ stands for ‘three-parameter’, and was chosen to distinguish from the 2p of the two-parameter model. The quantity
  is the time rate of change of the torque. This is estimated from the relation
  , where
  and θ
tot are, respectively, the angular velocity and the total angular deflection of a hair during a measurement; T
tot(=T
SFS) being the corresponding experimentally determined torque for these conditions. As mentioned above, for the conditions of this study,
  is fixed to different but constant values and equation (2.3) simplifies to
 |
2.4 |
Again, as in the two-parameter model, a multiple linear regression analysis was performed on the experimental data using equation (2.4) to determine the model parameters.
2.4. Testing methodology: nanoshaving
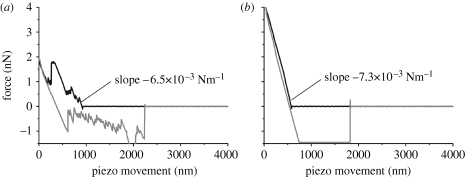
All SFS measurements were done with live animals. The micro-hairy surface (microtrichs) on the shaft of the trichobothrium added a significant challenge (figure 2). As mentioned above, the hairs-on-hair morphology initially prevented the acquisition of stable force–distance curves appropriate for further analysis. After taking many force–distance curves, their quality improved significantly as a result of nanoshaving. The linear region of the extension curves after engagement of the cantilever tip had identical slopes before and after this routine indicating that the fundamental hair resistance did not change (figure 5 a,b).
Figure 5.
Hair shaving. (a) A force–distance curve obtained before the hair was shaved. (b) A force–distance curve obtained after removal of the microtrichs. The velocity of the piezo movement was 5.58 μm s−1. Note the significant improvement in the data quality compared to that in (a). The approach curves (black) in (a,b) should be read from right to left, and the retraction curves (grey) from left to right.
For the experimental conditions of most of the SFS measurements on shaved hairs, we recorded very steady hair deflection, completely controlled by linear displacement of the piezoelectric crystal with random deviations smaller than 0.2 nm. No detectable thermal vibrations were recorded in the range of forces and distances examined, indicating significant viscous damping of the thermal vibrations and any other random deflections associated with environmental noise present in the laboratory. Moreover, no indications of large-scale displacements, associated with macroscopic movements, were recorded, indicating firm immobilization of the leg of the live spider.
2.5. Testing methodology: location of the axis of rotation
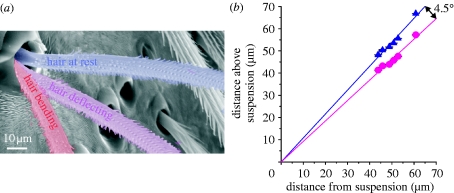
In order to measure the torque to deflect the trichobothrium, the distance L, from its pivoting axis O, to the region where the AFM cantilever tip contacted the hair shaft was required (figure 3). Precise values were obtained by making force–distance measurements at varying points along the hair shaft. From the zero position, the hair was deflected until its shaft contacted the socket at the limiting angle θ, and finally was bent slightly (figures 3 and 6 a). The angle between the hair in its zero position and when touching the socket was used to identify the axis of rotation O. When the cantilever tip was moved towards or away from the hair suspension, the triangle described by the motion of the pivoting lever arm of length L changed area, but not angles. By changing the distance of the measurement location from the pivoting axis, the two lines representing the surface of the hair shaft at rest and at fully deflected states, respectively, were mapped out (figure 6 b). The intersection of the two lines represents the location of the pivoting axis. The error regarding the distance from the AFM cantilever tip to the hair pivoting axis was estimated by taking the error of optical microscopy to be less than ±1 μm for most of the SFS measurements conducted here.
Figure 6.
(a) SEM micrograph depicting the three regimes that characterize the large-scale load curves shown in figure 7 a. (b) Positions of the trichobothrium in its zero (resting) position (triangles) and positions of first contact of the hair shaft with the socket rim (circles) with lines fit to the data. The origin of the curve represents the position of the hair suspension (N=1, n=30) (N, number of trichobothria; n, number of measurements).
Once the location of the pivoting axis was obtained, calculating the torque T, resisting hair deflection became unambiguous. The length of the hair shaft between the outer edge of the socket and the pivoting axis located at the suspension membrane was 12±1 μm. These data are in good agreement with previous results, where the length of the hair shaft inside the socket was determined morphologically to be 10–15 μm for large trichobothria (Barth et al. 1993).
2.6. Testing methodology: deflection of a rigid hair
The force necessary to deflect the hair by a unit amount was measured by positioning the AFM cantilever tip at varying points along the length of the hair shaft and acquiring force–distance curves as discussed above. The results of the hair deflection measurements at small forces (less than 500 nN) were based on two key assumptions: (i) the hair shaft does not bend in this regime and (ii) the AFM cantilever tip does not penetrate into the cuticle of the hair shaft.
Both assumptions were verified prior to the SFS measurements. The absence of hair bending under the nano-Newton forces used for high-resolution studies was confirmed by measurements of hair deflection using the same value of force applied at various distances L from the pivoting point along the hair shaft. The increase of hair deflection with increasing force applied at any particular point showed no nonlinearities that could have been due to contacting the socket edge or bending of the hair shaft. However, the same value of force applied at increasing distances L from the pivotal axis led to a quadratic increase (R 2>0.99) in hair displacement clearly indicating that the hair behaves as a rigid beam. The absence of local hair indentation was validated by performing independent SFS measurements on a hair that had been plucked and immobilized on a rigid substrate (silicon), considered to be infinitely hard. Under the modest normal loads used here, the indentation depth, if any, was close to the experimental uncertainty. It did not exceed 1 nm at the largest load and therefore only slightly penetrated into the topmost layer of the epicuticle leading to the adhesion seen in the retraction curves of the force–distance measurements (figure 5 b). The thickness of the epicuticle on the leg of Cupiennius is 200 nm, with a thickness of the lipid layers of 10–40 nm (Barth 1969; McConney et al. 2007). By its smallness, the penetration into the epicuticle did not contribute to the deflection measurements. The hair was deflected as a rigid rod with its large stiffness relying mainly on the stiffness of the exocuticle, which has an elastic modulus of approximately 18 GPa in C. salei (Blickhan & Barth 1985; Barth 2002).
3. Results
3.1. Measuring the torques resisting hair motion
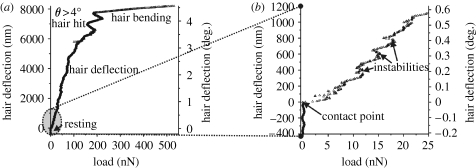
The micromechanical behaviour of a hair under maximum forces normal to the long axis of the hair shaft and reaching 500 nN is presented in figure 7 a. The complex and nonlinear loading curve reflects the contribution of several different mechanical regimes. First, the deflection of the hair just before making contact with the AFM cantilever tip is zero (figure 7 b). Then, immediately after the engagement of the AFM cantilever tip at the contact point, the hair starts its nanoscale deflection, which is noisy but essentially linear up to loads close to 100 nN. The irregular deflections observed are caused by the interaction of the AFM cantilever tip with the microstructure of the hair shaft surface (see §2; figure 2 a).
Figure 7.
Hair shaft bending measurements. (a) A load–hair deflection curve, using relatively large forces. After significant deflection, the hair made contact with the socket and then the hair shaft was bent as seen from the small slope of the curve. (b) The same load curve as in (a), with the initial part of the curve enlarged to show the region where the AFM cantilever tip contacts the hair shaft.
At larger normal loads hair deflection becomes erratic, especially between 7000 and 8000 nm, and finally alters dramatically (figure 7 a). The erratic behaviour at approximately 7000 nm deflection is probably due to several different surface patches of the hair contacting the inner parts of the socket. For deflections larger than 7500 nm, the force required to deflect the hair further increases steeply indicating a change in the hair's mechanical behaviour. Figure 7 a and b reflect the overall hair behaviour observed in our large deflection experiments: steady, close to linear deflection as a rigid body for deflections of less than approximately 7500 nm, followed by a steep increase in mechanical resistance when the hair contacts the socket rim and starts bending. The bending stiffness of the hair shaft of the 950 μm long trichobothrium, selected as a representative example, was measured to be 0.18 (±0.03) N m−1 (n=15), the AFM cantilever tip being 43.8 μm from the hair suspension membrane. The overall quadratic relation for the bending stiffness k of the hair shaft, as a function of distance from the pivoting point, L in μm, was k=3.38×10⁻⁴ L 2–4.35×10⁻² L+1.44 (N m−1).
Considering the significant instabilities observed in the micromechanical behaviour measured under large deflection conditions, we conducted high-resolution experiments with more flexible cantilevers after nanoshaving the microtrichs to obtain the deflection characteristics in the range of very small forces (less than 2 nN). Under these conditions, the hair deflected fairly linearly with the force changing from 12.5 pN to 1.5 nN (figure 8 a,b). Note that the first point in figure 7 b is beyond the 0.5 nm uncertainty of the SFS measurement technique, and therefore well measurable. The loading curve is directly related to the torque resisting hair deflections by multiplying the force with the length of the lever arm. The trichobothrium could be reproducibly deflected by 0.001° (17.5 μrad). This is an extremely small value, well below the sensory threshold deflection angle down to 0.01° (Barth & Höller 1999). Hair deflection at small forces changed linearly by 0.85 nm increments per each 12.5 pN increase in load (figure 8 b). The mechanical response of the hairs was linear at the specific angular velocities, even well below the sensory threshold deflection. Moreover, even under very small pico-Newton forces the hair response was smooth, with a mean deviation from linearity of the order of ±0.2 nm (figure 8 b).
Figure 8.
High-resolution hair shaft deflection measurements for a hair shortened to 114.5 μm. (a) High-resolution load–deflection curve; example of the load curves used to determine the two- and three-parameter model constants. Average of five measurements (±s.d.) obtained at an angular velocity of 0.029±0.004 rad s−1. The dashed line represents the minimum angle of deflection necessary to elicit a nervous response as measured electrophysiologically (Barth & Höller 1999). (b) Enlarged initial region of the load–deflection curve displayed in (a).
3.2. Viscoelastic model parameters
Preliminary values of the torsional restoring constant S, in which the contribution of the torque associated with damping was neglected, were obtained by relating the slope of the loading curves to a unit hair deflection of 1 rad. Previous data (Humphrey et al. 1993, 1998) and current findings suggest that values of the torsional restoring constant S obtained this way are close to the true values, although slightly overestimated. In investigations of hairs 910 and 923 μm long, the preliminary torsional restoring constants were measured to be 7.3×10⁻¹² (±0.6×10⁻¹²) Nm rad−1 and 4.3×10⁻¹² (±0.1×10⁻¹²) Nm rad−1, respectively.
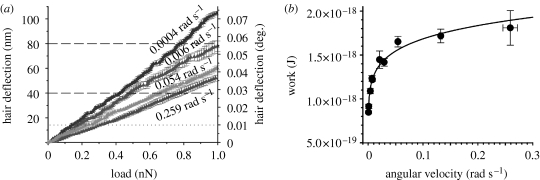
Given the potential importance of a trichobothrium's mechanical properties for its physiological response, we studied its torsional behaviour at angular velocities between 0.0004 and 0.26 rad s−1 by collecting force–distance data in the high-resolution mode (figure 9 a). Surprisingly, the mechanical resistance of a hair to deflection forces, and consequently the work to deflect it to the physiological threshold angle, dropped sharply for angular velocities smaller than 0.05 rad s−1 (figures 9 b and 10 a). To the authors' knowledge, no previous work has reported such a trend in arthropod air flow-sensing hair receptors.
Figure 9.
(a) High-resolution load–deflection curves. At lower angular velocity, the hair pivots much more with force. The curves shown are average curves ±s.d. (N=1, n=12). (b) Work to reach the physiological threshold deflection of 0.01° (Barth & Höller 1999); see dotted line in (a). The line fitted to the data points (circles) follows the power-law function of work W=2.24×10−18× 0.124 with an average overall uncertainty of 2.6%.
Figure 10.
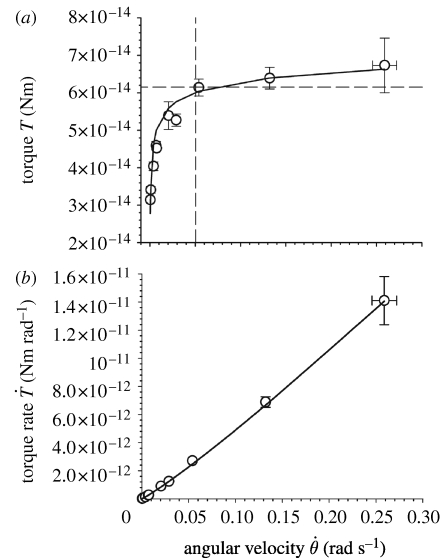
Comparison between measurements (circles; mean ±s.d.) and empirical fits (lines; equations are given in the text) of (a) the torque and (b) its time rate of change as a function of the hair's angular velocity.
Table 2 provides mean and root mean square (r.m.s.) values of the experimental angular velocity, the torque and the time rate of change of torque from which the viscoelastic model parameters were determined. The torque values at a fixed hair deflection angle of 1.23×10⁻³ rad (0.07°) (which was the maximum angle that could be achieved at all deflection velocities with the same trigger deflection of the AFM's cantilever) are empirically related to the angular velocity by the expression T=8.50×10⁻¹⁴–1.48×10⁻¹⁴
 −0.174 (Nm) (figure 10
a). The empirical fit predicts the torque with an absolute difference smaller than 6 per cent over the entire range of angular velocities explored. The time rate of change of torque is empirically given by
  (Nm s−1) (figure 10
b), with an absolute difference smaller than 4 per cent. We note that the torque T tends towards an asymptotic value of 8.50×10⁻¹⁴ Nm for very large angular velocities. This is to be expected since the viscoelastic dashpot element resists deformation induced by motions at high angular velocities and, as a consequence, deformation can only occur owing to the spring elements. The latter, however, deform in proportion to the torque irrespective of the rate of change and are responsible for the asymptotic behaviour observed.
Table 2.
Angular velocity  , torque T, and torque rate of change
  (mean ±r.m.s. values) for a shortened trichobothrium originally 950 μm long at a deflection angle fixed to θ
tot=1.226×10⁻³ rad (N=1, n=81). (The rate of change of the torque is determined as explained in the text and its r.m.s. from the expression
  where σ denotes r.m.s. value. In this formula, the r.m.s. values for T
SFS and
  are taken from the table entries, and that for θ
tot is estimated to be 2.45×10⁻⁵ rad from the experimental uncertainties of lever arm length and instrumental inaccuracies of the AFM.)
| data point | angular velocity mean (rad s−1) | angular velocity r.m.s. (rad s−1) | torque mean (Nm) | torque r.m.s. (Nm) | torque rate mean (Nm s−1) | torque rate r.m.s. (Nm s−1) |
|---|---|---|---|---|---|---|
| 1 | 4.20×10⁻⁴ | 2.25×10⁻⁶ | 3.14×10⁻¹⁴ | 6.09×10⁻¹⁶ | 1.08×10⁻¹⁴ | 3.06×10⁻¹⁶ |
| 2 | 8.17×10⁻⁴ | 7.43×10⁻⁶ | 3.41×10⁻¹⁴ | 9.22×10⁻¹⁶ | 2.27×10⁻¹⁴ | 7.91×10⁻¹⁶ |
| 3 | 3.84×10⁻³ | 4.04×10⁻⁵ | 4.04×10⁻¹⁴ | 1.15×10⁻¹⁵ | 1.27×10⁻¹³ | 4.61×10⁻¹⁵ |
| 4 | 6.81×10⁻³ | 6.65×10⁻⁵ | 4.59×10⁻¹⁴ | 1.12×10⁻¹⁵ | 2.55×10⁻¹³ | 8.41×10⁻¹⁵ |
| 5 | 7.37×10⁻³ | 3.78×10⁻⁵ | 4.52×10⁻¹⁴ | 5.78×10⁻¹⁶ | 2.72×10⁻¹³ | 6.60×10⁻¹⁵ |
| 6 | 2.05×10⁻² | 6.07×10⁻⁴ | 5.39×10⁻¹⁴ | 3.70×10⁻¹⁵ | 8.97×10⁻¹³ | 6.94×10⁻¹⁴ |
| 7 | 2.89×10⁻² | 3.99×10⁻⁴ | 5.27×10⁻¹⁴ | 1.64×10⁻¹⁵ | 1.24×10⁻¹² | 4.90×10⁻¹⁴ |
| 8 | 5.39×10⁻² | 9.40×10⁻⁴ | 6.14×10⁻¹⁴ | 2.25×10⁻¹⁵ | 2.70×10⁻¹² | 1.22×10⁻¹³ |
| 9 | 1.32×10⁻¹ | 2.84×10⁻³ | 6.39×10⁻¹⁴ | 2.90×10⁻¹⁵ | 6.88×10⁻¹² | 3.72×10⁻¹³ |
| 10 | 2.59×10⁻¹ | 1.32×10⁻² | 6.73×10⁻¹⁴ | 7.30×10⁻¹⁵ | 1.41×10⁻¹¹ | 1.71×10⁻¹² |
Using the physical–mathematical procedure described in §2.3.1 for the two-parameter Kelvin model applied to all the measured data points, the model parameters were found to be S
2p=3.57×10⁻¹¹ (±8.08×10⁻¹²) Nm rad−1 and R
2p=1.15×10⁻¹³ (±1.05×10⁻¹³) Nm s rad−1. To check the goodness of this model, the torque T
SFS was calculated using equation (2.2) for the values of  in table 2 and the values obtained for S
2p and R
2p. The difference between the measurements and the calculations averaged over the entire range of angular velocities is 14 per cent, reaching values as high as 39 per cent at the smallest angular velocity. Owing to the poor agreement, especially at low angular velocities, a second regression was performed using only the data corresponding to
  >0.05 rad s−1. From this, it was found that S
2p=4.89×10⁻¹¹ (±2.88×10⁻¹³) Nm rad−1 and R
2p=2.83×10⁻¹⁴ (±2.07×10⁻¹⁵) Nm s rad−1, which yielded calculated values of T
SFS differing from those measured by less than 0.5 per cent (figure 11).
Figure 11.
Comparison between measurements and calculations of the torque acting on a spider trichobothrium using the two-parameter (2p) and the three-parameter (3p) models described in the text: the measured data (down triangles, with error bars), the empirical fit (black solid curve), values calculated using the two-parameter model fitted to all the measured data points (dotted line), values calculated using the two-parameter model fitted to the three points at angular velocities larger than 0.05 rad s−1 (dashed line), and values calculated using the three-parameter model fitted to all the measured data points (up triangles).
For the three-parameter solid model described in §2.3.2, the multiple linear regression of the measured data in table 2 using equation (2.4) yielded S
3p=2.91×10⁻¹¹ (±6.55×10⁻¹²) Nm rad−1,  =2.77×10⁻¹¹ (±9.84×10⁻¹²) and R
3p=1.46×10⁻¹² (±9.26×10⁻¹³) Nm s rad−1. The results of the three-parameter model using the experimentally determined data of angular velocity
  and torque rate
  are plotted in figure 11. The three-parameter model correctly captures the physical behaviour of the hair over the entire range of angular velocities including the drop of torque T for the small velocities, with an average absolute difference of 7 per cent, the largest difference being 16 per cent at the smallest angular velocity.
4. Discussion
4.1. Comparison with fluid mechanic modelling studies
The preliminary statically determined values of S, as well as the two-parameter model values of S
2p and R
2p for the biologically most relevant angular velocities  larger than 0.05 rad s−1 found in the present study, agree within one order of magnitude with the values obtained in earlier studies using a physical–mathematical flow modelling approach (Humphrey et al.
1993, 1998; Humphrey & Barth 2008). Similarly, the three-parameter model values of the two spring elements S
3p and
  are quite comparable to previously determined values but, by contrast, the value of the damping element R
3p is approximately 100 times larger than R
2p. Because the three-parameter model correctly captures the qualitative variation of hair motion over the range of angular velocities and torque rates explored, it is deemed to be more fundamental of the two hair suspension viscoelastic models. Notwithstanding, for angular velocities larger than 0.05 rad s−1, typical of many biologically relevant investigations, the two-parameter model yields very good predictions of hair behaviour (Humphrey et al.
1993, 1998; Shimozawa et al.
1998, 2003; Humphrey & Barth 2008).
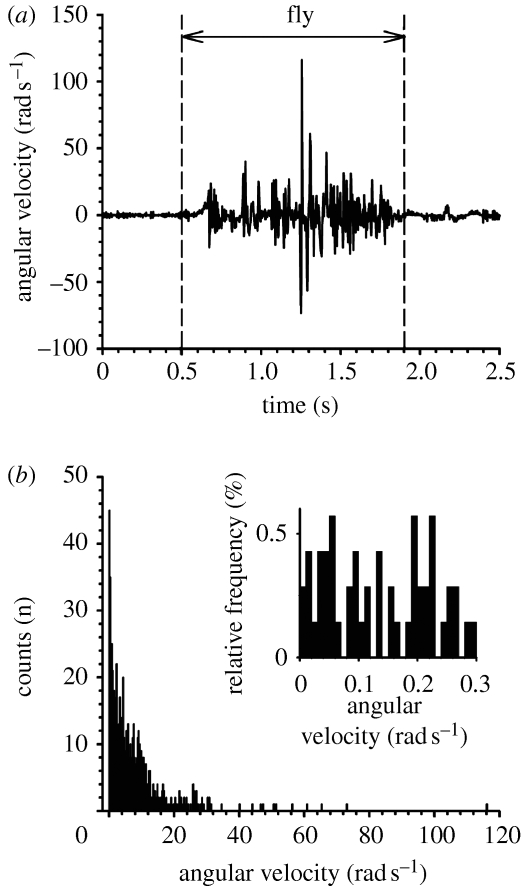
Applying the two-parameter model, Barth et al. (1993) obtained constant values for S (corresponding to S 2p) and R (corresponding to R 2p) for a 750 μm long trichobothrium on the metatarsus (MeD1) of Cupiennius salei and found these to be 5.77×10⁻¹² Nm rad−1 and 2.20×10⁻¹⁵ Nm s rad−1, respectively, in the case of a sinusoidally oscillating flow with a velocity amplitude of 50 mm s−1 driving the hair. The experimental fits for Cupiennius hairs provided in Humphrey et al. (2003) yield the constant values S=1.32×10⁻¹¹ Nm rad−1 and R=3.34×10⁻¹⁵ Nm s rad−1 for a 950 μm long hair on the tibia (TiDA1). Our present results are also in good agreement with the constant S values of approximately 10−11 Nm rad−1 found by Shimozawa & Kanou (1984a) for 1 mm long cricket filiform hairs for the case of quasistatic loading experiments. The filiform hairs on the cerci of crickets are similar to the spider trichobothria with regard to diameter and length, and they are sensitive to similar air flow velocities (Shimozawa & Kanou 1984b ; Shimozawa et al. 1998; Casas et al. 2008). It should be noted that the flow conditions corresponding to the deflection of the above-mentioned MeD1 and TiDA1 spider trichobothria are associated with maximum angular velocities significantly larger than 1 rad s−1. In this regard, the results of Humphrey & Barth (2008, fig. 18b) show that the angular velocities of MeD1 hairs 250–1000 μm long greatly exceed 1 rad s−1 in oscillating air flows with frequencies larger than 10 Hz and constant velocity amplitude of 10 mm s−1. The same is true for MeD1 hairs 500 μm long in oscillating air flows with frequencies larger than 50 Hz and constant velocity amplitude of 2 mm s−1 (Humphrey & Barth 2008, fig. 23). Angular deflection velocities of trichobothria exposed to natural air flows eliciting prey capture behaviour of the spider as in the wake of a buzzing fly are frequently larger than 1 rad s−1 (figure 12; Barth 2002).
Figure 12.
Angular velocity of a trichobothrium hit by the wake cone of a fly buzzing stationarily at a distance of 4 cm from the trichobothrium and at an angle of 45° to the long axis of the spider leg. (a) Time course of the angular velocity measured from high-speed video recordings (sampling rate, 500 frames per second). (b) Distribution of the angular velocity values from (a) between 0.5 and 1.9 s, bin size 0.25 rad s−1 and n=700. Negative velocity values from (a) were accounted for as positive. Inset: relative frequencies of angular velocity values in the range from 0 to 0.3 rad s−1; bin size 0.01 rad s−1.
4.2. Modelling of the viscoelastic hair suspension
All models for linear viscoelastic materials are composed of linear springs and linear viscous dashpots to describe the stress–strain–time relations of such materials (Flügge 1967; Findley et al. 1976; Fung 1993). The form of equation (2.1), describing filiform hairs as forced damped harmonic oscillators, tacitly assumes that the viscoelastic behaviour of the hair suspension material can be approximated as a Kelvin solid, i.e. according to a linear viscoelastic model consisting of a spring element (S 2p) and a dashpot element (R 2p) in parallel. Thus, in equation (2.1) the torque T m, characterizing the material's inherent resistance to motion is given by
 |
4.1 |
where R 2p and S 2p are constants (Flügge 1967; Findley et al. 1976; Fung 1993). The response of this model to a suddenly imposed external torque is for the torque to be initially carried entirely by the viscous element R 2p, thus preventing any immediate deflection of the hair. However, as the viscous element elongates, it transfers an increasing portion of the applied torque to the elastic element S 2p, so that, finally, the entire torque is carried by the elastic element S 2p. Such behaviour is referred to as delayed elasticity (Findley et al. 1976).
By resorting to a three-parameter viscoelastic solid as described by equation (2.3), deformation can occur for any rate of applied torque. Whereas the two-parameter model would resist a deformation for a suddenly applied torque, the three-parameter model results in an initial deformation of the hair suspension by the two spring elements, S
3p and  , acting in parallel. Therefore, to achieve a particular angular deformation as the rate of deformation increases, the torque required to reach that angular deformation should asymptotically approach a constant value as observed in the experimental data. The two-parameter model achieves a similar effect by incorporating a numerical value for the dashpot that is three orders of magnitude smaller than the numerical value for the spring. The similar magnitudes of the three-parameter model constants allow the model to capture the deformation at low angular velocities.
These findings suggest that the viscoelastic nature of the hair suspension material and structure is complex at low angular velocities, with reversible elastic deformation and irreversible dissipation of mechanical energy strongly depending on both the deformation and the rate of deformation of the material. The mechanical behaviour of the hair can be associated with the time-dependent shearing properties of materials consisting of physical networks of molecules (Sperling 2006; Wineman & Shaw 2006), similar to the protein matrix in arthropod cuticle.
Not surprisingly, the work required to deflect the hairs to their physiological threshold angle of 0.01° (Barth & Höller 1999) at constant velocities essentially follows the changes of the torque T (figures 9 b and 10 a). The asymptotic, large angular velocity value for this work is approximately 2×10⁻¹⁸ J, close to the value of the area under the hair deflection versus load curve in figure 8 b for 0.259 rad s−1. When allowance is made for the fact that this load curve corresponds to the first half of a sawtooth wave, it is possible to compare with the work generated by a sinusoidally oscillating hair of similar characteristics (Humphrey et al. 2003). For such a wave, the absolute value of work generated during each quarter of the sinusoidal oscillation is a number ranging between 4×10⁻¹⁸ and 1×10⁻¹⁷ J, approximately. The correspondence between these values and the asymptotic one of the present study is acceptable, especially when allowance is made for the fact that neither the angular velocity nor the acceleration is constant for sinusoidally oscillating hairs. Note that, if instead of integrating a quarter of a sinusoidal cycle the integration is carried out for a full cycle, the net work obtained is smaller (10−20 to 10−19 J; Humphrey et al. 2003), because of the energy returned by the oscillating hair.
4.3. Sources of hair suspension viscoelasticity
The structures responsible for the viscoelastic behaviour of the hair suspension are the following (figure 3; Humphrey & Barth 2008).
The membrane, which connects the hair shaft and the exoskeleton, is suggested to represent the main spring element consisting of a highly elastic material. Its increase in stiffness may result from viscoelastic effects, such as already shown for a soft cuticular pad of Cupiennius, which functions as a high-pass filter in the spider substrate vibration receptor (McConney et al. 2007). It seems likely that the hair suspension membrane contains resilin, which is known to elastically store energy with high efficiency in the joints of insects. According to dynamic mechanical testing between 10 and 200 Hz, the elastic modulus of resilin increases with increasing frequency as does the torque T resisting the hair deflection in the present study (Gosline et al. 2002).
Regarding the dashpot element, we suggest two possible sources for the damping properties of the hair suspension. (a) The lever arm of the hair shaft below the suspension membrane, and the structure coupling the outer dendritic segments of the sensory cells to it, are surrounded by receptor lymph (Anton 1991; Barth 2002). The displacement of receptor lymph in such a confined space can be expected to be highly viscous, and the associated energy dissipation will work to dampen the hair deflection. (b) The region of the coupling structure contacting the dendrites may add to this initial low-velocity damping, but no experimental data are available yet.
4.4. Biological relevance
The velocities of background flows during the activity period of the spider in its natural habitat are typically smaller than 0.1 m s−1, whereas the flow velocities generated by a buzzing fly can reach values of up to 1 m s−1 (Barth et al. 1995). The even more important difference between flow signals generated by prey insects or predators and the background wind is the flow velocity time history. The signals generated by prey or predators are of a fluctuating nature, characterized by relatively large ranges in the spatial and temporal scales of motion. By contrast, the background wind, in particular, during the night time activity of Cupiennius, is characterized by a much more steady flow (Barth et al. 1995; Klopsch et al. 2007). Angular deflection velocities of trichobothria caused by natural stimuli, such as the background wind or the highly turbulent wake of a fly, span a broad range of values with peak velocities of up to 150 rad s−1 (figure 12 a). Interestingly, only 1.7 per cent of the angular velocity values are less than 0.05 rad s−1 (figure 12 b), falling in the range of the deviation from the Kelvin solid-like behaviour of the suspension material.
At high angular velocities, the viscous dashpot element characterized by R
3p in the three-parameter model resists deformation, and as a consequence, the two spring elements S
3p and  dictate hair motion (figure 4
b). This results in torque being directly proportional to the hair's angular deflection. By contrast, at low angular velocities the dashpot element can deform, thus relaxing the material and resulting in a lower torque to attain the same angular deflection. This viscoelastic material behaviour at low angular velocities facilitates the start of hair motion from rest, thereby contributing to the highly phasic properties of the nervous response of the trichobothria (Barth & Höller 1999; Barth 2002). Note that under biologically relevant stimulus conditions, a trichobothrium generally moves at high angular velocities for which the spring elements dominate hair motion. Highly fluctuating signals such as those produced by potential prey animals result in frequent and sudden changes of the hair's angular velocity. Indeed, directly at the start of a motion with large constant velocity the action potential discharge rate of the hair sensory cells is larger than during ongoing deflection (Barth & Höller 1999). The mechanical properties of the hair suspension seem to specifically support the oscillating nature of the deflections of a trichobothrium caused by biologically relevant stimulus patterns.
In addition to the hair suspension structures, the viscoelastic properties of the dendrites themselves may help to explain the phasic response pattern of the sensory cells of the trichobothria, which readily respond to movement, but not to static deflection (Barth & Höller 1999). It is quite possible that only during movement of the coupling structure, not however during static deflection, the strain exerted on the sensory cell membrane is large enough to open a suprathreshold number of ion channels leading to the generation of the nervous response.
Acknowledgments
The authors would like to thank Melburne C. LeMieux, Srikanth Singamaneni, Maryna Ornatska and Christian Klopsch for their valuable discussions. Funding was provided by the DARPA BioSenSE Program grant no. FA9550-05-1-0459 to F.G.B., J.A.C.H. and V.V.T. J.A.C.H. gratefully acknowledges a Guest Professorship in the Department of Neurobiology and Cognition Research at the University of Vienna during the work on this study. He also thanks T. Baber at UVA for the helpful discussions on viscoelastic materials.
Appendix A
For purposes of the estimates provided in this appendix, we model the hair suspension as a two-parameter Kelvin solid model. (For convenience, we drop the 2p subscript notation on the torsional restoring constant S and the damping constant R.) For these conditions, the equation governing the angular momentum of a hair being driven by a mechanical probe is
 |
A1 |
where, assuming the hair is a straight cylinder, the moment of inertia I is given by
 |
A2 |
and d, L and ρ
h are the hair diameter, length and density, respectively. In equation (A 1), T is the total torque acting on the hair: that is, it is the sum of the imposed mechanical probe torque T
SFS and the torque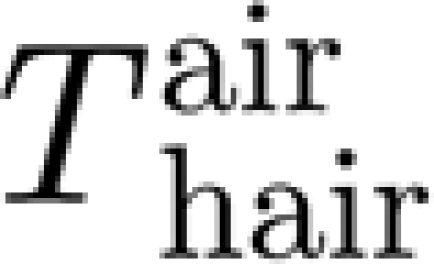 resisting hair motion owing to the interaction of the hair with the air (T=T
SFS−
 ).
).
In the experiment, the hair is displaced by the mechanical probe according to a triangular waveform pattern consisting of a constant displacement velocity during the downward and upward strokes, respectively. Because the hairs are displaced at constant angular velocity, the term 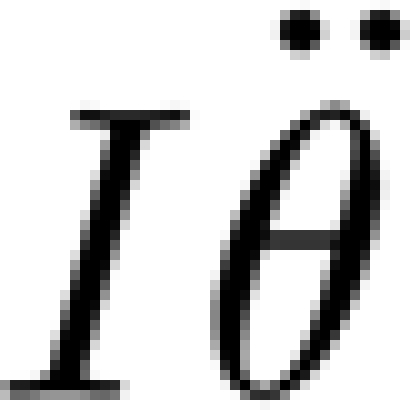 in equation (A 1) is negligible and this equation simplifies to
 |
A3 |
We now show for the case of a sinusoidally oscillating system that the torque terms 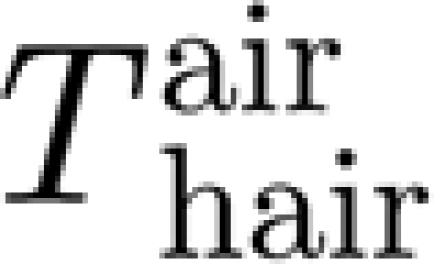 contributing to T are small relative to the mechanical probe torque T
SFS imposed in the experiments. For sinusoidal hair oscillations (Humphrey & Barth 2008)
 |
A4 |
where the total force F per unit hair length is
 |
A5 |
and the following definitions apply
 |
A6a |
 |
A6b |
and
 |
A6c |
In equations (A 6a–c), μ and ρ are the dynamic viscosity and density of air; V
r and  are the relative velocity and acceleration of the air relative to the hair (see below); and the quantity G is given by
 |
A7 |
where
 |
A8 |
and
 |
A9 |
(with ν=μ/ρ), which is a necessary condition readily satisfied in our experiments.
For the order of magnitude analysis of interest here, we can assume that the relative velocity and acceleration of the air with respect to the hair are given by (Humphrey & Barth 2008)
 |
A10 |
and
 |
A11 |
with U o given by
| A12 |
where U o and f are the amplitude and frequency of the oscillating air flow.
Taking L=1000 μm, d=4 μm and f=20.8 Hz yields
 |
A13a |
 |
A13b |
and
 |
A13c |
When substituted into equation (A 4) and integrated over the truncated lengths L F of the hairs examined, equations (A 13a–c) yield torques of the order of 10−17, 1.4×10⁻¹⁸ and 4.32×10⁻²² Nm, respectively. By contrast, from figure 8, we estimate that an upper limit on T SFS is given by
 |
The conclusion is that the air-induced torques opposing hair displacement are small relative to T SFS and the final equation of motion for the hair is
 |
A14 |
References
- Anton S. Zentrale Projektionen von Mechano- und Chemorezeptoren bei der Jagdspinne. Cupiennius salei. 1991. Keys. Dissertation, Universität Wien.
- Barth F.G.1969Die Feinstruktur des Spinnenintguments I. Die Cuticula des Laufbeins adulter häutungsferner Tiere (Cupiennius salei Keys). Z. Zellforsch. 97, 137–159. 10.1007/BF00331877. [DOI] [PubMed] [Google Scholar]
- Barth F.G.2000How to catch the wind: spider hairs specialized for sensing the movement of air. Naturwissenschaften. 87, 51–58. 10.1007/s001140050010. [DOI] [PubMed] [Google Scholar]
- Barth F.G.A spider's world: senses and behavior. 2002Berlin, Heidelberg, Germany; New York, NY:Springer [Google Scholar]
- Barth F.G, Höller A.1999Dynamics of arthropod filiform hairs V. The response of spider trichobothria to natural stimuli. Phil. Trans. R. Soc. B. 354, 183–192. 10.1098/rstb.1999.0370. [DOI] [Google Scholar]
- Barth F.G, Wastl U, Humphrey J.A.C, Devarakonda R.1993Dynamics of arthropod filiform hairs. II. Mechanical properties of spider trichobothria (Cupiennius salei Keys.). Phil. Trans. R. Soc. B. 340, 445–461. 10.1098/rstb.1993.0084. [DOI] [Google Scholar]
- Barth F.G, Humphrey J.A.C, Wastl U, Halbritter J, Brittinger W.1995Dynamics of arthropod filiform hairs III. Flow patterns related to air movement detection in a spider (Cupiennius salei Keys.). Phil. Trans. R. Soc. B. 347, 397–412. 10.1098/rstb.1995.0032. [DOI] [Google Scholar]
- Bathellier B, Barth F.G, Albert J.T, Humphrey J.A.C.2005Viscosity-mediated motion coupling between pairs of trichobothria on the leg of the spider Cupiennius salei. J. Comp. Physiol. A. 191, 733–746. 10.1007/s00359-005-0629-5. [DOI] [PubMed] [Google Scholar]
- Blickhan R, Barth F.G.1985Strains in the exoskeleton of spiders. J. Comp. Physiol. A. 157, 115–147. 10.1007/BF00611101. [DOI] [PMC free article] [PubMed] [Google Scholar]
- Cappella B, Dietler G.1999Force–distance curves by atomic force microscopy. Surf. Sci. Rep. 34, 1–104. 10.1016/S0167-5729(99)00003-5. [DOI] [Google Scholar]
- Casas J, Steinmann T, Dangles O.2008The aerodynamic signature of running spiders. PLoS ONE. 3, e2116. 10.1371/journal.pone.0002116. [DOI] [PMC free article] [PubMed] [Google Scholar]
- Devarakonda R, Barth F.G, Humphrey J.A.C.1996Dynamics of arthropod filiform hairs. IV. Hair motion in air and water. Phil. Trans. R. Soc. B. 351, 933–946. 10.1098/rstb.1996.0086. [DOI] [Google Scholar]
- Findley W.N, Lai J.S, Onaran K.Creep and relaxation of non-linear viscoelastic materials. 1976New York, NY:Dover Publications [Google Scholar]
- Flügge W.Viscoelasticity. 1967Waltham, MA:Blaisdell Publishing Company [Google Scholar]
- Fuchigami N, Hazel J, Gorbunov V.V, Stone M, Grace M.S, Tsukruk V.V.2001Biological thermal detection. I: ultra-microstructure of pit organs in infra-red imaging snakes. Biomacromolecules. 2, 757–764. 10.1021/bm015537z. [DOI] [PubMed] [Google Scholar]
- Fung Y.C.Biomechanics. 2nd edn.1993New York, NY:Springer [Google Scholar]
- Gibson C.T, Watson G.S, Myhra S.1996Determination of the spring constants of probes for force microscopy/spectroscopy. Nanotechnology. 7, 259–262. 10.1088/0957-4484/7/3/014. [DOI] [Google Scholar]
- Gorbunov V, Fuchigami N, Stone M, Grace M, Tskukruk V.V.2002Biological thermal detection: micromechanical and microthermal properties of biological infrared receptors. Biomacromolecules. 3, 106–115. 10.1021/bm015591f. [DOI] [PubMed] [Google Scholar]
- Gosline J, Lillie M, Carrington E, Guerette P, Ortlepp C, Savage K.2002Elastic proteins: biological roles and mechanical properties. Phil. Trans. R. Soc. B. 357, 121–132. 10.1098/rstb.2001.1022. [DOI] [PMC free article] [PubMed] [Google Scholar]
- Hazel J.L, Tsukruk V.V.1998Friction force microscopy measurements: normal and torsional spring constants for V-shaped cantilevers. J. Tribol. 120, 814–819. 10.1115/1.2833784. [DOI] [Google Scholar]
- Hazel J.L, Tsukruk V.V.1999Spring constants of composite ceramic/gold cantilevers for scanning probe microscopy. Thin Solid Films. 339, 249–258. 10.1016/S0040-6090(98)00961-4. [DOI] [Google Scholar]
- Humphrey J.A.C, Barth F.G.Medium flow-sensing hairs: biomechanics and models. In Insect mechanics and control Casas J, Simpson S.J.Advances in insect physiology vol. 342008. pp. 1–80. Eds. Amsterdam, The Netherlands:Elsevier. [Google Scholar]
- Humphrey J.A.C, Devarakonda R, Iglesias I, Barth F.G.1993Dynamics of arthropod filiform hairs I. Mathematical modelling of the hair and air motions. Phil. Trans. R. Soc. B. 340, 423–444. 10.1098/rstb.1993.0083. [DOI] [Google Scholar]
- Humphrey J.A.C, Devarakonda R, Iglesias I, Barth F.G.1998Errata re. Humphrey et al. 1993. Phil. Trans. R. Soc. B. 352, 1995 [Google Scholar]
- Humphrey J.A.C, Barth F.G, Voss K.The motion-sensing hairs of arthropods: using physics to understand sensory ecology and adaptive evolution. In The ecology of sensing Barth F.G, Schmid A.2001. pp. 105–125. Eds. Berlin, Heidelberg, Germany; New York, NY:Springer. [Google Scholar]
- Humphrey J.A.C, Barth F.G, Reed M, Spak A.The physics of arthropod medium-flow sensitive hairs: biological models for artificial sensors. In Sensors and sensing in biology and engineering Barth F.G, Humphrey J.A.C, Secomb T.W.2003. pp. 129–144. Eds. Wien, Austria; New York, NY:Springer. [Google Scholar]
- Hutter J.L, Bechhoefer J.Calibration of atomic-force microscope tips. Rev. Sci. Instrum. 64, 1993a1868–1873. 10.1063/1.1143970. [DOI] [Google Scholar]
- Hutter J.L, Bechhoefer J.Erratum re. Hutter & Bechhoefer 1993a. Rev. Sci. Instrum. 64, 1993b3342. 10.1063/1.1144449. [DOI] [Google Scholar]
- Klopsch C, Barth F.G, Humphrey J.A.C.The air flow generated by a flying prey insect around a wandering spider and its motion-sensing hair sensilla. In Fifth Int. Symp. on turbulence and shear flow phenomena Friedrich R, Adams N.A, Eaton J.K, Humphrey J.A.C, Kasagi N, Leschziner M.A.2007. pp. 1023–1028. Eds. Garching, Germany:TU München. [Google Scholar]
- Kovalev A, Shulha H, LeMieux M, Myshkin N, Tsukruk V.V.2004Nanomechanical probing of layered nanoscale polymer films with atomic force microscopy. J. Mater. Res. 19, 716–728. 10.1557/jmr.2004.0092. [DOI] [Google Scholar]
- LeMieux M, Usov D, Minko S, Stamm M, Shulha H, Tsukruk V.V.2003Reorganization of binary polymer brushes: switching surface microstructures and nanomechanical properties. Macromolecules. 36, 7244–7255. 10.1021/ma034634c. [DOI] [Google Scholar]
- McConney M.E, Schaber C.F, Julian M.D, Barth F.G, Tsukruk V.V.2007Viscoelastic nanoscale properties of cuticle contribute to the high-pass properties of spider vibration receptor (Cupiennius salei Keys). J. R. Soc. Interface. 4, 1135–1143. 10.1098/rsif.2007.1000. [DOI] [PMC free article] [PubMed] [Google Scholar]
- Peleshanko S, et al. 2007Hydrogel-encapsulated microfabricated haircell mimicking fish cupula neuromast. Adv. Mater. 19, 2903–2909. 10.1002/adma.200701141. [DOI] [Google Scholar]
- Shimozawa T, Kanou M.The aerodynamics and sensory physiology of range fractionation in the cercal filiform sensilla of the cricket Gryllus bimaculatus. J. Comp. Physiol. A. 155, 1984a495–505. 10.1007/BF00611914. [DOI] [Google Scholar]
- Shimozawa T, Kanou M.Varieties of filiform hairs: range fractionation by sensory afferents and cercal interneurons of a cricket. J. Comp. Physiol. A. 155, 1984b485–493. 10.1007/BF00611913. [DOI] [Google Scholar]
- Shimozawa T, Kumagai T, Baba Y.1998Structural scaling and functional design of the cercal wind-receptor hairs of cricket. J. Comp. Physiol. A. 183, 171–186. 10.1007/s003590050245. [DOI] [Google Scholar]
- Shimozawa T, Murakami J, Kumagai T.Cricket wind receptors: thermal noise for the highest sensitivity known. In Sensors and sensing in biology and engineering Barth F.G, Humphrey J.A.C, Secomb T.W.2003. pp. 145–157. Eds. Wien, Austria; New York, NY:Springer. [Google Scholar]
- Sperling L.H.Introduction to physical polymer science. 4th edn.2006Hoboken, NJ:Wiley [Google Scholar]
- Tsukruk V.V, Huang Z, Chizhik S.A, Gorbunov V.V.1998Probing of micromechanical properties of compliant polymeric materials. J. Mater. Sci. 33, 4905–4909. 10.1023/A:1004457532183. [DOI] [Google Scholar]
- Tsukruk V.V, Gorbunov V.V, Huang Z, Chizhik S.A.2000Dynamic microprobing of viscoelastic polymer properties. Polym. Int. 49, 441–444. 10.1002/(SICI)1097-0126(200005)49:5%3C441::AID-PI240%3E3.0.CO;2-U. [DOI] [Google Scholar]
- Wineman A, Shaw J.2006Influence of thermally induced chemorheological changes on the torsion of elastomeric circular cylinders. Continuum Mech. Thermodyn. 17, 477–492. 10.1007/s00161-006-0009-6. [DOI] [Google Scholar]


