

Abstract
Few studies have examined associations between depressive symptoms and alterations in neural systems that subserve cognitive control. Cognitive control was assessed with an exogenous cueing task using happy, sad, and neutral facial expressions as cues among women with mild to moderate symptoms of depression and a non-depressed control group while functional magnetic resonance imaging (fMRI) measured brain activity. Amygdala and medial/orbital PFC response to valid emotion cues did not differ as a function of depression symptoms. However, significant depression group differences were observed when task demands required cognitive control. Participants with elevated depression symptoms showed weaker activation in right and left lateral PFC and parietal regions when shifting attentional focus away from invalid emotion cues. No depression group differences were observed for invalid non-emotional cues. Findings suggest that mild to moderate depression symptoms are associated with altered function in brain regions that mediate cognitive control of emotional information.
Keywords: fMRI, emotion processing, reaction time, ventral lateral PFC
Cognitive control generally refers to top-down support for task relevant processes (MacDonald, Cohen, Stenger, & Carter, 2000). Cognitive control is needed to overcome habitual errors or to direct attention from task irrelevant to task relevant stimuli. Depressed individuals appear to have considerable difficulty with cognitive control, particularly when processing emotion stimuli (Dozois & Dobson, 2001; Gotlib, Krasnoperova, Yue, & Joormann, 2004; Koster, De Raedt, Goeleven, Franck, & Crombez, 2005; Liotti, Mayberg, McGinnis, Brannan, & Jerabek, 2002). Brain mechanisms that support cognitive control of emotion stimuli may therefore be altered among depressed individuals.
It has been demonstrated that the lateral prefrontal cortex is involved in cognitive control, especially when competing responses have to be inhibited or new information is selected (e.g., Aron & Poldrack, 2005; Nee, Wager, & Jonides, 2007). The ventral lateral PFC (vlPFC), in particular, is thought to modulate emotional responses through an attentional biasing mechanism that acts on subcortical regions, such as the amygdala (Wager, Davidson, Hughes, Lindquist, & Ochsner, 2008). Two studies have shown that individauls diagnosed with major depressive disorder (MDD) have an attenuated neural response compared to healthy controls in the vlPFC when responding to targets that were preceded by sad distracters (Dichter, Felder, & Smoski, 2009; Wang et al., 2008). These studies document that emotion stimuli can interfere with cognitive control among individuals with high levels of depressive symtoms.
A critical unanswered question is whether cognitive control is disrupted by emotion stimuli among individuals with less severe depression symptoms. Elevated subthreshold symptoms of depression are relatively prevalent (Kessler & Walters, 1998) and robustly predict future development of MDD (Seeley, Stice, & Rohde, 2009). Similarly, elevated depression predicts future MDD better than other putative risk factors (Lewinsohn et al., 1994). Thus, understanding the neural correlates of mild to moderate depression symptoms may provide insight into mechanisms that confer risk for future MDD. The present study examined whether ventral lateral PFC function is altered among individuals with mild to moderate depression symptoms during cognitive control of emotional stimuli.
Method
Participants
Thirty-two women participated in the current study. They were recruited primarily through advertisements placed online, in newspapers, and at local community centers. The study was described as an investigation of emotional information processing and brain activity. Depression was not mentioned in advertisements. The average age of participants ranged from 18 to 28 (mean = 21.8). The race/ethnicity of the participants were 59% White, 18% Hispanic, 12% Black, and 11% Other/multiple races. All participants reported not currently taking any psychiatric medication. Only participants who successfully completed a minimum of 3 runs with motion correction parameters of less than 10% of the in-plane voxel resolution (.35mm) were considered suitable for inclusion in the final results. Five participants revealed motion below the acceptable threshold, leaving 27 (mean age = 22.2, range = 18 to 27) in the final analysis.
Depression severity was measured at the time of testing with the Center for Epidemiologic Studies Depression scale (CESD; Radloff, 1977). The CESD has well-established reliability and validity in general population, adult samples (Radloff, 1977). CESD scores in the current sample ranged from 0 to 33 (M = 10.2; SD = 7.5). No participants met criteria for MDD history, as measured by the lifetime version of the Inventory to Diagnose Depression (Zimmerman & Coryell, 1987). For purposes of examining the effects of depressive symptoms on cue validity, the sample was median split based on their total CESD score. Thirteen individuals were included in a low depressive symptom group (LD, mean CESD = 4.2, SD = 2.3) and 14 individuals were included in a high depressive symptom group (HD, mean CESD = 15.4, SD = 6.4). The mean CESD score for the HD group is indicative of mild to moderate symptoms of depression. Based on mean CESD, less than 10% of the HD group in the current study would likely have met MDD criteria (Santor & Coyne, 1997). The LD and HD groups did not differ on age (F < 1).
fMRI Task
Exogenous Cueing Task
This task is based on Posner’s Attention Network Task (Posner & Petersen, 1990) and has been modified by others to include emotional cues (e.g., Koster et al., 2005). Figure 1 presents a visual depiction of the task procedure. Each trial begins with a central fixation cross for 500ms followed by a cue presented to the left visual field (LVF) or right visual field (RVF) for 1000ms. The location of the cue either correctly or incorrectly predicts the location of a subsequent target (i.e., * or **). The target stimulus appears in the same location as the cue (valid cue trials) 80% of the time. On 20% of the trials, targets appear in the opposite visual field (invalid cue trials). Following offset of the stimulus cue, a target appears for 250ms. The target is either one or two dots and participants indicate probe type by pressing a corresponding response box button as quickly as possible. Cue stimuli were selected from three emotional facial expression categories: happy, sad, and neutral. Facial images are from the “NimStim” collection (Tottenham et al., 2009). A control condition of geometric shape cues was also included. Each cue stimuli is either a single facial expression or geometric shape.
Figure 1.
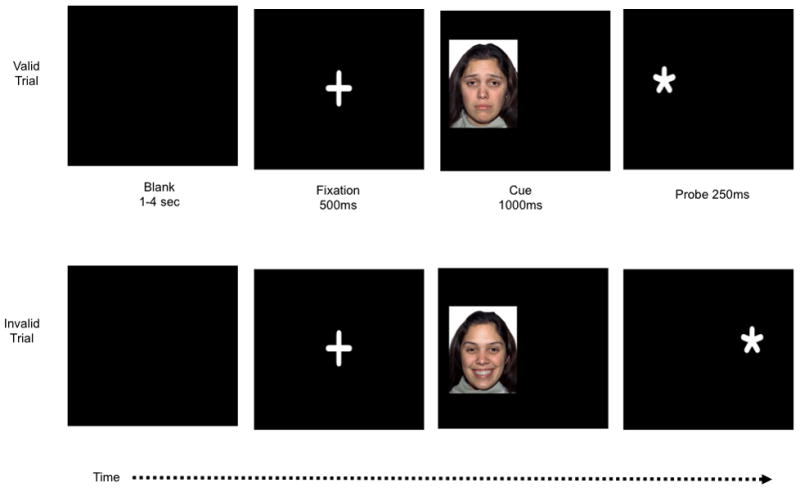
Stimuli sequence for valid and invalid trials for the emotional cueing task. Cue stimuli are not to scale for illustration purposes. Sad and happy cue examples are presented below. Blank screen duration varies in order to optimize temporal jitter.
There were 432 trials distributed across 8 conditions (four cue categories × cue validity) and separated equally into 4 fMRI runs. Each run consists of 108 trials: 20 valid trials for each category and 7 invalid trials per category. Interspersed between trials is 20% “null” time, used to jitter the delivery of images. Timing and distribution of conditions and null time was optimized by optseq2 (http://surfer.nmr.mgh.harvard.edu/optseq/). Eight independent run versions were created and used to create counterbalanced versions of the task. For each version, cue location and cue valence were randomly determined. This task took approximately 30 minutes to complete with 1-minute breaks between runs.
Trials with incorrect behavioral responses (< 0.5% of all trials) were removed from analyses. Depression groups did not differ in number of removed incorrect responses (p = .75). Further, reaction times that were at least three standard deviations beyond an individual’s mean reaction time were also deleted (< 2%). Together, this resulted in the exclusion of less than 2.5% of the behavioral data.
fMRI Image Acquisition
All scanning was performed on a whole body 3T GE MRI scanner with an 8-channel phase array head coil. The scanning protocol involves collection of a localizer followed by a high-resolution structural scan and functional scanning. After 4 runs of functional scanning a second high resolution scan was obtained. The primary structural scans utilized 3D SPGR volume acquisitions with 1.4 mm thick sagital slices for a total of 134 slices (Flip=10 degrees, TR=9.7 ms, TE=4 ms, TI=20 ms, TD=0 ms, FOV=25 cm, Matrix=256X256, NEX=1). Functional images were acquired using a GRAPPA parallel imaging EPI sequence that reduces typical EPI distortions and susceptibility artifacts. Images were collected utilizing whole head coverage with slice orientation to reduce artifact (approx 20 degrees off the AC-PC plane and oriented for best whole head coverage, TR = 2000 ms, 2 shot, TE = 30 ms, 31 axial slices, voxel size = 3.125 × 3.125 × 3 mm with a .6 mm inter- slice gap). The first four EPI volumes are discarded to allow scans to reach equilibrium. Stimuli were presented utilizing a back projection screen located in the MR bore and viewed through a mirror mounted on the top of the head coil. Approximate visual angle for cue presentation is 16.5 degrees. Behavioral responses are collected with 2-button MR compatible optical transmission device that was held in the right hand. Head motion was minimized with foam inserts.
fMRI Data Analyses
Data were processed using FSL (Smith et al., 2004, and http://www.fmrib.ox.ac.uk/fsl/). For fMRI analysis, images were motion corrected, smoothed with a 6mm gaussian filter, high pass filtered and “prewhitened” before event-related responses were estimated using event-related convolution with an ideal hemodynamic response represented by a gamma function and its temporal derivative. Explanatory variables were modeled for each of the 4 cue stimuli conditions (shape, neutral faces, happy faces, and sad faces) across two cue validity conditions (valid and invalid) for a total of 8 conditions. Using a fixed effects model, a second-level analysis was conducted on each individual subject by registering each subject to the standard MNI template and combining the critical contrasts across the four runs. Random effects group-level maps of these contrasts were calculated with a higher order statistical parametric map utilizing the FLAME (FMRIB’s Local Analysis of Mixed Effects) technique implemented through FSL.
Whole brain omnibus contrast maps were generated from all participants collapsed across depression group and face stimuli type. These whole brain contrasts included the entire sample and therefore were not biased towards identifying between group differences. Two critical omnibus contrasts were performed. First, regions engaged to a greater degree when a face cue was valid were identified by contrasting all valid > invalid cue conditions. This contrast reveals the brain’s automatic response to the emotional cues. The second identified brain regions engaged to a greater degree when a face cue was invalid versus valid (i.e., invalid > valid). This contrast reflects brain regions needed to shift attention from an invalid emotion cue to the opposite visual location where the target appears. It thus measures cognitive control over emotional cue stimuli. Given that targets were counterbalanced across all conditions, the response to targets in these contrasts is subtracted out. Both contrasts were thresholded at p < .005 with a minimum 10 voxel extent (cf. Wager et al., 2008). A list of regions revealed by these contrasts, along with the maximal statistic and MNI location, are reported in Tables 1 and 2.
Table 1.
Regions, number of voxels, Z-MAX, and Montreal Neurological Institute (MNI) Coordinates engaged by contrasting all valid > invalid cue conditions (thresholded at p < .005 with a minimum of a 10 voxel extent). This contrast is intended to reflect automatic responses to emotional cues.
| MNI Coordinates | |||||
|---|---|---|---|---|---|
| Location (Broodman region) | Number of Voxels | Z-MAX | X | Y | Z |
| Bilateral - frontal pole (10) | 1508 | 3.64 | 20 | 40 | 38 |
| Bilateral - posterior cingulate (31) | 118 | 3.15 | 0 | −36 | 40 |
| Left - amygdala | 12 | 2.83 | −24 | 0 | −26 |
| Left - head of caudate | 13 | 2.75 | −16 | 22 | −2 |
| Left - hippocampus/parahippocampus | 36 | 2.99 | −32 | −18 | −22 |
| Left - lateral occipital (39) | 52 | 3.04 | −52 | −62 | 30 |
| Left - occipital lobe (18) | 132 | 4.15 | −12 | −104 | 8 |
| Left - occipital lobe (18) | 13 | 2.77 | −36 | −94 | 2 |
| Left - postcentral gyrus (3) | 26 | 2.97 | −32 | −28 | 62 |
| Left - posterior insular cortex (13) | 79 | 3.63 | −38 | −16 | 10 |
| Left - posterior parahippocampus | 16 | 3.44 | −18 | −38 | 0 |
| Left - posterior parahippocampus | 14 | 2.94 | −34 | −34 | −14 |
| Left - precuneous/posterior cingulate (31) | 84 | 2.87 | −4 | −62 | 24 |
| Left - superior parietal lobe (5) | 36 | 3.34 | −22 | −44 | 70 |
| Left - superior temporal gyrus (21) | 48 | 3.16 | −66 | −20 | −4 |
| Right - angular gyrus (39) | 43 | 3.04 | 50 | −58 | 38 |
| Right - anterior hippocampus | 18 | 3.19 | 26 | −12 | −24 |
| Right - inferior frontal gyrus (6) | 10 | 2.7 | 62 | 4 | 24 |
| Right - parietal operculum (13) | 23 | 2.87 | 36 | −24 | 20 |
| Right - postcentral gyrus (4) | 101 | 3.02 | 54 | −12 | 32 |
| Right - superior parietal (40) | 29 | 2.83 | 24 | −40 | 62 |
Table 2.
Regions, number of voxels, Z-MAX, and Montreal Neurological Institute (MNI) Coordinates engaged by contrasting all invalid > valid cue conditions (thresholded at p < .005 with a minimum of a 10 voxel extent). Probability value for the cue validity × depression group is presented in the last column. This contrast is intended to reflect cognitive control needed to shift attention from an invalid emotional cue to an opposite target location.
| Z-MAX MNI Coordinates | ||||||
|---|---|---|---|---|---|---|
| Location (Broodman region) | Number of Voxels | Z-MAX | X | Y | Z | CUE × GROUP |
| bilateral - Occipital lobe, lingual gyrus (18) | 4346 | 5.73 | 12 | −76 | −6 | p < .06 |
| Left - insula (13) | 10 | 2.86 | −32 | 20 | 4 | ns |
| Left - superior/middle frontal gyrus (6) | 108 | 3.5 | −24 | 6 | 48 | p < .05 |
| Right - inferior frontal gyrus (44) | 104 | 3.47 | 52 | 12 | 8 | p < .08 |
| Right - lateral occipital lobe (39) | 93 | 3.52 | 42 | −66 | 14 | p < .05 |
| Right - lateral occipital lobe (39) | 46 | 3.19 | 34 | −70 | 36 | p < .05 |
| Right - middle frontal gyrus (6) | 17 | 2.84 | 44 | 2 | 34 | p < .05 |
| Right - superior medial frontal gyrus (6) | 78 | 3.12 | 16 | 10 | 56 | ns |
| Right - supramarginal gyrus (40) | 90 | 3.36 | 50 | −34 | 42 | p < .005 |
To examine differences in brain response as a function of depressive symptoms, BOLD signal changes within ROIs revealed by omnibus contrasts were examined using repeated measures ANOVA. Average time course for each voxel and for each condition were computed for the ROIs and averaged utilizing a selective averaging technique (http://www.poldracklab.org/software). The result of this process is an average pseudo-percent signal change time course (with task mean and residuals removed) for each condition across each ROI. Average amplitude of the hemodynamic response across 2 and 4 second PSO time points was averaged for statistical testing.
Procedure
After completing a phone screen for general health and MR compatibility, suitable participants were scheduled for a scanning session. Upon arrival, participants were oriented to the center, the study was described, and informed consent was obtained. Participants then completed a demographics form, CESD, and other study questionnaires. Participants were oriented to the exogenous cueing task during a practice session outside of the MRI and then were placed in the magnet to complete the functional imaging protocol. Total time to complete the study was approximately 2 hours. Upon completion of study procedures, participants were debriefed and were paid $65 for their participation. The Internal Review Board at the University of Texas approved all study procedures.
Results
Behavioral results
We conducted a 3 (stimuli valence: sad, happy, neutral) × 2 (cue validity: valid, invalid) × 2 (depression group: LD, HD) repeated measures analysis of variance with reaction time to identify probe location as the dependent variable. There was a significant main effect of cue validity, F(1, 25) = 8.26, p = .01, partial η2 = .25. There was a trend towards the moderation of this cue validity effect by stimuli valence, F(2, 50) = 2.65, p = .09, partial η2 = .10. Post-hoc testing indicated that the interaction was driven by a significant cue validity effect for happy, t(27) = 3.32, p < .01, and sad face cues, t(27) = 2.94, p < .01. There was no significant cue validity effect for neutral face cues, t(27) = 1.78, p < .10. There was no main effect for depression group, F(1, 25) < 1, nor did depression group interact with stimuli valence or cue validity.
fMRI results
Automatic response to emotional cues (valid > invalid cues)
Since behavioral cue validity effects only occurred for emotional face cues (happy and sad), neural responses to these two conditions were averaged and queried for between group differences using a 2 (cue validity: valid, invalid) × 2 (depression group: LD, HD) repeated measures ANOVA. Although a number of brain regions were identified in the valid > invalid omnibus contrast (see Table 1), our analyses focused on regions previously associated with the experience of emotion, the amygdala and medial/orbital PFC.
Activation in the left amygdala revealed a marginally significant main effect of cue validity, F(1, 25) = 4.15, p < .06, partial η2 = .14, and no main effect or interaction with depression group (all Fs < 1). Similarly, activation in the medial/orbital PFC region also revealed a main effect of cue validity, F(1, 25) = 8.14, p < .01, partial η2 = .25, but no main effect or interaction for depression group (all Fs < 1). While these regions demonstrated significantly greater activation to valid relative to invalid emotional cues, this cue validity effect did not differ across depression groups (see Figure 2).
Figure 2.
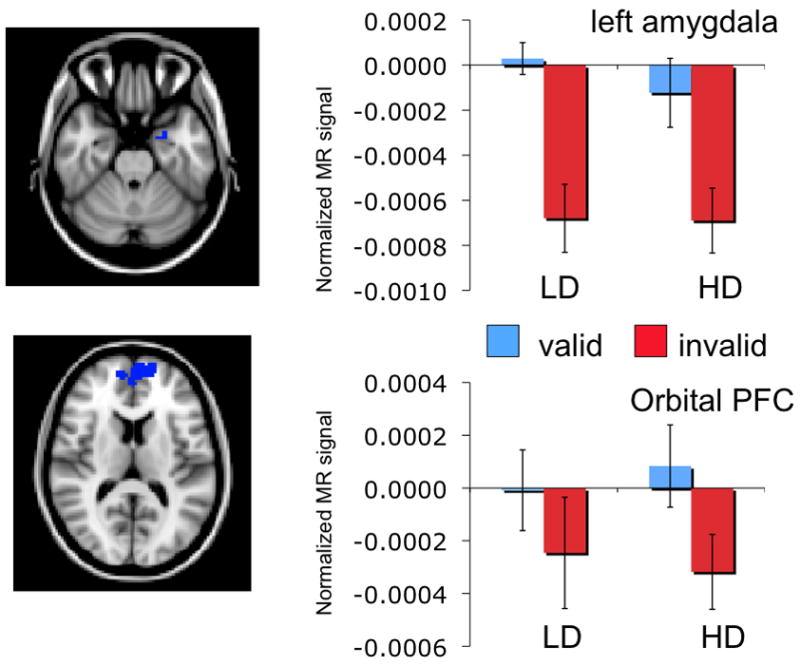
Activation patterns for left amygdala (top) and orbital/medial cortex (bottom). Although both regions demonstrated significantly greater activation to valid emotional cues relative to invalid cues, this effect did not differ across depression groups.
Cognitive control of automatic response to emotional stimuli (invalid > valid cues)
The omnibus contrast revealed a number of PFC regions with greater activation to invalid than valid cues. The majority of these regions demonstrated a significant interaction between cue validity and depression group (see last column of Table 2). Three regions in right lateral cortex are representative of the pattern of depression group differences.
Activation in the right superior parietal lobe had a main effect for cue validity, F(1, 25) = 13.77, p < .005, partial η2 = .36, that was moderated by depression group, F(1, 25) = 10.73, p < .005, partial η2 = .30. There was no main effect for depression group, F(1, 25) < 1. Among the LD group, invalid emotion cues elicited greater activation than valid emotion cues, t(12) = 4.08, p < .005. This effect was not evident for the HD group, t(13) < 1 (see Figure 3A). Interestingly, the cue validity effect was specific to emotional stimuli. The cue validity effect was not significant for either neutral face stimuli (all ts < 1) or shape stimuli in the LD or HD groups (all ts < 1.6).
Figure 3.
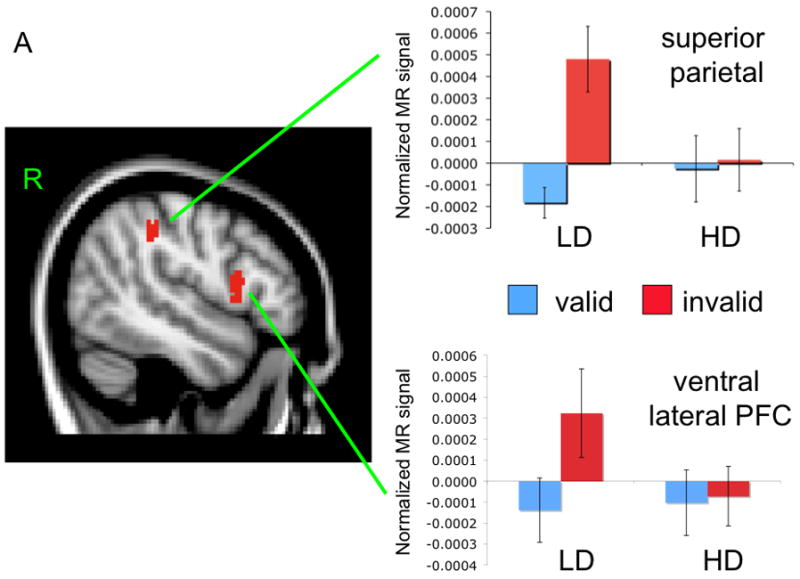
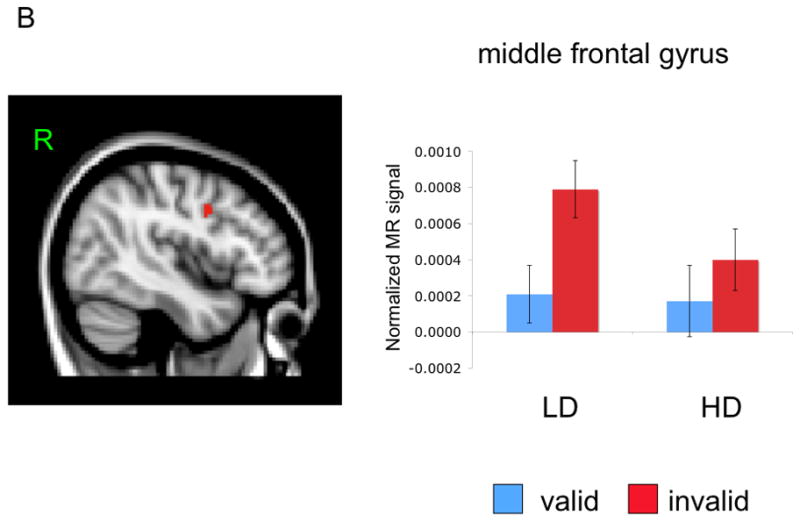
Mean activation and location of right superior parietal and inferior PFC regions (Panel A) and right middle frontal gyrus (Panel B).
Activation in the right inferior frontal gyrus also had a main effect for cue validity, F(1, 25) = 4.60, p < .05, partial η2 = .16, that was moderated by a marginally significant interaction with depression group, F(1, 25) = 3.53, p < .07, partial η2 = .12. There was no main effect of depression group, F(1, 25) < 1. As before, the LD group had a significantly greater response to invalid emotion cues than valid emotion cues, t(12) = 3.26, p < .01. This effect was absent in the HD group, t(13) < 1 (see Figure 3A). The cue validity effect for shape and neutral stimuli was non-significant for LD and HD groups (all ts < 1).
Activation in the right middle frontal gyrus had a main effect for cue validity, F(1, 25) = 24.09, p < .001, partial η2 = .49, that was also moderated by depression group, F(1, 25) = 4.54, p < .05, partial η2 = .15. There was no main effect of depression group, F(1, 25) < 1. Unlike responses in right parietal and inferior PFC, both groups demonstrated a greater response to invalid emotion cues than valid emotion cues (LD = t(12) = 3.98, p < .005, HD = t(12) = 2.74, p < .05; see Figure 3B). Cue validity was specific to emotional stimuli as it was not significant for either neutral face stimuli (all t < 1) or shape stimuli in LD and HD groups (all ts < 1).
Associations Between Neural Activation and Behavioral Responses
We examined associations between behavioral response and the same three areas of the right lateral cortex: right superior parietal lobe, right inferior frontal gyrus, and the right middle frontal gyrus. In order to test whether activity in these regions can account for behavior, a cue validity score was computed as the difference between invalid and valid cues for reaction time and neural activation. Difference scores were combined across happy and sad cue conditions, as no differences were observed between those cues in previous analyses.
For the right parietal and right inferior frontal regions there was no evidence of a significant Pearson correlation between behavioral and neural cue validity effects (right parietal, r = 0.22; right inferior PFC, r = 0.28, ps > .25). However, there was a significant correlation between behavioral and neural cue validity for the right middle frontal gyrus, r = 0.50, p < .01. Depression groups did not significantly differ on any of these correlations (all ps > .18; sample size would have to exceed 200 per group for the difference between correlations [.51 vs. .63] to reach statistical significance). Thus, although depression symptoms are associated with alterations in response across numerous brain regions involved in cognitive control, LD and HD individuals were able to effectively engage the middle frontal gyrus, a region that appears to be critical for behavioral responses on this task.
Discussion
This study examined behavioral and neural effects of mild to moderate depressive symptoms on cognitive control of emotion stimuli. Depressive symptoms did not alter behavioral responses to emotion cues. However, differential brain activation was observed between depression groups in a number of regions during trials that required cognitive control over emotion stimuli. For instance, vlPFC activation was lower for valid cues relative to invalid cues, presumably because cognitive control is not needed for valid cues. By contrast, regions of vlPFC were activated to a greater extent for invalid relative to valid cues in non-depressed participants, while depressed participants failed to show this difference. Further, this effect was exclusive to emotion cues, as shape and neutral face cues failed to elicit any depression group differences in these cognitive control regions. This suggests that individuals with mild to moderate levels of depression experience difficulty engaging neural regions that subserve cognitive control primarily for emotional information.
In contrast, activation in brain regions typically involved in emotional experience were not associated with depression symptoms. Left amygdala and orbital/medial PFC responses were greater for valid emotion cues relative to invalid cues but activity in these regions did not differ across depression groups. More severe forms of depression may be necessary before neural activity associated with the experience of emotion is altered (e.g., Hamilton & Gotlib, 2008; Siegle, Thompson, Carter, Steinhauer, & Thase, 2007). Poor cognitive control of emotional information may therefore be an important vulnerability that predates exaggerated medial PFC and limbic system responses to emotion stimuli. Longitudinal studies of populations at risk for MDD are needed to test this important hypothesis.
It was noteworthy that deficits in cognitive control of emotion cues among depressed individuals were observed at a neural level even though emotional content was incidental to the task. Cognitive control deficits were not observed when cues were non-emotional (e.g., circles, neutral faces) in either group, indicating depression effects were specific to positive and negative cues. Future work should examine the impact of depressive symptoms on cognitive control for tasks where emotional stimuli are the explicit focus (e.g., emotion regulation; Wager et al., 2008). The effect of depression on cognitive control could be particularly pronounced in those circumstances.
In sum, this study demonstrates that depressive symptoms are associated with impaired engagement of lateral PFC and parietal brain regions during cognitive control of emotional information. However, these findings should be considered preliminary, as additional research with larger samples of men and women are needed to confirm the present results. Further, we did not assess menstrual cycle phase and we performed a number of statistical tests in a relatively small sample. Nevertheless, this study suggests that cognitive control of emotion stimuli is altered among adult women with mild to moderate depressive symptoms. Longitudinal research is needed to determine whether deficits in cognitive control of emotional information are a cause or consequence of mild to moderate depression symptoms, and whether poor cognitive control of emotion cues predict future onset of MDD. If so, improving cognitive control may help to prevent the onset of MDD and potentially reduce suffering that is associated with this debilitating disorder.
Acknowledgments
Preparation of this article was facilitated by funding from the National Institute of Mental Health (R01MH076897) to Christopher Beevers and Army grant #W911NF-07-2-0023 to David Schnyer through The Center for Strategic and Innovative Technologies at The University of Texas at Austin.
Abbreviations
- fMRI
functional magnetic resonance imaging
- vlPFC
ventral lateral prefrontal cortex
- mPFC
medial prefrontal cortex
- MFG
middle frontal gyrus
- OFC
orbital frontal cortex
- IFG
inferior frontal gyrus
- CESD
Center for Epidemiologic Studies Depression scale
- LVF
left visual field
- RVF
right visual field
- GE
General Electric
- GRAPPA
Generalized auto-calibrating partially parallel acquisitions
- EPI
echo planar imaging
- HD
high depression
- LD
low depression
- ANOVA
analysis of variance
- FLAME
FMRIB’s Local Analysis of Mixed Effects
Footnotes
Publisher's Disclaimer: This is a PDF file of an unedited manuscript that has been accepted for publication. As a service to our customers we are providing this early version of the manuscript. The manuscript will undergo copyediting, typesetting, and review of the resulting proof before it is published in its final citable form. Please note that during the production process errors may be discovered which could affect the content, and all legal disclaimers that apply to the journal pertain.
References
- Aron AR, Poldrack RA. The cognitive neuroscience of response inhibition: Relevance for genetic research in Attention-Deficit/Hyperactivity Disorder. Biological Psychiatry. 2005;57:1285–1292. doi: 10.1016/j.biopsych.2004.10.026. [DOI] [PubMed] [Google Scholar]
- Dichter GS, Felder JN, Smoski MJ. Affective context interferes with cognitive control in unipolar depression: an fMRI investigation. Journal of Affective Disorders. 2009;114:131–142. doi: 10.1016/j.jad.2008.06.027. [DOI] [PMC free article] [PubMed] [Google Scholar]
- Dozois DJA, Dobson KS. Information processing and cognitive organization in unipolar depression: Specificity and comorbidity issues. Journal of Abnormal Psychology. 2001;110:236–246. doi: 10.1037//0021-843x.110.2.236. [DOI] [PubMed] [Google Scholar]
- Gotlib IH, Krasnoperova E, Yue DN, Joormann J. Attentional Biases for Negative Interpersonal Stimuli in Clinical Depression. Journal of Abnormal Psychology. 2004;113:127–135. doi: 10.1037/0021-843X.113.1.121. [DOI] [PubMed] [Google Scholar]
- Hamilton JP, Gotlib IH. Neural substrates of increased memory sensitivity for negative stimuli in major depression. Biological Psychiatry. 2008;63:1155–1162. doi: 10.1016/j.biopsych.2007.12.015. [DOI] [PMC free article] [PubMed] [Google Scholar]
- Kessler RC, Walters EE. Epidemiology of DSM-III-R major depression and minor depression among adolescents and young adults in the National Comorbidity Survey. Depress Anxiety. 1998;7:3–14. doi: 10.1002/(sici)1520-6394(1998)7:1<3::aid-da2>3.0.co;2-f. [DOI] [PubMed] [Google Scholar]
- Koster EHW, De Raedt R, Goeleven E, Franck E, Crombez G. Mood-congruent attentional bias in dysphoria: Maintained attention to and impaired disengagement from negative information. Emotion. 2005;5:446–455. doi: 10.1037/1528-3542.5.4.446. [DOI] [PubMed] [Google Scholar]
- Lewinsohn PM, Roberts RE, Seeley JR, Rohde P, Gotlib IH, Hops H. Adolescent psychopathology: II. Psychosocial risk factors for depression. Journal of Abnormal Psychology. 1994;103:302–315. doi: 10.1037//0021-843x.103.2.302. [DOI] [PubMed] [Google Scholar]
- Liotti M, Mayberg HS, McGinnis S, Brannan SL, Jerabek P. Unmasking disease-specific cerebral blood flow abnormalities: Mood challenge in patients with remitted uniploar depression. American Journal of Psychiatry. 2002;159:1830–1840. doi: 10.1176/appi.ajp.159.11.1830. [DOI] [PubMed] [Google Scholar]
- MacDonald AW, Cohen JD, Stenger VA, Carter CS. Dissociating the Role of the Dorsolateral Prefrontal and Anterior Cingulate Cortex in Cognitive Control. Science. 2000;288:1835–1838. doi: 10.1126/science.288.5472.1835. [DOI] [PubMed] [Google Scholar]
- Nee DE, Wager TD, Jonides J. Interference resolution: Insights from a meta-analysis of neuroimaging tasks. Cognitive Affective and Behavioral Neuroscience. 2007;7:1–17. doi: 10.3758/cabn.7.1.1. [DOI] [PubMed] [Google Scholar]
- Posner MI, Petersen SE. The Attention System of the Human Brain. Annual Review of Neuroscience. 1990;13:25–42. doi: 10.1146/annurev.ne.13.030190.000325. [DOI] [PubMed] [Google Scholar]
- Radloff LS. The CES-D Scale: A Self-Report Depression Scale for Research in the General Population. Applied Psychological Measurement. 1977;1:385–401. [Google Scholar]
- Santor DA, Coyne JC. Shortening the CES-D to improve its ability to detect cases of depression. Psychological Assessment. 1997;9:233. [Google Scholar]
- Seeley JR, Stice E, Rohde P. Screening for depression prevention: identifying adolescent girls at high risk for future depression. Journal of Abnormal Psychology. 2009;118:161–170. doi: 10.1037/a0014741. [DOI] [PMC free article] [PubMed] [Google Scholar]
- Siegle GJ, Thompson W, Carter CS, Steinhauer SR, Thase ME. Increased Amygdala and Decreased Dorsolateral Prefrontal BOLD Responses in Unipolar Depression: Related and Independent Features. Biological Psychiatry. 2007;61:198–209. doi: 10.1016/j.biopsych.2006.05.048. [DOI] [PubMed] [Google Scholar]
- Tottenham N, Tanaka JN, Leon AC, McCarry T, Nurse M, Hare TA, et al. The NimStim set of facial expressions: judgments from untrained research participants. Psychiatry Research. 2009;168:242–249. doi: 10.1016/j.psychres.2008.05.006. [DOI] [PMC free article] [PubMed] [Google Scholar]
- Wager TD, Davidson ML, Hughes BL, Lindquist MA, Ochsner KN. Prefrontal-subcortical pathways mediating successful emotion regulation. Neuron. 2008;59:1037–1050. doi: 10.1016/j.neuron.2008.09.006. [DOI] [PMC free article] [PubMed] [Google Scholar]
- Wang L, LaBar KS, Smoski M, Rosenthal MZ, Dolcos F, Lynch TR, et al. Prefrontal mechanisms for executive control over emotional distraction are altered in major depression. Psychiatry Res. 2008;163:143–155. doi: 10.1016/j.pscychresns.2007.10.004. [DOI] [PMC free article] [PubMed] [Google Scholar]
- Zimmerman M, Coryell W. The inventory to diagnose depression, lifetime version. Acta Psychiatrica Scandinavica. 1987;75:495–499. doi: 10.1111/j.1600-0447.1987.tb02824.x. [DOI] [PubMed] [Google Scholar]