Abstract
Chronic ethanol infusion resulted in greater serum ALT elevation, lipid accumulation, necroinflammation, and focal hepatic cell death in mice than rats. Mice exhibited a remarkable hyperhomocysteinemia but no increase was seen in rats. Similarly, a high methionine low folate diet (HMLF) induced less steatosis, serum ALT increase, and hyperhomocysteinemia in rats than in mice. Western blot analysis of betaine homocysteine methyltransferase (BHMT) expression showed that rats fed either ethanol or HMLF had significantly increased BHMT expression which did not occur in mice. Nuclear NFκB p65 was increased in mouse in response to alcohol feeding. The human BHMT promoter was repressed by homocysteine in mouse hepatocytes but not rat hepatocytes. BHMT induction was faster and greater in primary rat hepatocytes than mouse hepatocytes in response to exogenous homocysteine exposure. Mice fed ethanol i.g. exhibited an increase in GRP78 and IRE1 which was not seen in the rat and SREBP-1 was increased to a greater extent in mice than rats. Thus, rats are more resistant to ethanol induced steatosis, ER stress and hyperhomocysteinemia and this correlates with induction of BHMT in rats. These findings support the hypothesis that a critical factor in the pathogenesis of alcoholic liver injury is the enhanced ability of rat or impaired ability of mouse to up-regulate BHMT which prevents hyperhomocysteinemia, ER stress and liver injury.
Keywords: alcohol, homocysteine, fatty liver, BHMT expression, mouse and rat differences
INTRODUCTION
The sulfhydryl-containing amino acid homocysteine (Hcy) is an intermediate of normal methionine metabolism. Hcy has unique biochemical properties that can both support a wide range of molecular effects and promote oxidant stress. Elevated Hcy in the blood, a condition termed hyperhomocysteinemia (HHcy) is implicated in a variety of diseases including vascular, CNS, and liver disease [1–4]. Accumulating evidence links hyperhomocysteinemia to endoplasmic reticulum (ER) stress in diet models and in both knockout mice and humans with altered Hcy metabolism [5–6]. In all models of non-alcoholic hyperhomocysteinemia (5, 10-methylenetetrahydrofolate reductase (MTHFR) −/−, cystathionine β-synthase (CBS) +/−, high methionine/ low folate diet), hepatic steatosis and ER stress with variable necroinflammation and apoptosis are observed [7–11]. Our previous work has particularly linked hyperhomocysteinemia to alcoholic liver injury. The intragastric alcohol feeding exhibited a striking 5–10 fold increase in mouse plasma Hcy which was associated with ER stress response as indicated by altered expression of a set of ER stress markers such as molecular chaperone glucose regulated protein 78 (GRP78 or BiP), sterol regulatory element binding proteins (SREBPs) that regulate liver lipid synthesis, C/EBP-homologous protein (CHOP or GADD153) that mediates cell death [12–15].
The pathways for Hcy removal involve three choices: 1) conversion of Hcy to S-adenosylhomocysteine (SAH) by SAH hydrolase (which has bidirectional activity); 2) conversion of Hcy to cystathionine by CBS, ultimately leading to cysteine formation (transsulfuration); 3) the remethylation of Hcy to methionine for biosynthesis of S-adenosylmethionine (SAM) in a reaction catalyzed mostly in the liver by methionine adenosyltransferase 1a (MAT1a) [1, 16]. The remethylation pathway is carried out by methionine synthase (MS) (methyl THF is the methyl donor substrate) and betaine-homocysteine methyltransferase (BHMT) (betaine is the methyl donor substrate) [17–19]. MS is ubiquitous and BHMT is expressed exclusively in hepatocytes and renal cells. Under normal conditions about half of the Hcy produced in hepatocytes is remethylated with MS and BHMT contributing approximately equally [19]. Interestingly, BHMT has been a focus in this field of research because of its specificity of expression in the liver and because its substrate, betaine, is inexpensive and much more stable than SAM when consumed [20–22]. Betaine supplementation in mice with intragastric alcohol infusion abrogated alcohol-induced hyperhomocysteinemia and ER stress response in parallel with decreased ALT and ameliorated liver steatosis and apoptosis [12]. BHMT over-expression in HepG2 cells inhibited Hcy-induced ER stress response, lipid accumulation, and cell death [23]. Transgenic mice expressing human BHMT in organs peripheral to the liver are resistant to hyperhomocysteinemia and fatty liver induced by chronic alcohol infusion or a high methionine and low folate diet [24]. However, in an attempt to extend this study from mice to rats, we found a striking species difference between the induction of hyperhomocysteinemia in response of rats and mice to intragastric feeding of alcohol. Rats are relatively resistant, developing much more modest steatosis and injury than mice. The present paper documents the difference in response between species and explores potential mechanisms generating further evidence for the role Hcy and ER stress in the pathogenesis of alcoholic liver disease.
METHODS
Animal models
(1) Mice and rats with intragastric ethanol infusion
Male C57B6 mice from the Jackson Laboratory (Bar Harbor, Maine) and male Wistar rats from Harlan Laboratories (Indianapolis, Indiana) were used for the studies. The intragastric ethanol infusion model was described previously [12, 15, 25] and was performed in the Animal Core (USC-UCLA Research Center for Alcoholic Liver and Pancreatic Diseases). Total caloric intake derived from the diet and ethanol was set at 533 Cal/kg and the caloric percentages of ethanol, dietary carbohydrate (dextrose), protein (lactalbumin hydrolysate) and fat (corn oil) were 24.3%, 15.7%, 25%, and 35%, respectively. Adequate vitamin and salt mix were included at the recommended amounts by the Committee on Animal Nutrition of the National Research Council (AIN-76A, 4.42 g/L and 15.4 g/L, respectively, Dyets Inc, PA). The diet and ethanol/dextrose infusion rate for mice was 400 mL/kg body weight/day for 4 weeks and the rate for rats was 120 mL/kg body weight /day for 6 weeks. The rats and mice received different amount of alcohol based on metabolic rate and both received the same 568 Cal/kg/day [25]. Blood alcohol levels at the time point of sacrifice (1–2 hours after disconnection of the feeding catheters) were 240–280 mg/dL in mice and 220–300 mg/dL in rats.
(2) Mice and rats fed a high methionine and low folate diet
Mice and rats were fed orally a high methionine and low folate diet (TD 98272) or equal amount of control diet (TD 05552) from Harlan (Madison, WI) [24]. The high methionine low folate diet contained 2% (w/w) of L-methionine and 0.015% (w/w) of folate. Serum and liver tissue samples were taken for analysis after 10-week feeding. All the animals were treated in accordance with the Guide for Care and Use of Laboratory Animals (NIH, Bethesda, MD, Publication 86–23, 1985).
Histological staining
Detailed procedures for Hematoxylin and Eosin (H&E) and TUNEL staining were described previously [12, 13]. Briefly, at the time of sacrificing, small pieces of liver tissue were harvested and fixed immediately in 3% paraformaldehyde (Sigma) for 4 hours and then transferred to 80% ethanol. After paraffin embedding, 5-μm transverse sections were prepared and stained. Apoptotic hepatocytes were detected by the Cell & Tissue Imaging Core (USC Research Center for Liver Diseases) according to the TUNEL procedures with a TACS TdT Kit (R&D Systems, Inc.). Apoptosis were expressed as total TUNEL positive cells in five microscope fields at ×200 magnification.
In vitro studies with primary mouse and rat hepatocytes
The primary mouse and rat hepatocytes were provided by the Cell Culture Core (USC Research Center for Liver Diseases). The culturing of primary hepatocytes was described previously [13, 23]. The hepatocytes were treated with 0 to 5 mM of homocysteine for 0–24 hours. The intracellular concentrations achieved at 5 mM of exogenous homocysteine are similar to what is seen in vivo in hyperhomocysteinemia [23, 26]. In some experiments, the hepatocytes were pretreated with betaine (1 mM), SAMe (3 mM), or MTA (0.5 mM) 1 hour before the homocysteine treatments. The treated cells were either washed three times with cold 1x PBS and scratched off for extraction of DNA, RNA and proteins, or stained for cell death. The cells were doubly stained with Sytox green (1 μM; Molecular Probes, Eugene, OR) and Hoechst 33258 dye (8 μg/mL; Sigma) for 30 minutes at 37°C. Cell death (combination of necrosis and apoptosis) was counted according to a previously described method [13, 23].
Transfection and luciferase reporter assays
Primary mouse and rat hepatocytes plated on 6-well plates were transiently transfected with a luciferase reporter or a promoterless pGL3-basic vector using the Targetfect-hepatocyte Kit (Targeting System, Santee, CA). The luciferase reporter construct contained firefly luciferase gene which was under control of the promoter of human betaine-homocysteine methyltransferase (BHMT) [27]. The primary cells were co-transfected with the Renilla pRL-SV40 vector (Promega, Madison, WI, U.S.A.) to control the transfection efficiency. Homocysteine (5 mM) or betaine (1 mM) was added to the transfected cell culture 12 hours after the transfection. Twelve hours after homocysteine or betaine treatment, the cells were harvested and lysed in 200 μl of reporter lysis buffer (Luciferase Assay System, Promega). Aliquots of the cell lysates were dually assessed for firefly and Renilla luciferase activities using a TD-20/20 luminometer (Promega). The luciferase activity driven by the BHMT promoter was expressed as a ratio of firefly to Renilla.
Molecular and metabolite assays
(1) Western blot
Proteins were extracted according to the method previously reported [12, 23]. Proteins were routinely analyzed by immunoblotting using horseradish peroxidase-labeled or alkaline phosphatase-labeled second antibodies. Primary antibodies against SREBP1, IRE-1, MAT1&3, NFκB, GATA, C/EBPβ, COUP-TF1, HNF4α, IRF-1, IRF-2, CoxIV, and β-actin were purchased from Santa Cruz Biotechnology Inc. (Santa Cruz, CA). Antibodies against GRP78 (Bip) were purchased from Cell Signaling Technology (Danvers, MA). Anti-BHMT antibodies were self made and described previously [23, 24]. Proteins were visualized using LumiGLO Reagent (Cell Signaling) on CL-Xposure films (PIERCE, Rockford, IL, USA) at an optimized time point. The intensity of protein bands on the Western blots were quantified with the NIH software, ImageJ, after Western blots of protein samples were scanned into TIF file.
(2) Analysis of ALT, lipid, homocysteine, and betaine
Plasma ALT and homocysteine measurements and lipid extraction and analysis were described previously [12, 13, 24].
Plasma ALT and homocysteine measurements and lipid extraction and analysis were described previously [12, 24].
To measure hepatic homocysteine, hepatocytes (1.2 × 10⁶) were homogenized and incubated in 50 μl of 7, 7-Dimethylhept-2-ene-4-ynal (TBF) at 4°C for 30 minutes. The homogenate was mixed with 500 μl of Trichloroacetic Acid (TCA, 10%) and 1 mM EDTA, centrifuged at 100x g for 5 minutes. The resultant supernatant (100 μl) was mixed with 20 μl of 1.55M NaOH, 150 μl of 125 mM Sodium Borate and 4 mM EDTA (pH 9.5), and 100 μl of SBD-F solution containing 1 mg/ml Ammonium 7-Fluorobenzo-2-oxa-1,3-Diazole-4-Sulphonate and 125 mM Sodium Borate (pH 9.5). The mixture was incubated in a 60°C water bath for 1 hour and 10–100 μl of the mixture was injected into a column (C18 Axxi-Chrom 5 μ, 4.6 × 250 mm) for HPLC analysis by monitoring fluorescence (excitation at 385 nm and emission at 515 nm).
To measure betaine, 10 μl of the liver tissue or cell homogenate was mixed with 10 μl of KH2PO4, 90 μl of p-Bromophenacyl-8 Reagent (Pierce, Rockford, IL) and 90 μl of 90% Acetonitrile (ACN). The mixture was incubated at 80°C for 1 hour and then centrifuged at 20,800 g for 4 minutes. The resultant supernatant (25–100 μl) was injected into a column (Supelco LC-SCX 5 μ, 4.6 × 250 mm (Ion Exchange)) for HPLC analysis by detecting absorbance at 254 nm.
Homocysteine and betaine standards were injected into the corresponding HPLC columns for reference and quantitation.
Statistical analysis
Experiments were performed with 3–6 mice or rats per group with values presented as mean plus or minus SD. Primary hepatocyte culture experiments were performed on at least 3 separate preps with each condition assessed in triplicate. Comparisons between two groups were by t-test and multiple groups by ANOVA with correction for small sample size. A p value < 0.05 was considered significant.
RESULTS
1. Pathological differences between alcohol- or high methionine-fed mouse and rat
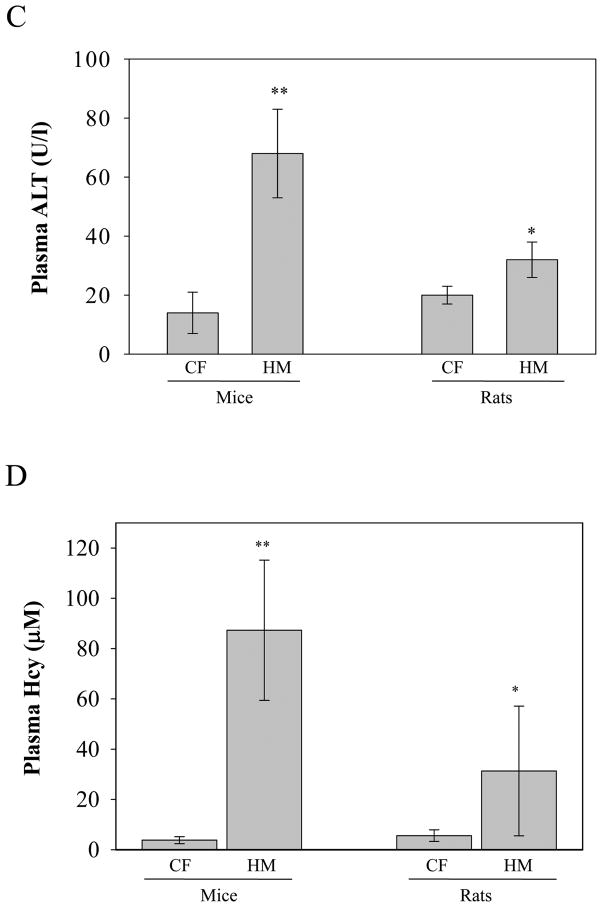
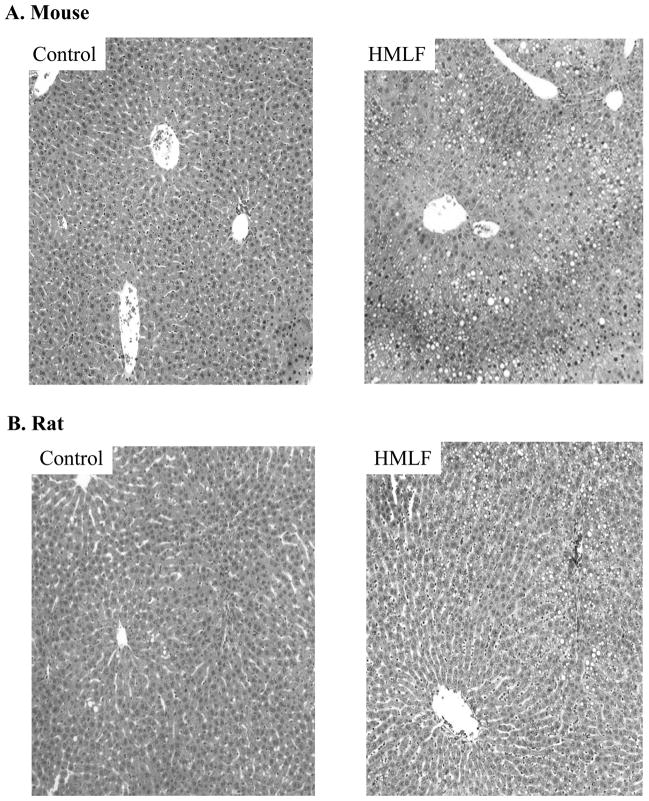
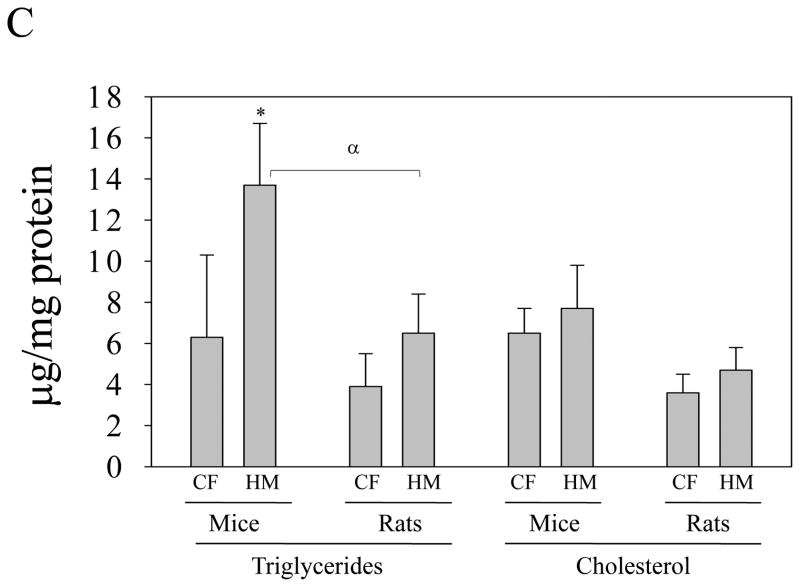
Chronic alcohol feeding increased plasma ALT by more than 10 fold in mice and by 2 fold in rats (Fig. 1A). Plasma homocysteine was increased by the alcohol feeding by 7 fold in mice but was not increased in rats (Fig. 1B). Chronic feeding of the high methionine diet increased plasma ALT by 5 fold in mice but by less than 1 fold in rats (Fig. 1C). Plasma homocysteine was increased by more than 20 fold in mice and by 8 fold in rats (Fig. 1D). The high methionine low folate diet feeding did not significantly reduce liver betaine levels in either mice (0.42±0.17 μmol/g liver tissue vs control of 0.71±0.2 μmol/g) or rats (1.3±0.5μmol/g liver vs control of 1.49±0.34μmol/g). Similar results (no significant changes) in liver betaine levels were detected in alcohol-fed mice (1.2±0.55μmol/g liver tissue vs control of 1.7±0.57 μmol/g) or alcohol-fed rats (2.1±0.36 μmol/g liver vs control of 2.4±0.5 μmol/g). Alcohol feeding induced fatty liver in both species. However, severity of alcohol-induced fatty liver was much greater in mice than in rats (Fig. 2). Liver triglycerides and cholesterol were increased by more than 4 fold in mice fed alcohol but by less than 2 fold in rats fed alcohol (Fig. 2C). Significant increase in liver lipids was detected in mice but not in rats in response to the chronic high methionine feeding (Fig. 3). In the model of intragastric alcohol feeding, foamy fatty changes, fat granuloma, focal hepatic necrosis, and apoptosis could be observed consistently in mice but not in rats (data not shown). The TUNEL positive liver cells in alcohol-fed mice (2.67±2.65/five microscope fields) was significantly higher than in pair-fed control (0.17±0.41/five microscope fields, P<0.05). No significant difference in the TUNEL positive liver cells was found in rats between pair-fed (0.25±0.5) and alcohol-fed (0.2±0.45).
Figure 1.
Plasma alanine aminotransferase (ALT) and homocysteine in mice versus rats fed alcohol intragastrically or fed a high methionine low folate diet (HMLF) orally. CF, pair-fed control; EtOH, fed alcohol; HM, fed HMLF; *, p<0.05; **, p<0.01, n = 6 mice or rats in EtOH fed group; n = 3–5 mice or rats in HMLF fed group.
Figure 2.
Fat accumulation in mice fed alcohol intragastrically compared to rats fed alcohol intragastrically. H&E staining (200×) of liver tissues from mice (Panel A) and from rats (Panel B). Panl C, liver triglycerides and cholesterol in mice and rats fed alcohol intragastrically. CF, pair-fed control; EtOH, fed alcohol; *, p<0.05; **, p<0.01, compared between CF and EtOH; α, p<0.05 compared between mice and rats, n = 6.
Figure 3.
Fat accumulation in mice fed a high methionine low folate diet (HMLF) orally compared to rats fed HMLF orally. H&E staining (200×) of liver tissues from mice (Panel A) and from rats (Panel B). Panel C, liver triglycerides and cholesterol in mice and rats fed HMLF. CF, pair-fed control; HM, fed HMLF; *, p<0.05, compared between CF and HM; α, p<0.05 compared between mice and rats, n = 3–5.
2. Different expression of BHMT and selective ER stress markers and transcription factors in mouse and rat
Previously we demonstrated that BHMT played an important role in alcohol-induced hyperhomocysteinemia, ER stress and liver injury [12, 23, 24]. To know whether it is associated with the pathological differences between mouse and rat, we examined BHMT expression in the liver of these animals. Consistent with our previous findings, no significant changes in BHMT protein levels were detected in mice fed alcohol or the high methionine diet (Fig. 4). In contrast, BHMT expression was increased in rats in response to either chronic alcohol or the high methionine diet feeding. Corresponding to this, selective ER stress markers including GRP78, IRE1, and activated SREBP1c were either not or slightly increased in rats whereas all the ER stress markers were significantly increased in alcohol-fed mice (Fig. 4C&D).
Figure 4.
Expression of betaine-homocysteine methyltransferase (BHMT) and selective ER stress markers in the livers of mice versus rats fed alcohol intragastrically or fed a high methionine low folate diet (HMLF) orally. Panel A, Western blots of BHMT; Panel B, relative BHMT protein expression normalized to β-actin; Panel C, Western blots of ER markers; Panel D, relative levels of ER markers normalized to β-actin; CF, pair-fed control; E or EtOH, fed alcohol; H or HM, fed HMLF; GRP78, glucose regulated protein 78; SREBP1, sterol regulatory element binding protein 1; IRE1, the type I transmembrane protein kinase endoribonucleases. *, p<0.05; **, p<0.01 compared between CF and EtOH, or between CF and HM; α, p<0.05 compared between mice and rats; n = 3
Although our results show no increase in BHMT in ethanol fed mice at 4 weeks, to be sure we did not miss a transient early induction, we examined BHMT expression after 1 week intragastric alcohol feeding by western blots normalized to actin and found no significant difference (Fig. S1). Furthermore, we previously reported that BHMT mRNA and activity were not increased after two or more weeks of ethanol feeding [13].
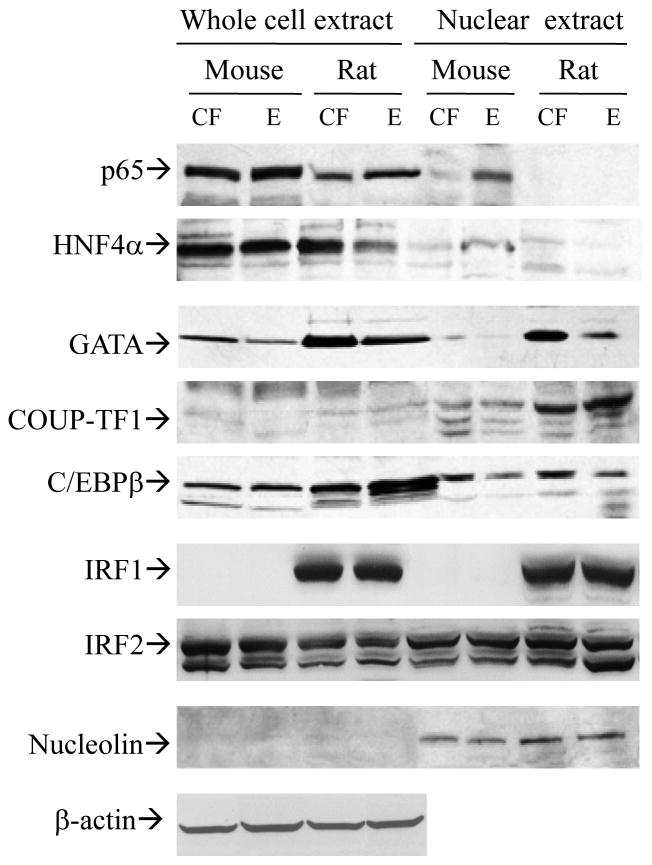
The rat and mouse promoters share 65% homology and examination of the sequences in the promoter reveals some transcription factor consensus binding sites which are either present in both species (NFκB, GATA, COUP-TF, HNF4α) or present in rat but not mouse promoter (e.g. C/EBP, IRF-1, IRF-2). Expression of these transcription factors were examined in mouse and rat in response to chronic alcohol versus pair feeding (Fig. 5). Increase of nuclear NFκB was detected in mouse but not rat fed alcohol. Nuclear HNF4α and GATA1 were decreased in alcohol fed rat but not mouse. No change was detected in the expression of COUP-TF1, C/EBPβ, IRF1, and IRF2 in either mouse or rat fed alcohol.
Figure 5.
Expression of transcription factors in the livers of mice versus rats fed alcohol intragastrically. CF, pair-fed control; E, fed alcohol; NFκB, nuclear factor κB; HNF4, hepatic nuclear factor 4; GATA, factor binding the WGATAR consensus sequence; C/EBPβ, CCAAT-enhanced binding proteins; COUP-TF1, one of the orphan members of the steroid hormone receptor family; IRF1&2, interferon regulatory factor 1&2; β-actin, for normalization of proteins in the whole protein extracts. Nucleolin, eukaryotic nuclear phosphoprotein used as a marker for nuclear extracts.
3. Comparison of response in primary mouse and rat hepatocytes
(1) Activities of human BHMT promoter
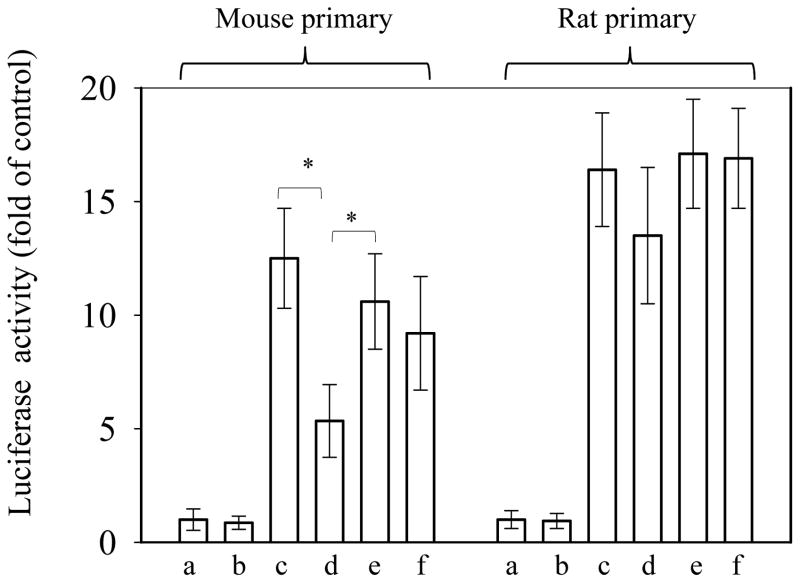
The luciferase expression driven by the human BHMT promoter was detected in both mouse and rat primary hepatocytes after a transient transfection of the BHMT luciferase reporter construct (Fig. 6). In mouse primary hepatocytes, the human BHMT promoter activities were inhibited by more than 50% after treatment of homocysteine which was recovered in the presence of betaine. In comparison, neither homocysteine nor betaine treatment exerted significant effects on the promoter activities in primary rat hepatocytes.
Figure 6.
Activities of human BHMT promoter in mouse versus rat primary hepatocytes. (A), the promoter activities were reported by Luciferase activities which were expressed as ratios of firefly to renilla. Renilla gene was under control of SV40 promoter and was co-transfected. (a), control, transfected with promoterless firefly construct; (b), transfected with promoterless firefly construct and treated with homocysteine (5 mM); (c), transfected with firefly construct under control of hBHMT promoter, (d), transfected with firefly construct under control of hBHMT promoter treated with homocysteine (5 mM); (e), transfected with firefly construct under control of hBHMT promoter treated with betaine (1 mM); (f) transfected with firefly construct under control of hBHMT promoter in the presence of homocysteine and betaine; Fold of change is compared to (a). *P<0.05 compared between (c) and (d) or (d) and (e), n=3. Cells were treated for 16 hr.
(2) Effects of homocysteine on cell death and BHMT expression
Homocysteine treatment induced cell death detected by Sytox green staining in both primary mouse and rat hepatocytes. There were small differences between species in the cell death rate at low concentration range of homocysteine (less than 5 mM) (Fig. 7). The species differences of the cell death rate became larger as the homocysteine concentration increased (greater than 5 mM). At 10 mM, the cell death rate was nearly 40% in mouse hepatocytes whereas the cell death rate was less than 20% in rat hepatocytes.
Figure 7.
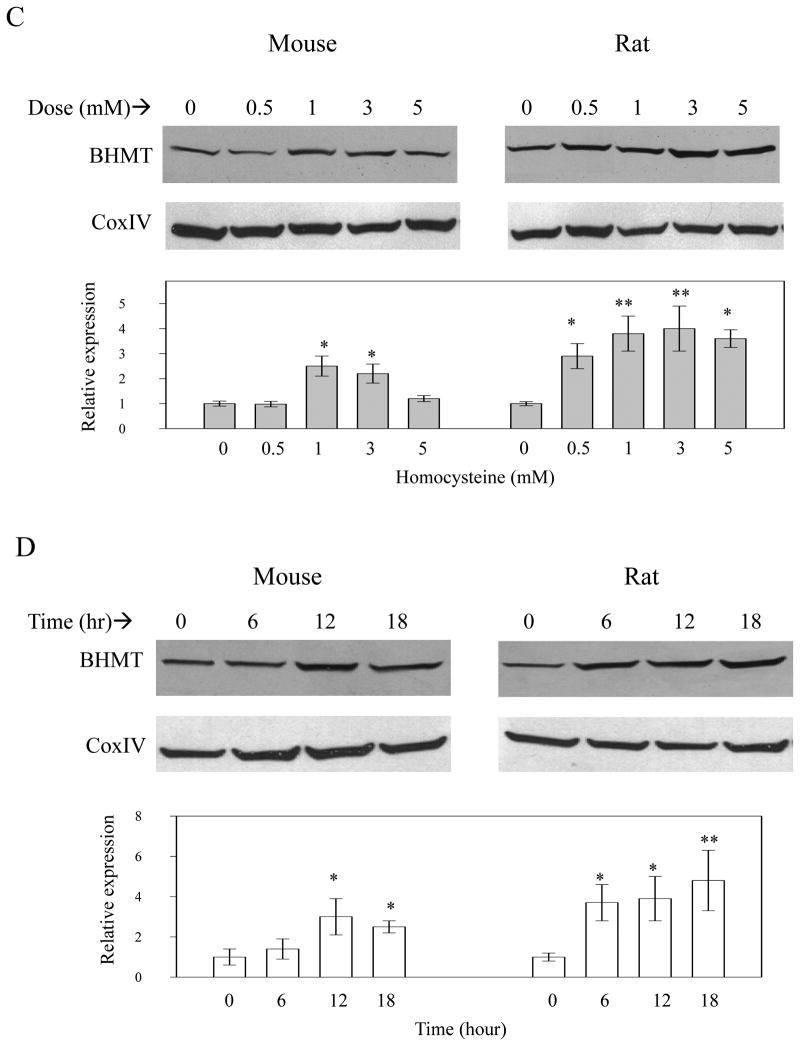
Effects of homocysteine on cell death and BHMT expression in mouse versus rat primary hepatocytes. Panel A, homocysteine-induced cell death in primary mouse hepatocytes; Panel B, homocysteine-induced cell death in primary rat hepatocytes; Panel C, dose response of BHMT expression to homocysteine exposure for 12 hours; D, time course of BHMT expression in response to homocysteine; Graphs depict relative protein expression of BHMT normalized to CoxIV. *P<0.05; **p<0.001 compared to zero hour or zero concentration, n=3.
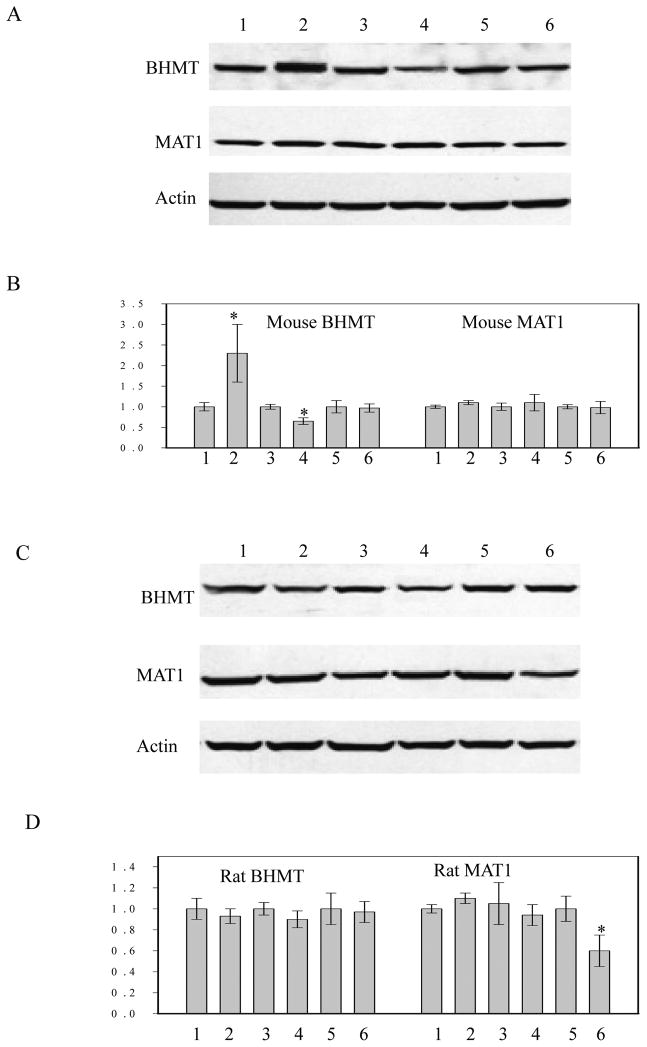
To further define the different BHMT expression, dose response and time course in response to homocysteine treatment were conducted. BHMT expression in mouse hepatocytes was increased by homocysteine at 1 mM and the induction was decreased at 5 mM (Fig. 7C). In comparison, BHMT expression started to rise at 0.5 mM and the induction remained from 0.5 through 5 mM. Treatment with 5 mM homocysteine increased BHMT expression in mouse hepatocytes at 12 hour and the induction became minimal at 18 hour (Fig. 7C&D). In contrast, the same homocysteine treatment increased BHMT expression in rat hepatocytes as early as 6 hour and the induction lasted until 18 hour. The results suggest that rat hepatocytes are more resistant than mouse hepatocytes to prolonged and high concentration of homocysteine exposure. In contrast to greater homocysteine-induced expression of BHMT in rat hepatocytes, betaine induced BHMT only in mouse hepatocytes (Fig. 8). There was a small decrease in BHMT in mouse but not rat hepatocytes treated with SAM, consistent with studies by others [27] on hBHMT promoter in HepG2 cells. However, under these conditions MTA has no effect. In mouse hepatocytes, Mat1 expression was not affected by betaine, SAM, or MTA treatment (Fig. 8) and was not affected by homocysteine treatment (not shown).
Figure 8.
Effects of betaine, S-adenosylmethionine (SAM) and methylthioadenosine (MTA) on BHMT and adenosyltransferase (MAT1) expression in mouse versus rat primary hepatocytes. Panel A, protein expression in primary mouse hepatocytes; Panel B, relative protein expression in primary mouse hepatocytes; Panel C, protein expression in primary rat hepatocytes; Panel D, relative protein expression in primary rat hepatocytes; 1, PBS: phosphate buffered saline; 2, betaine (1 mM); 3, PBS: phosphate buffered saline; 4, SAM (3 mM); 5, DMSO, dimethyl sulfoxide (1%, w/w); 6, MTA (0.5 mM); Cells were treated for 24 hours; *P<0.05, n=3.
DISCUSSION
Chronic ethanol feeding resulted in greater serum ALT elevation, lipid accumulation, necroinflammation, and focal hepatic cell death in mice than rats. Mice exhibited a striking hyperhomocysteinemia but no increase was seen in rats. Similarly, the high methionine low folate diet (HMLF) induced less steatosis, serum ALT increase, and hyperhomocysteinemia in rats than in mice. Western blot analysis of BHMT expression showed that rats fed either ethanol or HMLF increased BHMT expression which did not occur in mice. Although an in vivo time course study of Hcy levels is needed to exclude the possibility that an early increase in Hcy in rats fed alcohol or HMLF may be followed by induction of BHMT with subsequent lowering of Hcy, a species difference firmly exists in the response of BHMT. One question could be whether the difference in amount of ethanol given to mice versus rats (twice on per kg per day basis), which is based on higher metabolic rate in mice, is responsible for the more severe alcoholic steatohepatitis in mice. We believe this is unlikely because there was no difference between the two species in the blood alcohol levels at the time point of sacrifice. In addition, the findings with the HMLF feeding model show that resistance of the rat to hyperhomocysteinemia and steatohepatitis was independent of alcohol [24]. Precisely what alcohol and HMLF have in common to affect BHMT is not certain but seems likely to be related to the effect of both on Hcy metabolism. Mice fed ethanol i.g. exhibited an increase in GRP78 and IRE1 which was not seen or blunted in the rat and SREBP-1 was increased to a greater extent in mice than rats. Thus, rats are more resistant to ethanol and HMLF induced steatosis, ER stress and hyperhomocysteinemia and this correlates with induction of BHMT in rats. These findings support the hypothesis that a key factor in the pathogenesis of alcoholic liver injury is the enhanced ability of rat or impaired ability of mouse to up-regulate BHMT.
Since BHMT expression was increased in vivo in alcohol and HMLF fed rats but not in mice, we examined differences in nuclear extracts for potential transcriptional regulators predicted to interact with the BHMT promoter. Increased nuclear NFκB (p65) was found in mice and decreased HNF4α was found in rats fed alcohol. The theoretical possibility of decreased repression by diminished HNFα will require further study. However, the difference in p65 is potentially relevant since NFκB has been shown to repress the human BHMT promoter. Thus, one possibility is that alcohol leads to TNF or oxidative stress-induced activation of NFκB in hepatocytes in the mouse which inhibits an adaptive response (BHMT induction) to homocysteine accumulation. More work will be needed to address this possibility and to see if the NFκB is the cause of the BHMT repression in mice or is simply a reflection of more severe injury.
Although a difference in NFκB activity might contribute to blocking BHMT induction, we examined alternative possibilities which might help to explain the species difference. First, we utilized the human BHMT reporter transfected into mouse and rat hepatocytes. The reporter activity was repressed by homocysteine in the mouse cells but not the rat cells. The repression by homocysteine was inhibited by concomitant exposure to betaine. These indicate that homocysteine either directly or indirectly represses the promoter because of a trans-effect independent of any species difference in the promoter itself, in this case the human promoter, so the repression of BHMT expression by homocysteine is context-dependent. Our previous work showed no increase in NFκB activation in homocysteine treated mouse hepatocytes so other mechanisms or responses of mouse hepatocytes to homocysteine which account for this repression of BHMT remain to be identified.
Aside from some factor repressing or preventing induction of BHMT in mouse liver, the induction in rat liver is a distinct issue. We therefore examined induction of BHMT by homocysteine in primary mouse and rat hepatocytes. A species difference was confirmed. Although some induction occurred in mouse hepatocytes it was of lesser magnitude. Thus, rat hepatocytes exhibited induction of BHMT at lower concentrations of homocysteine and after shorten exposure. Clearly, both the human BHMT response and primary hepatocytes experiment support the in vivo observations showing resistance of rats to hyperhomocysteinemia coupled with induction of BHMT; however, caution is required in extrapolating the in vitro experiments to the in vivo situation as the homocysteine exposures in vitro are of short duration and at high levels. Nevertheless, the data provide support for the hypothesis that a species difference in the regulation of BHMT exists and may be an important determinant of susceptibility to steatohepatitis. The role of cis- vesus trans-effects on the BHMT promoter and the various possible trans-effects in mice and rats need further exploration.
Another aspect of BHMT regulation is that its expression can be induced by exogenous betaine. We exposed hepatocytes to 1 mM betaine and observed induction in mouse cells but not rat cells. We did not observe induction by betaine with the human BHMT reporter which might suggest that the induciblity of mouse BHMT by betaine is an intrinsic or cis-effect of the promoter. Again, a species difference is observed and the induction of BHMT by betaine feeding in the mouse may contribute to the protection afforded by betaine. Also of note, hepatic betaine levels were in the mM range in mice and rats and not significantly decreased by feeding alcohol or HMLF diet. Since the Km of BHMT for betaine is ~50 uM [28–30], the enzyme is saturated under these conditions so the change in BHMT levels (i.e. Vmax) is the major reason for lowering Hcy and there is no limitation on the availability of betaine. Furthermore, these results suggest that the efficacy of feeding betaine in the mouse is due to induction of BHMT and not simply due to provision of more methyl-donor.
In summary, rats are more resistant to hyperhomocysteinemia, ER stress and steatohepatitis in response to alcohol or HMLF feeding. Induction of BHMT in the rat correlates with this response and could be an important determinant of resistance of the rat. The regulation of BHMT requires further exploration of the mechanisms for homocysteine induced repression and/or inhibition of induction in mouse hepatocytes as well as induction in rat hepatocytes. In addition, the extent to which BHMT exerts its protective effect by lowering homocysteine versus increasing SAM and/or decreasing SAH require more investigation. Irrespective, induction of BHMT appears to be a key protective response.
Supplementary Material
Effects of 1 week alcohol versus pair feeding on expression of betaine homocysteine methyltransferase (BHMT) in mouse liver: C, pair-fed control (4 animals); E, alcohol-fed (4 animals); Panel A, Western blot of BHMT and actin loading control; Panel B, quantitation of BHMT expression in the liver. The intensity of BHMT protein bands on the Western blots were quantified with the NIH software, ImageJ, after Western blots of protein samples were scanned into TIF file.
Acknowledgments
This research was supported in part by the National Institute of Alcohol Abuse and Alcoholism R01AA014428, R01AA018846 and P50AA11999 and by the National Institute of Diabetes and Digestive and Kidney Diseases P30DK048522. Dr. Shinohara is a postdoctoral researcher in Drs. Ji and NK’s laboratories. We thank Dr. SC. Lu, Mr. J. Kuhlenkamp, and Dr. M. Ookhtens for helpful discussion and technical assistance.
LIST OF ABBREVIATIONS
- BHMT
betaine-homocysteine methyltransferase
- C/EBPβ
CCAAT-enhance-binding proteins β
- ER
endoplasmic reticulum
- GRP78
glucose-regulated protein 78
- Hcy
homocysteine
- HNF4α
hepatic nuclear factor 4α
- IFR
interferon regulatory factor
- IRE
inositol requiring enzyme
- NF-κB
nuclear factor κB
- SAH
S-adenosylhomocysteine
- SAM
S-adenosylmethionine
- SREBP
sterol regulatory element binding protein
References
- 1.Finkelstein JD. Methionine metabolism in liver diseases. Am J Clin Nutr. 2003;77(5):1094–5. doi: 10.1093/ajcn/77.5.1094. [DOI] [PubMed] [Google Scholar]
- 2.Refsum H, Ueland PM, Nygard O, Vollset SE. Homocysteine and cardiovascular disease. Annu Rev Med. 1998;49:31–62. doi: 10.1146/annurev.med.49.1.31. Review. [DOI] [PubMed] [Google Scholar]
- 3.Troen AM. The central nervous system in animal models of hyperhomocysteinemia. Prog Neuropsychopharmacol Biol Psychiatry. 2005;29(7):1140–51. doi: 10.1016/j.pnpbp.2005.06.025. Review. [DOI] [PubMed] [Google Scholar]
- 4.Ji C, Kaplowitz N. Hyperhomocysteinemia, endoplasmic reticulum stress, and alcoholic liver injury. World J Gastroenterol. 2004;10(12):1699–708. doi: 10.3748/wjg.v10.i12.1699. Review. [DOI] [PMC free article] [PubMed] [Google Scholar]
- 5.Kaplowitz N, Than TA, Shinohara M, Ji C. Endoplasmic reticulum stress and liver injury. Semin Liver Dis. 2007;27(4):367–77. doi: 10.1055/s-2007-991513. Review. [DOI] [PubMed] [Google Scholar]
- 6.Basseri S, Austin RC. ER stress and lipogenesis: a slippery slope toward hepatic steatosis. Dev Cell. 2008;15(6):795–6. doi: 10.1016/j.devcel.2008.11.013. [DOI] [PubMed] [Google Scholar]
- 7.Oyadomari S, Harding HP, Zhang Y, Oyadomari M, Ron D. Dephosphorylation of translation initiation factor 2alpha enhances glucose tolerance and attenuates hepatosteatosis in mice. Cell Metab. 2008;7(6):520–32. doi: 10.1016/j.cmet.2008.04.011. [DOI] [PMC free article] [PubMed] [Google Scholar]
- 8.Lee AH, Scapa EF, Cohen DE, Glimcher LH. Regulation of hepatic lipogenesis by the transcription factor XBP1. Science. 2008;320(5882):1492–6. doi: 10.1126/science.1158042. [DOI] [PMC free article] [PubMed] [Google Scholar]
- 9.Hamelet J, Demuth K, Paul JL, Delabar JM, Janel N. Hyperhomocysteinemia due to cystathionine beta synthase deficiency induces dysregulation of genes involved in hepatic lipid homeostasis in mice. J Hepatol. 2007;46(1):151–9. doi: 10.1016/j.jhep.2006.07.028. [DOI] [PubMed] [Google Scholar]
- 10.Watanabe M, Osada J, Aratani Y, Kluckman K, Reddick R, Malinow MR, Maeda N. Mice deficient in cystathionine beta-synthase: animal models for mild and severe homocyst(e)inemia. Proc Natl Acad Sci U S A. 1995;92(5):1585–9. doi: 10.1073/pnas.92.5.1585. [DOI] [PMC free article] [PubMed] [Google Scholar]
- 11.Chen Z, Karaplis AC, Ackerman SL, Pogribny IP, Melnyk S, Lussier-Cacan S, Chen MF, Pai A, John SW, Smith RS, Bottiglieri T, Bagley P, Selhub J, Rudnicki MA, James SJ, Rozen R. Mice deficient in methylenetetrahydrofolate reductase exhibit hyperhomocysteinemia and decreased methylation capacity, with neuropathology and aortic lipid deposition. Hum Mol Genet. 2001;10(5):433–43. doi: 10.1093/hmg/10.5.433. [DOI] [PubMed] [Google Scholar]
- 12.Ji C, Kaplowitz N. Betaine decreases hyperhomocysteinemia, endoplasmic reticulum stress, and liver injury in alcohol-fed mice. Gastroenterology. 2003;124(5):1488–99. doi: 10.1016/s0016-5085(03)00276-2. [DOI] [PubMed] [Google Scholar]
- 13.Ji C, Deng Q, Kaplowitz N. Role of TNF-alpha in ethanol-induced hyperhomocysteinemia and murine alcoholic liver injury. Hepatology. 2004;40(2):442–51. doi: 10.1002/hep.20309. [DOI] [PubMed] [Google Scholar]
- 14.Ji C, Mehrian-Shai R, Chan C, Hsu YH, Kaplowitz N. Role of CHOP in hepatic apoptosis in the murine model of intragastric ethanol feeding. Alcohol Clin Exp Res. 2005;29(8):1496–503. doi: 10.1097/01.alc.0000174691.03751.11. [DOI] [PMC free article] [PubMed] [Google Scholar]
- 15.Ji C, Chan C, Kaplowitz N. Predominant role of sterol response element binding proteins (SREBP) lipogenic pathways in hepatic steatosis in the murine intragastric ethanol feeding model. J Hepatol. 2006;45(5):717–24. doi: 10.1016/j.jhep.2006.05.009. [DOI] [PubMed] [Google Scholar]
- 16.Mato JM, Martinez-Chantar ML, Lu SC. Methionine metabolism and liver disease. Annu Rev Nutr. 2008;28:273–93. doi: 10.1146/annurev.nutr.28.061807.155438. Review. [DOI] [PubMed] [Google Scholar]
- 17.Finkelstein JD. Pathways and regulation of homocysteine metabolism in mammals. Semin Thromb Hemost. 2000;26(3):219–25. doi: 10.1055/s-2000-8466. [DOI] [PubMed] [Google Scholar]
- 18.Finkelstein JD. Homocysteine: a history in progress. Nutr Rev. 2000;58(7):193–204. doi: 10.1111/j.1753-4887.2000.tb01862.x. [DOI] [PubMed] [Google Scholar]
- 19.Finkelstein JD, Martin JJ. Methionine metabolism in mammals. Distribution of homocysteine between competing pathways. J Biol Chem. 1984;259(15):9508–13. [PubMed] [Google Scholar]
- 20.Ji C. Dissection of endoplasmic reticulum stress signaling in alcoholic and non-alcoholic liver injury. J Gastroenterol Hepatol. 2008;23 (Suppl 1):S16–24. doi: 10.1111/j.1440-1746.2007.05276.x. [DOI] [PMC free article] [PubMed] [Google Scholar]
- 21.Barak AJ, Kemmy RJ, Tuma DJ. The effect of methotrexate on homocysteine methylating agents in rat liver. Drug Nutr Interact. 1982;1(4):303–6. [PubMed] [Google Scholar]
- 22.Barak AJ, Beckenhauer HC, Tuma DJ. Hepatic transmethylation and blood alcohol levels. Alcohol Alcohol. 1991;26(2):125–8. doi: 10.1093/oxfordjournals.alcalc.a045092. [DOI] [PubMed] [Google Scholar]
- 23.Ji C, Shinohara M, Kuhlenkamp J, Chan C, Kaplowitz N. Mechanisms of protection by the betaine-homocysteine methyltransferase/betaine system in HepG2 cells and primary mouse hepatocytes. Hepatology. 2007;46(5):1586–96. doi: 10.1002/hep.21854. [DOI] [PMC free article] [PubMed] [Google Scholar]
- 24.Ji C, Shinohara M, Vance D, Than TA, Ookhtens M, Chan C, Kaplowitz N. Effect of transgenic extrahepatic expression of betaine-homocysteine methyltransferase on alcohol or homocysteine-induced fatty liver. Alcohol Clin Exp Res. 2008;32(6):1049–58. doi: 10.1111/j.1530-0277.2008.00666.x. [DOI] [PMC free article] [PubMed] [Google Scholar]
- 25.Tsukamoto H, Mkrtchyan H, Dynnyk A. Intragastric ethanol infusion model in rodents. Methods Mol Biol. 2008;447:33–48. doi: 10.1007/978-1-59745-242-7_3. [DOI] [PubMed] [Google Scholar]
- 26.Werstuck GH, Lentz SR, Dayal S, Hossain GS, Sood SK, Shi YY, Zhou J, Maeda N, Krisans SK, Malinow MR, Austin RC. Homocysteine-induced endoplasmic reticulum stress causes dysregulation of the cholesterol and triglyceride biosynthetic pathways. J Clin Invest. 2001;107(10):1263–73. doi: 10.1172/JCI11596. [DOI] [PMC free article] [PubMed] [Google Scholar]
- 27.Ou X, Yang H, Ramani K, Ara AI, Chen H, Mato JM, Lu SC. Inhibition of human betaine-homocysteine methyltransferase expression by S-adenosylmethionine and methylthioadenosine. Biochem J. 2007;401(1):87–96. doi: 10.1042/BJ20061119. [DOI] [PMC free article] [PubMed] [Google Scholar]
- 28.Finkelstein JD, Harris BJ, Kyle WE. Methionine metabolism in mammals: kinetic study of betaine-homocysteine methyltransferase. Arch Biochem Biophys. 1972;153(1):320–4. doi: 10.1016/0003-9861(72)90451-1. [DOI] [PubMed] [Google Scholar]
- 29.Chern MK, Gage DA, Pietruszko R. Betaine aldehyde, betaine, and choline levels in rat livers during ethanol metabolism. Biochem Pharmacol. 2000;60(11):1629–37. doi: 10.1016/s0006-2952(00)00469-x. [DOI] [PubMed] [Google Scholar]
- 30.Finkelstein JD. Inborn errors of sulfur-containing amino acid metabolism. J Nutr. 2006;136(6 Suppl):1750S–1754S. doi: 10.1093/jn/136.6.1750S. [DOI] [PubMed] [Google Scholar]
Associated Data
This section collects any data citations, data availability statements, or supplementary materials included in this article.
Supplementary Materials
Effects of 1 week alcohol versus pair feeding on expression of betaine homocysteine methyltransferase (BHMT) in mouse liver: C, pair-fed control (4 animals); E, alcohol-fed (4 animals); Panel A, Western blot of BHMT and actin loading control; Panel B, quantitation of BHMT expression in the liver. The intensity of BHMT protein bands on the Western blots were quantified with the NIH software, ImageJ, after Western blots of protein samples were scanned into TIF file.


