Abstract
Transcription factor–DNA interactions are life sustaining and therefore the subject of intensive research. In spite of vast effort, quantitative in vivo studies of the molecular mechanisms underlying these fundamental interactions remain challenging. In the preceding paper, we designed synthetic Sex combs reduced (Scr) peptides and validated genetically their function as transcriptional regulators. Here we present a controllable system for quantitative studies of protein–DNA interactions in live cells that enables us to “titrate” the concentration of the synthetic Scr peptides in a single cell. Using methods with single-molecule sensitivity, advanced fluorescence imaging and fluorescence correlation spectroscopy (FCS), we were able to study the kinetics of Scr-DNA interactions in live salivary gland cells, where Scr is normally expressed during development. We discerned freely moving Scr molecules, characterized the specific and nonspecific Scr peptide–DNA interactions, and estimated their corresponding dissociation constants (Kd) in vivo. Our results suggest that the synthetic Scr transcription factors find their specific target sites primarily by multiple association/dissociation events, the rapidity of which is largely owed to electrostatic interactions. Based on these new findings, we formulate a model mechanism and emulate the kinetics of Scr homeodomain–DNA interactions in live cells using numerical simulations.
Keywords: fluorescence correlation spectroscopy, single-molecule sensitivity, homeodomain, Sex combs reduced, synthetic peptides
Transcription factor–DNA interactions, the assembly of functional transcriptional complexes, and the mechanisms involved in target site recognition are central to understanding gene regulation in vivo. In spite of such relevance, kinetic studies of transcription factor–DNA interactions are limited and have been performed only for a handful of proteins. Most prominent studies include the lac repressor in Escherichia coli (1–4), nuclear receptor-directed transcription (5), helicase translocation along DNA (6), and restriction enzymes–DNA interactions (7, 8). The majority of these studies are carried out with naked DNA or reconstituted chromatin, reflecting the in vivo situation only to a limited extent. Chromatin structure in live cells is highly dynamic, involving multiple interactions and transformations (9–11). Moreover, a number of cofactors and coactivators/corepressors are involved in transcriptional regulation, suggesting that gene expression is accomplished through a dynamic, spatio-temporally entangled interplay between concomitant processes—protein searching for specific target sites, rearrangements of DNA conformation, and recruitment of cofactors and/or coregulators (5, 12, 13). Such complexity is not easily mimicked in solution, therefore necessitating live cell experimentation. However, these measurements are complex, and kinetic studies of protein–DNA interactions in live cells remain scarce (3, 4, 14, 15), mainly due to the limited number of experimental approaches with single-molecule sensitivity that enable nondestructive observation of molecular interactions in live cells (16–18). Recently, the visualization of transcription at native loci has been performed in live cells using two-photon excitation microscopy (19–21). This work was done by gene overexpression, which is an experimental artifact that needs to be overcome to enable quantitative studies of protein–DNA interactions in live cells.
Here we study quantitatively the molecular mechanisms of homeodomain (HD) - DNA interactions in live cells, which is the first step in Hox-mediated transcription. Using functional and nonfunctional synthetic variants of the Drosophila Hox gene Sex combs reduced (Scr), the activity of which has been studied in vivo by phenotypic and genetic analyzes (22), we exploit the minimal expression levels of the hsp70 promoter of the UAS constructs to express the transcription factor in concentrations as close as possible to native conditions. Using confocal laser scanning microscopy with avalanche photodiodes (APDs), so-called APD imaging (23), and fluorescence correlation spectroscopy (FCS) (24–26) we have established a high-resolution experimental modality that enables nondestructive observation of transcription factor molecules and quantitative studies of molecular interactions in live cells with single-molecule sensitivity. We use APD imaging to visualize the Scr-HD molecules at low expression levels and FCS to study quantitatively Scr-HD numbers and mobility. This is done by monitoring the fluorescence intensity fluctuations in a selected spot in the salivary gland nuclei that is generated by focusing the incident laser light through the microscope objective. Statistical analysis of the recorded data is applied in order to derive molecular numbers and macroscopic diffusion constants. For recent reviews on FCS, see, for example refs. 27–29. A short description of the methodology is given in SI Text.
Results
Controllable Hox Peptide Expression in Live Cells.
In order to study the interactions of synthetic HD peptides with nuclear DNA in live cells we first composed a controllable live cell expression system with properties as close as possible to native conditions. We used synthetic Scr genes in live salivary gland cells, where Scr is normally expressed during development (30). Substitutions of threonine 6 and serine 7 of the Scr-HD by alanines (Scr-HDAA) or aspartates (Scr-HDDD) render Scr constitutively active or inactive, respectively (31). Additional mutations of residues 50 and 51 of the third helix of the HD into alanines ( ) completely abolish binding of the HD to the DNA (32). These active and inactive variants allowed us to analyze and compare the differential behavior of functional transcription factors, as compared to their nonfunctional counterparts.
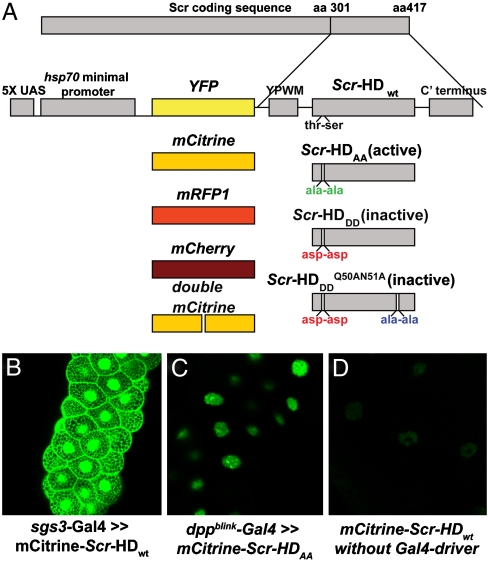
To select a fluorescent probe with optimal photophysical properties for FCS analysis, we used the Gal4-UAS system and generated UAS lines encoding the synthetic Scr peptides fused to different fluorescent proteins (Fig. 1A). Under our experimental conditions the mCitrine–Scr-HD fusions were characterized by the highest photon count per molecule (2–5 kHz). We therefore selected this fluorescence protein as the most appropriate for FCS analysis and used it throughout the study.
Fig. 1.
UAS lines generated and quantitative comparison between Gal4-mediated overexpression and hsp70 basic expression levels by APD imaging. (A) Fluorescent protein variants (YFP, mCitrine, mRFP1, mCherry and double mCitrine) were used to generate 5′ fusions of the four synthetic Scr-HD genes and to generate transgenic flies. The Scr-HD synthetic peptides are comprised of the terminal 117 amino acids of the 417 amino acids long Scr protein. Constructs are not drawn to scale. (B) The salivary gland-specific driver sgs3-Gal4 expressed mCitrine-Scr-HDwt at very high levels, inducing an artificial distribution of the transcription factor all over the salivary gland cells. (C) dppblink-Gal4 resulted in significantly weaker expression levels (1–3 μM) and correct nuclear localization but was still difficult to study by FCS because of the high expression levels. (D) Minimal expression levels exhibited by the UAS constructs (50–300 nM), without the use of any Gal4 driver, facilitated the study of molecular movement and interactions by FCS.
We also evaluated different expression systems (Fig. 1). The use of salivary gland-specific Gal4 drivers (sgs3-Gal4 and dppblink-Gal4) resulted in Scr-HD overexpression, with concentrations in nuclei often exceeding 1 μM (300 nM - 3 μM) (Fig. 1B and C). At such high expression, experimental artifacts are introduced—the transcription factor is distributed all over the salivary gland nuclei (Fig. 1B), and the nonspecific DNA–Scr-HD interactions are pronounced, notably concealing the specific interactions (Fig. 1C). Therefore, low expression systems are required. Taking advantage of expression “leakage” of the hsp70 minimal promoter of the UAS constructs (Fig. 1A), we were able to express the mCitrine-Scr-HD variants without the use of any Gal4 driver (Fig 1D) and regulate the expression level of Scr peptides by heat shock (Fig. 2). Heat shock triggers a physiological response known to increase the transcription levels of the hsp genes, while decreasing the expression levels of most other genes (33). To ensure the expression of all constructs, immunostaining of salivary glands using yw1118 as a negative control (injection background) was performed. All lines exhibited substantial nuclear staining of Scr-HD as compared to the control (Fig. S1).
Fig. 2.
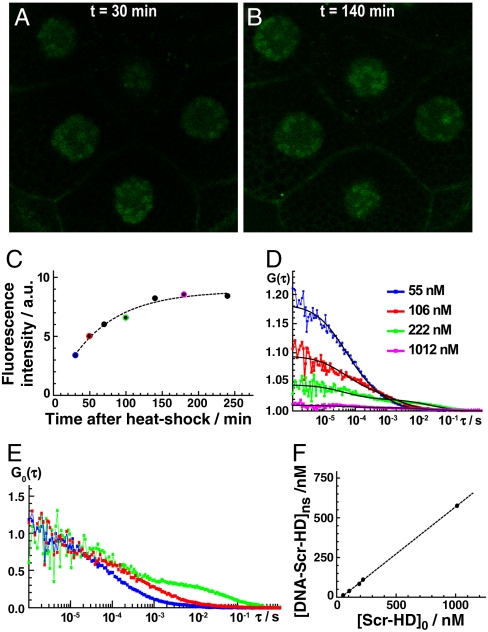
Controllable Scr-HD expression in vivo. (A) APD image of salivary gland nuclei expressing the synthetic Scr-HDwt transcription factor. Heat shock was applied by keeping the Drosophila larvae at 37 °C for 30 min. The image was recorded 30 min after heat shock, when the expression was still low and close to physiological levels. Minimal expression was obtained by the UAS construct without the Gal4 driver. (B) APD imaging showing elevated expression of Scr-HDwt 140 min after heat shock. (C) Gradual increase of Scr-HDwt concentration in live salivary gland cells recorded by time-lapse APD imaging. (D) Gradual increase of Scr-HDwt concentration in live salivary gland cells recorded by FCS. The color code indicates FCS measurements performed just after APD imaging, represented in (C) by the corresponding color. (E) Normalized autocorrelation curves showing changes in Scr-HDwt dynamics as a function of its concentration. All FCS measurements were performed at the same location in the same cell. (F) The concentration of the second component increases linearly with the total concentration of Scr-HDwt.
APD imaging of polytene nuclei and FCS confirmed that the expression levels of the synthetic Scr-HD peptides increased gradually after heat shock (Fig. 2A–D). In addition, FCS analysis revealed marked differences in Scr-HD dynamics depending on its concentration in the same cell (Fig. 2D and E). At low Scr-HD concentrations, sigmoid shaped autocorrelation curves with only one characteristic time (τ1) were observed (Fig. 2D and E, Blue Curve). As the Scr-HD concentration increases, nonspecific interactions with nuclear DNA become prominent. This is reflected in FCS measurements by changes in the shape of the autocorrelation curve. For increasing concentration the autocorrelation curves become complex and a second component with a distinctly longer characteristic time (τ2) was observed (Fig. 2D and E). The relative amount of the second component, which is reflected by its corresponding amplitude, increases for increasing Scr-HD concentrations (Fig. 2F).
Scr-HD Variants Show Differences in Interaction with DNA at the Molecular Level.
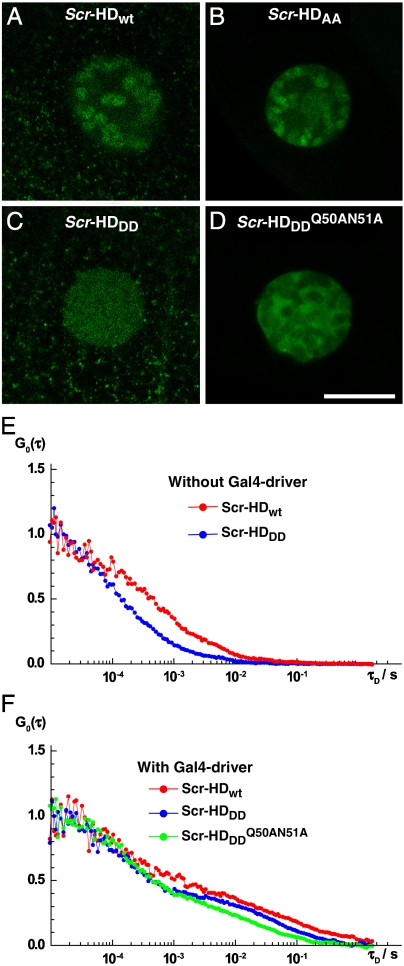
At low concentrations of the Scr-HD transcription factors, 30 nM < [Scr-HD] < 200 nM, we could now clearly visualize marked differences in molecular distribution and dynamics among Scr-HDwt, Scr-HDAA, Scr-HDDD, and  (Fig. 3). While the wild type (Fig. 3A) and the constitutively active Scr-HDAA (Fig. 3B) variants showed patterned distribution, staunchly reflecting the contours of the polytene chromosomes, Scr-HDDD was uniformly distributed in the nucleus (Fig. 3C), and
  was excluded from chromatin and appeared to be “squeezed” between polytene chromosomes (Fig. 3D). FCS analysis revealed that the Scr-HD variants differ in their ability to interact with nuclear DNA. These differences that are readily observed at low Scr-HD concentrations (Fig. 3E) become less discernible at high Scr-HD concentrations (Fig. 3F).
Fig. 3.
Differences in DNA–Scr-HD interactions between different Scr-HD variants visualized in polytene nuclei of live salivary gland cells by APD imaging and FCS. (A–D) Polytene nuclei expressing the synthetic Scr-HDwt, Scr-HDAA, Scr-HDDD and  at low, physiologically relevant concentrations [Scr-HDwt] = 105 nM, [Scr-HDAA] = 157 nM, [Scr-HDDD] = 66 nM and
  . (E–F) Differences in DNA–Scr-HD interactions between the transcriptionally active and inactive variants can be readily observed at low but are less distinguishable at high Scr-HD concentrations.
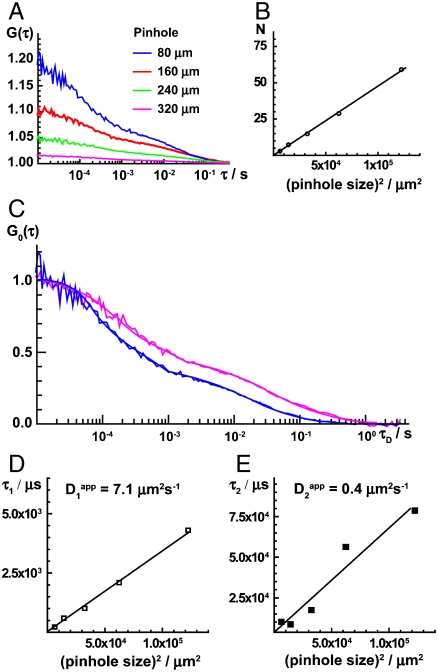
In order to identify processes that generate the fluorescence intensity fluctuations, we examined the effect of the detection volume size on the characteristic times τ1 and τ2 (Fig. 4). Both characteristic times increase when the detection volume element is enlarged (Fig. 4C), indicating that the fluorescence intensity fluctuations are generated by molecular movement. Linear dependence of the characteristic times on the median detection volume element area (Fig. 4D and E) suggests that Scr-HD molecules move in a free diffusion-like fashion, showing no indication of anomalous diffusion.
Fig. 4.
Fluorescence intensity fluctuations recorded in live salivary gland nuclei are generated by molecular movement. (A) Autocorrelation curves recorded in detection volume elements of different size. The amplitude of the autocorrelation curve decreases, indicating that the number of observed Scr-HD molecules increases as the detection volume element is enlarged. (B) The number of Scr-HD molecules in the detection volume element increases linearly with the median surface area of the detection volume element. (C) Normalized autocorrelation curves showing that both characteristic times, τ1 and τ2, increase when the detection volume element is enlarged. The same color code as in (A) is used. (E and F) Both characteristic times, τ1 (E) and τ2 (F), increase linearly with the median surface area of the detection volume element, suggesting that Scr-HD molecules move in a free diffusion-like fashion.
FCS analysis revealed also that the dynamics of Scr-HD peptides is different in different regions of the nucleus. In the nucleoplasm, where DNA concentration is generally low, Scr-HD movement is faster than on the polytene chromosomes and the sites of pronounced Scr-HD accumulation (Fig. S2).
Discerning Specific from Nonspecific DNA–Scr-HD Interactions in Live Cells and Determination of DNA–Scr-HD Binding Constants from FCS Measurements.
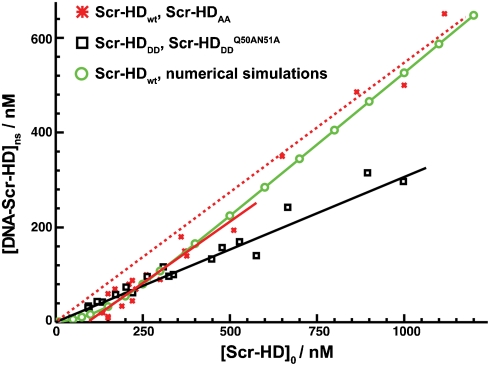
In order to construct DNA–Scr-HD binding curves (Fig. 5), we exploited the responsiveness of the hsp70 minimal promoter of the UAS constructs to heat shock to generate different Scr-HD express levels. Autocorrelation curves recorded in individual nuclei were analyzed using a two-component model with triplet formation (25, 28). FCS analysis revealed that Scr-HDDD and  binding increased linearly with their concentration in a fashion that is characteristic for nonspecific binding (Fig. 5, Black Line). In contrast, Scr-HDwt and Scr-HDAA binding profiles showed a “shifted” line, suggesting that interactions other than the nonspecific ones are also involved (Fig. 5, Red Line). The same shifted binding profile was observed in individual cells (Fig. 2F) and in a collection of cells (Fig. 5B, Red Line). In order to understand these results, we proceeded to analyze the kinetics of the underlying chemical interactions numerically.
Fig. 5.
In vivo DNA - Scr-HD binding. FCS measurements show that the concentration of DNA - Scr-HDDD and  complexes increases linearly with the total concentration of the transcription factor (Black Line), suggesting, in accordance with Eq. 2, that Scr-HDDD and
  interact only nonspecifically with the genomic DNA. In contrast, Scr-HDAA and Scr-HDwt undergo both specific and nonspecific interactions with the DNA (Solid Red Line), showing a binding profile that is in accordance with Eq. 7. In the absence of specific DNA - Scr-HDwt interactions, the nonspecific DNA - Scr-HDwt binding would follow the dashed red line. DNA - Scr-HDwt interactions were also numerically simulated (Green Curve) as described in the text.
Dissociation Constant of the Nonspecific DNA - Scr-HDDD and  Complexes.
Previous genetic experiments (22), imaging analysis, and FCS measurements suggest that Scr-HDDD and  interact nonspecifically with the DNA. These interactions, exemplified for Scr-HDDD, can be described as a reversible chemical reaction:
 |
[1] |
where kns and k-ns are rate constants for the formation and dissociation of the nonspecific DNA - Scr-HDDD complex, respectively.
Using mass balance equations (SI Text), we could show that the concentration of nonspecific DNA - Scr-HDDD complex increases linearly with the total concentration of the transcription factor:
 |
[2] |
Using Eq. 2 and the experimentally determined slope (Fig. 5, Black Line)
 |
[3] |
we derived the equilibrium dissociation constant for the nonspecific DNA - Scr-HDDD complex:
 |
[4] |
where [DNA]0 is the total concentration of potential sites for nonspecific binding.
The total concentration of potential binding sites for nonspecific interactions is not easily estimated. Following the assumptions detailed out in SI Text, we estimated that [DNA]0 = 46 μM. Under these assumptions, the dissociation constant for nonspecific DNA–Scr-HD binding is estimated to be:
| [5] |
Dissociation Constant of the Specific DNA - Scr-HDwt and DNA - Scr-HDAA Complexes.
The transcriptionally active variants Scr-HDwt and Scr-HDAA undergo both specific and nonspecific interactions with the DNA. Supposing that nonspecific interactions precede the specific ones, a two-step process of consecutive reactions was assumed:
 |
[6] |
Applying the quasi-steady state approximation (SI Text), we could show that:
 |
[7] |
in agreement with our experimental findings by FCS (Fig. 2F and Fig. 5, Solid Red Line). The slope gives:
 |
[8] |
and the intercept:
 |
[9] |
If k-s is small compared to kns·[DNA]0 and can therefore be neglected, then
| [10] |
and the total concentration of the specific complex DNA - Scr-HDwt in the polytene nucleus could be estimated
| [11] |
Using the estimated concentration of specific DNA - Scr-HDwt complexes [Eq. 11] and the total concentration of specific DNA binding sites [DNAs] = 92 nM (SI Text), the dissociation constant for the specific DNA - Scr-HDwt complex was estimated:
 |
[12] |
Dissociation Constant of the Nonspecific DNA - Scr-HDwt and DNA - Scr-HDAA Complexes.
FCS data enabled us also to estimate the dissociation constant for the nonspecific DNA - Scr-HDwt and DNA - Scr-HDAA complexes. Using the analysis presented above and the data from Fig. 6 (Dotted Red Line) we could estimate the dissociation constant for the nonspecific DNA - Scr-HDwt and DNA - Scr-HDAA complexes
 |
[13] |
 |
[14] |
Under the assumptions outlined in SI Text, we estimated
 |
[15] |
This threefold difference in nonspecific interactions between DNA - Scr-HDDD and  on one side and DNA - Scr-HDwt and DNA - Scr-HDAA on the other can be naturally explained by differences in the intensity of electrostatic interactions with the negatively charged DNA (SI Text). Charge analysis revealed that at relevant pH (34) Scr-HDwt and Scr-HDAA are more positively charged than Scr-HDDD and
  , explaining also the difference in their mobility observed by FCS (Fig. 3E).
Fig. 6.
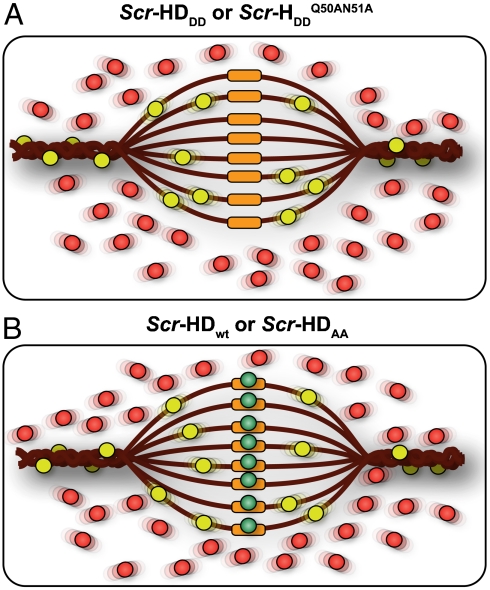
Schematic representation of the differential behavior of Scr-HD variants. (A) In nuclei expressing the transcriptionally inactive variants Scr-HDDD or  FCS can distinguish between free Scr-HD molecules diffusing in the nucleoplasm (Red Spheres) and transcription factor molecules interacting nonspecifically with the DNA (Yellow Spheres). Binding sites within the region of loose chromatin conformation (Orange Rectangles) cannot be bound specifically by Scr-HDDD or
  because binding is abolished by the corresponding amino acid substitutions. (B) DNA - Scr-HDwt or DNA - Scr-HDAA interactions are more complex. In addition to the free Scr-HD molecules in the nucleoplasm (Red Spheres) and transcription factor molecules interacting nonspecifically with the DNA (Yellow Spheres), the transcriptionally active variants undergo also specific interactions (Green Spheres) with putative specific binding sites.
Numerical Simulation of DNA - Scr-HDwt Interactions.
FCS measurements provided important, experimentally derived relationships between rate constants, enabling us to take one step further and attempt to simulate the dynamics of DNA - Scr-HD interactions. Using the experimentally determined relations between rate constants given in Eqs. 3, 8, and 9 and the estimated concentration of specific and nonspecific binding sites we derived by fitting the macroscopic rate constant for Scr-HDwt interactions with the DNA, kns = 1 × 10⁷ M-1s-1, k-ns = 3.25 × 10² s-1, ks = 1.5 × 10⁷ M-1s-1, and k-s = 1 × 10⁻¹ s-1. Using these values, the experimental data derived by FCS could be readily fitted by the simple two-step model given in 6 (Fig. 5, Green Curve).
Discussion
Our results suggest that the synthetic Scr-HD transcription factors find their specific target sites primarily by multiple association/dissociation events, the rapidity of which is largely owed to electrostatic interactions. A model mechanism for DNA - Scr-HD interactions is schematically represented in Fig. 6. By advanced APD imaging and FCS, we detected free Scr-HD molecules that move in the nucleoplasm at a rate that is similar to free 3D diffusion of the purified recombinant mCitrine-Scr-HDwt peptide in solution, DScrHDwtsolution = (2 ± 1) × 10-11 m2s-1 (Fig. 6, Red Spheres). On the chromosomes and in regions of pronounced accumulation, the Scr-HD molecules undergo numerous nonspecific interactions with the DNA (Fig. 6, Yellow Spheres). The dissociation constant for the nonspecific DNA - Scr-HD complexes was estimated to be  for DNA - Scr-HDDD and
  and
and  for DNA - Scr-HDwt and DNA - Scr-HDAA. These somewhat high Kd values suggest that Scr-HD affinity for nonspecific binding sites is rather low, a feature that allows the DNA–Scr-HD complex to assemble/disassemble rapidly in the polytene nucleus densely packed with DNA. Scr-HD molecules undergoing nonspecific interactions with the nuclear DNA are slowed down by the on/off interactions and seem to move in a diffusion-like fashion with an apparent diffusion constant D = (4 ± 2) × 10-13 m2s-1.
Nonspecific DNA - Scr-HDwt interactions always precede the specific ones. However, if the binding site is a putative specific binding site in a region of loose chromatin conformation (Fig. 6, Orange Rectangles), the nonspecific complex readily transforms into a specific complex (Fig. 6, Green Spheres). The number of specific binding sites is lower than the number of nonspecific sites, and the mobility of the specific DNA–Scr-HD complexes seems to be rather low, rendering these complexes “invisible” for direct observation by FCS. Nevertheless, we were able to characterize the specific interactions using rigorous kinetic analysis that was based on FCS measurements performed at very low Scr-HD concentrations. We estimated the dissociation constant of the specific DNA - Scr-HDwt complexes to be in the nanomolar range,  , and their concentration [(DNA - ScrHDwt)s] = (80 ± 50) nM.
The single-molecule sensitivity of APD imaging and FCS enabled us to visualize and quantitatively characterize subtle differences between molecular interactions in live cells, a result hitherto not achieved by any other method of analysis. These results enabled us to probe the kinetics of Scr-HD binding to nuclear DNA using numerical simulations. We derived by fitting macroscopic rate constants for formation/dissociation of the DNA - Scr-HD complexes: kns = 1 × 10⁷ M-1s-1 (kns = 4.5 × 10⁶ M-1s-1 for Scr-HDDD and  ), k-ns = 3.25 × 10² s-1, ks = 1.5 × 10⁷ M-1s-1, and k-s = 1 × 10⁻¹ s-1 and emulated the DNA - Scr-HD interactions by numerical simulations. The rate constant for specific DNA - Scr-HDwt interactions derived by fitting, ks = 1.5 × 10⁷ M-1s-1, is in agreement with measurements of protein association rate constants to a specific site in a long DNA molecule showing that most proteins bind to their specific sites with an association rate constant of the order 1 × 10⁷ M-1s-1 (35).
This study has not only facilitated our understanding of Hox-mediated gene regulation at the molecular level, but also defined an experimental modality for quantitative and nondestructive study of protein–DNA interactions in live cells.
Material and Methods
Preparation of Salivary Glands for FCS and Heat-Shock Procedures.
For FCS measurements salivary glands were dissected and transferred to chambered slides (Nalge Nunc International) in PBS. For titration of Scr-HD expression variable heat shocks (10 min to 2 h) were applied to larvae prior to dissection (refer to SI Methods for more details).
APD Imaging and FCS.
High-resolution fluorescence imaging and FCS measurements were performed on a uniquely modified ConfoCor3 instrument (Carl Zeiss, Jena, Germany) consisting of an inverted microscope for transmitted light and epifluorescence (Axiovert 200 M); a VIS-laser module comprising the Ar/ArKr (458, 477, 488 and 514 nm), HeNe 543 nm and HeNe 633 nm lasers; and the scanning module LSM 510 META. The instrument was modified to enable detection using silicon Avalanche Photo Detectors (SPCM-AQR-1X; PerkinElmer, USA) for imaging and FCS. Images were recorded at a 512 × 512 pixel resolution. The C-Apochromat 40 × /1.2 W UV-VIS-IR objective was used throughout. Fluorescence intensity fluctuations were recorded in arrays of 10–30 consecutive measurements, each measurement lasting 5–10 s. Averaged curves were analyzed using the software for online data analysis or exported and fitted offline using the OriginPro 8 data analysis software (OriginLab Corporation, Northampton, MA). In either case, the nonlinear least-square fitting of the autocorrelation curve was performed using the Levenberg–Marquardt algorithm. Quality of the fitting was evaluated by visual inspection and by residuals analysis. The variation between independent measurements reflects variations between cells, rather than imprecision of FCS measurements. For more details on APD imaging and FCS refer to SI Text.
Numerical Simulations.
Numerical simulations were carried out using the Gepasi 3.30 software package for modeling biochemical systems (36) and software for numerical integration of kinetic equations with the fifth order Runge Kutta method (37).
Supplementary Material
Acknowledgments.
This work was supported by the Kantons of Basel–Stadt and Basel–Landschaft, a grant from the Swiss National Science Foundation, the European Network of Excellence “Cells into Organs,” the Swedish Brain Foundation, the Swedish Research Council, the Knut and Alice Wallenberg Foundation, and the Ministry of Sciences and Technological Development of Serbia (Grants no. 142025 and 142019).
Footnotes
The authors declare no conflict of interest.
See companion article on page 4087.
This article contains supporting information online at www.pnas.org/cgi/content/full/0914612107/DCSupplemental.
References
- 1.Jacob F, Monod J. Genetic regulatory mechanisms in the synthesis of proteins. J Mol Biol. 1961;3:318–356. doi: 10.1016/s0022-2836(61)80072-7. [DOI] [PubMed] [Google Scholar]
- 2.Riggs AD, Bourgeois S, Cohn M. The lac repressor-operator interaction 3. Kinetic studies. J Mol Biol. 1970;53(3):401–417. doi: 10.1016/0022-2836(70)90074-4. [DOI] [PubMed] [Google Scholar]
- 3.Elf J, Li GW, Xie XS. Probing transcription factor dynamics at the single-molecule level in a living cell. Science. 2007;316(5828):1191–1194. doi: 10.1126/science.1141967. [DOI] [PMC free article] [PubMed] [Google Scholar]
- 4.Wang X, Reyes-Lamothe R, Sherratt DJ. Visualizing genetic loci and molecular machines in living bacteria. Biochem Soc Trans. 2008;36(Pt 4):749–753. doi: 10.1042/BST0360749. [DOI] [PubMed] [Google Scholar]
- 5.Metivier R, Reid G, Gannon F. Transcription in four dimensions: nuclear receptor-directed initiation of gene expression. EMBO Rep. 2006;7(2):161–167. doi: 10.1038/sj.embor.7400626. [DOI] [PMC free article] [PubMed] [Google Scholar]
- 6.Myong S, Rasnik I, Joo C, Lohman TM, Ha T. Repetitive shuttling of a motor protein on DNA. Nature. 2005;437(7063):1321–1325. doi: 10.1038/nature04049. [DOI] [PubMed] [Google Scholar]
- 7.Halford SE, Marko JF. How do site-specific DNA-binding proteins find their targets? . Nucleic Acids Res. 2004;32(10):3040–3052. doi: 10.1093/nar/gkh624. [DOI] [PMC free article] [PubMed] [Google Scholar]
- 8.Szczelkun MD. How do proteins move along DNA? Lessons from type-I and type-III restriction endonucleases. Essays Biochem. 2000;35:131–143. doi: 10.1042/bse0350131. [DOI] [PubMed] [Google Scholar]
- 9.Cremer T, et al. Chromosome territories, interchromatin domain compartment, and nuclear matrix: An integrated view of the functional nuclear architecture. Crit Rev Eukar Gene Expr. 2000;10(2):179–212. [PubMed] [Google Scholar]
- 10.Schneider R, Grosschedl R. Dynamics and interplay of nuclear architecture, genome organization, and gene expression. Genes Dev. 2007;21(23):3027–3043. doi: 10.1101/gad.1604607. [DOI] [PubMed] [Google Scholar]
- 11.Wachsmuth M, Caudron-Herger M, Rippe K. Genome organization: Balancing stability and plasticity. Biochim Biophys Acta. 2008;1783(11):2061–2079. doi: 10.1016/j.bbamcr.2008.07.022. [DOI] [PubMed] [Google Scholar]
- 12.Biggin MD, McGinnis W. Regulation of segmentation and segmental identity by Drosophila homeoproteins: The role of DNA binding in functional activity and specificity. Development. 1997;124(22):4425–4433. doi: 10.1242/dev.124.22.4425. [DOI] [PubMed] [Google Scholar]
- 13.Hayashi S, Scott MP. What determines the specificity of action of Drosophila homeodomain proteins? Cell. 1990;63(5):883–894. doi: 10.1016/0092-8674(90)90492-w. [DOI] [PubMed] [Google Scholar]
- 14.Lewis M, et al. Crystal structure of the lactose operon repressor and its complexes with DNA and inducer. Science. 1996;271(5253):1247–1254. doi: 10.1126/science.271.5253.1247. [DOI] [PubMed] [Google Scholar]
- 15.Yu J, Xiao J, Ren X, Lao K, Xie XS. Probing gene expression in live cells, one protein molecule at a time. Science. 2006;311(5767):1600–1603. doi: 10.1126/science.1119623. [DOI] [PubMed] [Google Scholar]
- 16.Cornish PV, Ha T. A survey of single-molecule techniques in chemical biology. ACS Chem Biol. 2007;2(1):53–61. doi: 10.1021/cb600342a. [DOI] [PubMed] [Google Scholar]
- 17.Xie XS, Choi PJ, Li GW, Lee NK, Lia G. Single-molecule approach to molecular biology in living bacterial cells. Ann Rev Biophys. 2008;37:417–444. doi: 10.1146/annurev.biophys.37.092607.174640. [DOI] [PubMed] [Google Scholar]
- 18.Hager GL, McNally JG, Misteli T. Transcription dynamics. Mol Cell. 2009;35(6):741–753. doi: 10.1016/j.molcel.2009.09.005. [DOI] [PMC free article] [PubMed] [Google Scholar]
- 19.Yao J, Ardehali MB, Fecko CJ, Webb WW, Lis JT. Intranuclear distribution and local dynamics of RNA polymerase II during transcription activation. Mol Cell. 2007;28(6):978–990. doi: 10.1016/j.molcel.2007.10.017. [DOI] [PubMed] [Google Scholar]
- 20.Yao J, Munson KM, Webb WW, Lis JT. Dynamics of heat shock factor association with native gene loci in living cells. Nature. 2006;442(7106):1050–1053. doi: 10.1038/nature05025. [DOI] [PubMed] [Google Scholar]
- 21.Yao J, Zobeck KL, Lis JT, Webb WW. Imaging transcription dynamics at endogenous genes in living Drosophila tissues. Methods. 2008;45(3):233–241. doi: 10.1016/j.ymeth.2008.06.004. [DOI] [PMC free article] [PubMed] [Google Scholar]
- 22.Papadopoulos DK, et al. Function and specificity of synthetic Hox transcription factors in vivo. Proc Natl Acad Sci USA. doi: 10.1073/pnas.0914595107. doi:ADD DOI HERE. [DOI] [PMC free article] [PubMed] [Google Scholar]
- 23.Vukojević V, et al. Quantitative single-molecule imaging by confocal laser scanning microscopy. Proc Natl Acad Sci USA. 2008;105(47):18176–18181. doi: 10.1073/pnas.0809250105. [DOI] [PMC free article] [PubMed] [Google Scholar]
- 24.Ehrenberg M, Rigler R. Rotational Brownian-motion and fluorescence intensity fluctuations. Chemical Phys. 1974;4(3):390–401. [Google Scholar]
- 25.Elson EL, Magde D. Fluorescence correlation spectroscopy 1. Conceptual basis and theory. Biopolymers. 1974;13(1):1–27. doi: 10.1002/bip.1974.360130103. [DOI] [PubMed] [Google Scholar]
- 26.Magde D, Webb WW, Elson E. Thermodynamic fluctuations in a reacting system—Measurement by fluorescence correlation spectroscopy. Phys Rev Lett. 1972;29(11):705–708. [Google Scholar]
- 27.Bacia K, Schwille P. Fluorescence correlation spectroscopy. Method Mol Cell Biol. 2007;398:73–84. doi: 10.1007/978-1-59745-513-8_7. [DOI] [PubMed] [Google Scholar]
- 28.Vukojević V, et al. Study of molecular events in cells by fluorescence correlation spectroscopy. Cell Mol Life Sci. 2005;62(5):535–550. doi: 10.1007/s00018-004-4305-7. [DOI] [PMC free article] [PubMed] [Google Scholar]
- 29.Elson EL. Fluorescence correlation spectroscopy measures molecular transport in cells. Traffic. 2001;2(11):789–796. doi: 10.1034/j.1600-0854.2001.21107.x. [DOI] [PubMed] [Google Scholar]
- 30.Panzer S, Weigel D, Beckendorf SK. Organogenesis in Drosophila melanogaster: embryonic salivary gland determination is controlled by homeotic and dorsoventral patterning genes. Development. 1992;114(1):49–57. doi: 10.1242/dev.114.1.49. [DOI] [PubMed] [Google Scholar]
- 31.Berry M, Gehring W. Phosphorylation status of the SCR homeodomain determines its functional activity: Essential role for protein phosphatase 2A,B′. EMBO J. 2000;19(12):2946–2957. doi: 10.1093/emboj/19.12.2946. [DOI] [PMC free article] [PubMed] [Google Scholar]
- 32.Gehring WJ, et al. Homeodomain–DNA recognition. Cell. 1994;78(2):211–223. doi: 10.1016/0092-8674(94)90292-5. [DOI] [PubMed] [Google Scholar]
- 33.Sorensen JG, Nielsen MM, Kruhoffer M, Justesen J, Loeschcke V. Full genome gene expression analysis of the heat stress response in Drosophila melanogaster. Cell Stress Chaperon. 2005;10(4):312–328. doi: 10.1379/CSC-128R1.1. [DOI] [PMC free article] [PubMed] [Google Scholar]
- 34.Schneider S, Wunsch S, Schwab A, Oberleithner H. Rapid activation of calcium-sensitive Na + /H+ exchange induced by 20-hydroxyecdysone in salivary gland cells of Drosophila melanogaster. Mol Cell Endocrinol. 1996;116(1):73–79. doi: 10.1016/0303-7207(95)03699-7. [DOI] [PubMed] [Google Scholar]
- 35.Halford SE. An end to 40 years of mistakes in DNA-protein association kinetics? Biochem Soc Trans. 2009;37(Pt 2):343–348. doi: 10.1042/BST0370343. [DOI] [PubMed] [Google Scholar]
- 36.Mendes P. Biochemistry by numbers: Simulation of biochemical pathways with Gepasi 3. Trends Biochem Sci. 1997;22(9):361–363. doi: 10.1016/s0968-0004(97)01103-1. [DOI] [PubMed] [Google Scholar]
- 37.Vukojević V, Sørensen PG, Hynne F. Predictive value of a model of the Briggs–Rauscher reaction fitted to quenching experiments. J Phys Chem-US. 1996;100(43):17175–17185. [Google Scholar]
Associated Data
This section collects any data citations, data availability statements, or supplementary materials included in this article.


