

Abstract
Recent studies suggest that there are many nonfunctional transcription factor binding sites along a genome. Although these “decoy” sites compete with the promoter region for binding of transcription factors, they may also protect these proteins from degradation. We show that in the limit of perfect protection, where bound transcription factors are never degraded, the competitive effect of nonfunctional binding sites is completely canceled out by the stability gained from reduced degradation. We examine the response of an autoregulated gene to the total number of transcription factors to quantify the consequences of competition for transcription factors. We show that intuition about this system can be gained by mathematically constructing a single gene with effective parameters that reproduce the behavior of a gene with added decoy sites. In analogy to dressed particles in many-body systems we term this description a “quasi gene.” We find that protective decoys buffer against noise by reducing correlations between transcription factors, specifically in the case of production of transcription factors in bursts. We show that the addition of protective decoy sites causes the level of gene expression to approach that predicted from deterministic mass action models. Finally, we show that protective decoy sites decrease the size of the region of parameter space that exhibits bistability.
Keywords: autoregulation, noise, stochastic gene expression, nonfunctional binding site
In the simplest view, transcriptional regulation is a process in which transcription factor proteins bind to the promoter region of a gene and interact with RNA polymerase to either increase or inhibit transcription of that gene. Much effort has been expended to map out networks of gene regulation experimentally and to model such circuits mathematically (1, 2). The effect that the cellular environment—composed of DNA and other regulatory proteins—has on transcriptional regulation has not, however, been fully understood. It has been shown that in Escherichia coli, nonspecific transcription factor/DNA binding plays a significant role in gene regulation (3, 4). In eukaryotes, short transcription factor binding motifs and long genomes ensure that there can be significant numbers of decoy sites (5). In this paper we show how such binding sites influence transcription factor binding to promoters and transcription factor degradation and thereby alter the expression profiles of genes. One expects that whenever the number of transcription factors is less than or of the same order as binding sites there will be significant competition for binding (6). We will show, however, that in the limit of complete protection—meaning no degradation of bound transcription factors—the effects of competition for binding are completely shielded by the gained transcription factor stability, allowing the gene to function as in the absence of additional binding sites.
The kinetic consequences of transcription factors being sequestered by spurious binding sites have been previously considered (7–9), but without taking account of regulation. These studies, based on deterministic mass action modeling, suggest that the protein-DNA recognition landscape must be funneled (10, 11). These earlier studies of decoy sites did not consider the possibility that bound transcription factors may be protected from degradation. It is known, however, that modifications of degradation rate play a key regulatory role. Dimerized transcription factors have a reduced degradation rate compared to that of monomers (12), leading to the “cooperative stability” analyzed by Buchler et al. (13) for small gene networks. Interestingly, in prokaryotes, only the minority of proteins are actively degraded by proteases. Most proteins are stable for at least 15–30 h (14). As a consequence, the major effect that lowers the concentration of transcription factors is dilution by growth and division (13), so, in prokaryotes, bound transcription factors are not protected in a relevant way. In contrast, proteolysis is an important component of cellular regulation in eukaryotes and eubacteria. In the most common mechanism, a series of enzymes tags a protein with ubiquitin, signaling unfolding and degradation by the proteasome. Ubiquitination both eliminates misfolded proteins and ensures that transcription factors have short lifetimes, allowing genes to respond quickly to external signals. More complex roles for ubiquitin-mediated proteolysis have recently been discovered in the context of transcription regulation (15, 16). Recent studies exploring the question of whether active degradation can occur when a transcription factor is bound to DNA suggest the answer is context dependent. There are transcription factors that have been shown to degrade while bound to DNA. One example is provided by the so-called “kamikaze activators,” such as VP16 in Saccharomyces cerevisiae, for which ubiquitin-mediated proteolysis a promoter bound transcription factor is required to initiate transcription (17). This example suggests that protein degradation might in some cases be even more facile for bound transcription factors than for free transcription factors. Additionally, some studies show that certain transcription factors with mutations in the DNA binding domain become resistant to degradation (18). On the other hand, some transcription factors are resistant to degradation when bound, such as p53 (19) and MyoD (20). Because situations exhibiting both binding vulnerability and binding protection exist, we will investigate both scenarios here in the context of an autoregulated gene surrounded by a variable number of nonfunctional transcription factor binding sites.
Deterministic Mass Action Models
Using the principle of mass action, we can set up a deterministic model of an autoregulated gene surrounded by decoy binding sites. This simple treatment is sufficient to understand the basis of the central assertion of this paper, namely, that decoy sites that protect bound transcription factors from degradation do not have a significant effect on the expression of an autoregulated gene.
We consider a model of an autoregulated gene with a single promoter binding site, surrounded by M additional decoy binding sites that are not competent operator sites (see Fig. 1). We distinguish between the number of copies of free transcription factors nF and the number of bound sites m, such that the total number of transcription factors is nT = nF + m, because the transcription factors bind as monomers. In a mass action description, the equilibrium binding probability of the promoter depends on the mean concentration of free transcription factors 〈nF〉 according to a Hill function (21)
| [1] |
where the binding equilibrium constant  is defined as the ratio of the binding rate (h) and the unbinding rate (f). For each site, n† is determined by the binding free energy for the transcription factor. For simplicity, we assume that the M decoys are identical and equivalent to the promoter,* so that all of the sites have the same binding equilibrium constant (n†) and, thus, the same probability of being occupied at a given number of free transcription factors (θ).
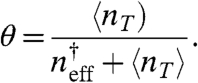
Fig. 1.

The processes involved in our model of an autoactivating gene and decoy binding sites along with the notation we employ. All sites can either have a transcription factor (TF) bound (1) or are unoccupied (0), but only binding on the promoter site (adjacent to gene) has consequences for the production rate of the transcription factor. For an autorepressing gene, the lower (OFF) production rate occurs when a transcription factor is bound to the promoter region, excluding the binding of RNA-polymerase, i.e., g0 > g1. The number of transcription factors is indexed by n. Parameters (rate constants and number of decoy sites) are in italics.
The mean concentration of transcription factors in the system increases due to protein synthesis, which—for an autoactivator—can occur at an enhanced level (g1), or a basal level (g0), depending on the occupancy of the promoter (θ):
| [2] |
Combining Eqs 1 and 2, we see it is only the concentration of free transcription factors, 〈nF〉, that is relevant to the synthesis rate. Degradation of transcription factors occurs for both bound and free transcription factors with different rates. We express the degradation rate for bound transcription factors kbound = (1 - α)k in terms of the free degradation rate kfree = k using a tunable “protection parameter” (α). For α = 0, bound and free transcription factors degrade at the same rate (no protection). For α = 1, bound transcription factors never degrade (full protection). The bound degradation rate also applies to transcription factors bound to the promoter site. The average concentration of bound sites is‡
| [3] |
Depending on the concentration of bound (〈m〉) and free (〈nF〉) transcription factors, the total degradation rate is
| [4] |
| [5] |
The form of Eq. 5 shows that as decoy sites are added, cooperative stability ensures that the degradation rate diminishes in proportion to the concentration of bound sites and the protection coefficient (α). Specifically, if there is bound protection from degradation (α ≠ 0), adding decoy sites (M > 0) decreases total degradation rate (D). The effect is strongest for full protection (α = 1).
The steady-state mass action rate equation for the total concentration of transcription factors, 〈nT〉, specifies a balance between the overall production G[θ(〈nF〉)] and degradation D[θ(〈nF〉)] rates in terms of the mean concentrations in the system:
 |
[6] |
We wish to quantify how decoy binding sites effect the average concentration of transcription factors and, equivalently, the steady-state promoter occupancy probability (θ). Solving Eq. 6 for the steady-state free transcription factor concentration (〈nF〉) by eliminating θ from the overall rates in Eq. 6 by using Eq. 1, we obtain
 |
[7] |
Eq. 7 verifies that the concentration of free transcription factors (〈nF〉) and, consequently, the equilibrium binding probability (θ) have no functional dependence on the number of sites (M) when there is full protection (α = 1). The total concentration of transcription factors (〈nT〉) increases because of the decreased overall degradation rate (D). At the same time, any excess transcription factors in the system are concealed from the promoter by being bound to decoy sites. On the other hand, if bound transcription factors are vulnerable to degradation (α ≠ 1), then θ can decrease dramatically in proportion to the number of sites (M) and their equilibrium binding probabilities (θ). These effects occur in the case of autoactivation (g1 > g0), autorepression (g0 > g1), and no regulation (g0 = g1). In Fig. 2 we plot the free (dashed lines) and total protein (solid lines) concentrations as a function of the number of decoy binding sites, for the case of full (Fig. 2A) and no (Fig. 2B) protection from degradation. Because 〈nF〉 has no dependence on the number of added decoy sites as long as the sites are perfectly protective, the slope of the dependence of 〈nT〉 on the number of decoys is equal to the equilibrium binding constant (θ) because 〈nT〉 = 〈nF〉+(M + 1)θ. In (Fig. 2C) and (Fig. 2D) we plot the concentrations as a function of the production rate in units of the degradation rate (g1/k). In the presence of nonprotective decoys, we note that the dependence of the concentrations on the production rate is especially nonlinear. A system with nonprotective decoys requires a much larger synthesis rate to produce the same mean total concentration of transcription factors as a system without decoys. For fully protective decoys, the effect is the opposite: Smaller production rates are needed to yield the same total concentration of transcription factors.
Fig. 2.

Adding protective decoy binding sites to an autoregulating gene does not alter the free concentration of transcription factors. In A we show the variation in the total (solid) and free (dashed) average concentration of transcription factors as M decoys sites are added to an autoactivator that binds monomers. Because bound transcription factors are fully protected from degradation, the total number of transcription factors increases linearly (with slope θ) as decoy sites are added, leaving the free number of transcription factors unchanged. When binding gives no protection from degradation, as in B, decoy sites act as a sink by “abducting” and degrading transcription factors. For C and D we show the dependence of the concentration of transcription factors on the production rate including (light curves) and not including (dark curves) 15 decoy sites. Parameters include: n† = 5, g0 = g1/10.
The Quasi Gene
We will now show how one can obtain a description of the system in terms of an effective gene “dressed” by decoy binding sites, the expression of which depends on the total rather than the free concentration of transcription factors.§ As a consequence, we are able to isolate the effect of competition for binding transcription factors from the effect of cooperative stability. In the previous approach, which focused on the free concentration of transcription factors, these effects canceled each other out in the case of full protection from bound degradation.
In order to motivate the idea of a quasi gene, we quantify the expression level of a regulated gene as the conditional probability that the promotor is bound given the concentration of total transcription factors, θ(〈nT〉,M,n†). These “promoter response” curves can be obtained by plugging Eq. 3 into Eq. 1 and solving a quadratic equation for θ. Fig. 3A shows typical promoter response functions to the total concentration of transcription factors for a promoter that binds monomers with M decoy binding sites included. To quantify the change in the promoter’s response as decoy sites are added, we fit the profiles in Fig. 3A with the function
 |
[8] |
by finding an effective binding equilibrium constant ( ) and effective Hill coefficient (Heff). In the absence of decoys, the fit reproduces Eq. 1. Because the effective equilibrium constant,
  , is simply the total concentration of transcription factors that are present when θ = 0.5, rather than fitting the entire function we examined the region of each curve around θ = 0.5. The effective Hill coefficient (21) is estimated as
  , with derivatives taken by sampling incremental data very close to θ = 0.5. The results of the fits are shown in Fig. 3 C and D. The effective equilibrium binding constant found from the fit follows the relation:
| [9] |
When described in terms of total transcription factor concentrations, decoys effectively appear to increase the equilibrium binding constants. Fig. 3D shows that as decoy sites are added, the effective Hill coefficient rises above one, the mass action value for monomer binding. The effect is most pronounced when the equilibrium constant is small, because the competitive region of the response occurs for a small concentrations of transcription factors.
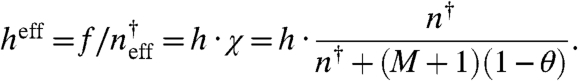
Fig. 3.

Promoter responses to the total concentration of transcription factors illustrate the competition between multiple binding sites and facilitate the description of a quasi gene. In A we show how the equilibrium binding probability (θ) varies in response to a total concentration of transcription factors as decoy sites are added (dashed lines) for different binding equilibrium constants (n†). In B we show the fraction of transcription factors that are free (χ). In Eq. 12 we give an expression for the quasi-gene binding rate in terms of χ as well as a functional form for χ. In C and D we plot the quasi-gene parameters of Eq. 8,  and Heff, respectively, as fitted to the curves in A.
The above analysis of expression profiles shows the emergence of a description based on an effective gene after being dressed by decoy sites (a quasi gene). In order to more concretely compare the properties of the quasi gene to those of the real gene and decoys, we choose a fitting function for the expression level with effective cooperativity Heff = 1 and treat the effective binding equilibrium  as changing nonlinearly with the addition of decoy sites, such that
 |
[10] |
We equate the two expressions for the promoter response, Eqs. 1 and 10, to find the effective binding constant 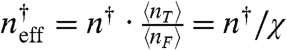 , where χ is the probability that a transcription factor is free. Using Eqs. 1 and 3, one obtains
| [11] |
At θ = 0.5, Eq. 9 is recovered. The most reasonable way of interpreting Eq. 11 is by suggesting that as decoy sites are added the effective binding rate decreases in a manner that depends on the number of binding sites and their occupancy:
 |
[12] |
In Fig 3B, we plot the fraction of transcription factors that are free, 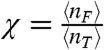 , as a function of the total concentration of transcription factors. We see that χ deviates from one when the concentration of transcription factors is small compared to the concentration of unbound binding sites, essentially when M > n† > 〈nT〉.¶ Essentially, χ is a measurement of the competition between the binding sites because the more χ deviates from 1, the more the rate constants of the quasi gene deviate from the rate constants of an isolated gene (without decoy sites). When χ is small, the effective binding rate heff = h·χ is substantially decreased because the binding sites are competing with each other for an insufficient concentration of transcription factors. In the opposite regime, 〈nT〉 > n† > M, there is an abundance of transcription factors, and therefore most sites are bound (θ ≈ 1). As a result, the binding rate increases to the isolated gene binding rate, heff ≈ h. These concepts are explored more fully in SI Text and Table S1. Similarly, we can derive an effective degradation rate by equating the expression for the degradation rate in Eq. 5 to an effective degradation rate of the total concentration of transcription factors, i.e., D = keff〈nT〉. Again applying Eqs. 1 and 3, we find
 |
[13] |
When there is no protection (α = 0), we recover the free degradation rate, keff = k. In the case of perfect protection (α = 1), the degradation rate and the binding rate are decreased in the same proportion because keff = k·χ. This deterministic mathematical treatment of an effective gene clearly illustrates the balance between “abduction” (Eq. 12) and protection, i.e., “asylum” (Eq. 13), when decoy sites are added to a gene and, more importantly, the regimes where the breakdown of this balance can significantly impact gene expression.
Stochastic Modeling
So far we have discussed the effects of adding decoy binding sites to a system containing a single autoactivating gene within a deterministic description. Due to the relatively small number of both protein molecules and the discrete number of DNA binding sites involved in gene expression, however, gene regulation is a stochastic process (22). Molecular noise has been shown to alter observable expression levels of proteins (23, 24). In the deterministic analysis we have shown that by increasing the number of binding sites, the pool of free transcription factors is depleted, and the apparent equilibrium binding properties are altered. We now turn to the question of how the existence of decoy binding sites alters expression characteristics of noisy gene systems.
The numerical results presented in this paper are extracted from the steady-state probability distributions of a master equation for the stochastic processes of synthesis, degradation, binding, and unbinding. To describe and solve the stochastic system we (i) enumerate all of the possible states of the system; (ii) determine the transition rates into and out of all of these states in terms of the constant parameters (Fig. 1); (iii) convert this information into a master equation in matrix form,  such that P is the vector of probabilities that the system can be found in each state and A is the transition matrix; and (iv) numerically find the null space of that matrix, PSS, which gives
  . PSS is the steady-state joint probability of finding the system in each possible state. The results presented in this paper will primarily focus on the fraction of time that the promoter is bound,
  , and the moments of the free transcription factor number distribution,
  .
.
This stochastic system is described by three variables: the occupancy of the promotor site, i∈{0,1} (unbound, bound); the number of bound decoy sites, m∈{0,1,…,M}; and the number of free transcription factors, n = {0,1,…,∞}. The master equation for this system is written as follows:
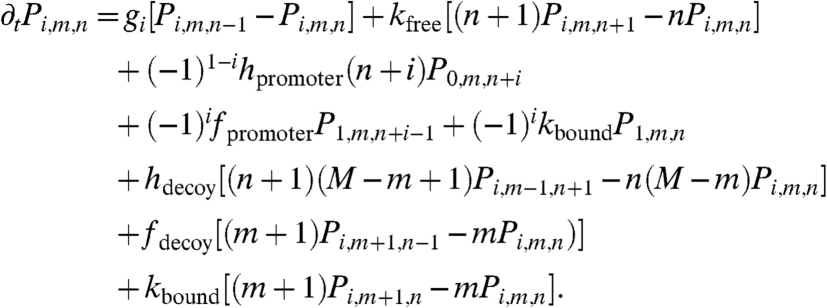 |
[14] |
This master equation describes the following processes: (i) transcription factor production, (ii) free transcription factor degradation, (iii) promoter binding, (iv) promoter unbinding, (v) degradation of a transcription factor that is bound to the promoter, (vi) decoy binding, (vii) decoy unbinding, and (viii) degradation of a transcription factor that is bound to a decoy.
Noise Reduction and Approach to Mass Action
For an unregulated gene, the synthesis and degradation of proteins occur randomly but with a constant average rate. The distribution of protein copy numbers is Poisson, so that the variance in copy number equals the mean. Non-Poissonian distributions arise because of nonlinear processes in gene regulation that create correlations. One can quantify the deviations from a Poisson distribution by plotting the noise strength, σ2/〈n〉, which, for Poisson noise, equals to one (25, 26). An autoactivator will have a noise strength proportional to θ(1 - θ), and an autorepresor will have a noise strength proportional to (1 - θ) because these are the most sensitive regions of their response curves. An autoactivator will be overdispersed (noise strength > 1) and an autorepressor will be underdispersed (noise strength < 1) because of the correlations between the transcription factors created by self regulation (27). The noise strength is also proportional to the ratio of the elevated to basal production rate (28).
Another aspect of the gene regulatory mechanism that has been shown to alter noise strength is the production of proteins in bursts. Instead of explicitly considering the two steps of gene expression, transcription and translation, one can model the production of many protein copies from one mRNA transcript in terms of a “burst” of proteins produced in one synthesis event (23–26, 28–33). Such an approximation is especially useful in the stochastic description, where it has been experimentally shown that transcription is a noisier process than translation (22). To include bursting in our stochastic model, we alter the production term, such that one synthesis event produces a burst of b proteins (32). To compare systems with the same expression levels but different burst sizes, we decrease the production event rate in proportion to the burst size. In unregulated situations, burst size is directly proportional to the deviation from Poission noise strength, i.e., σ2/〈n〉 ∝ 1 + b (23). Autorepressors are capable of decreasing this noise (24).
In Fig. 4 we show that for autoregulators, protective decoy sites reduce deviations from mass action binding responses and decrease the noise strength so as to approach Poisson characteristics. In Fig. S1 we show corresponding results for nonprotective decoys, which do not decrease the noise strength in the same manner. The occupancy probability (θ), average number of free transcription factors (〈nF〉), and noise strength in the free transcription factor distribution ( ) are calculated from the numerical steady state of the master equation (Eq. 14) for constant binding equilibrium (n† = 5) and sweeping production rate (g1). In Fig. 4A the promoter occupancy response to 〈nF〉 for an autoactivator is compared to the deterministic Hill function (Eq. 1). We show that adding protective decoy sites (dashed curves) increases the probability that the promoter site will be bound, both in the case of continuous production (burst size = 1, dark curves) and bursty production (burst size = 10, light curves). This effect coincides with a decrease in the noise strength of the free transcription factor distribution, as shown in Fig. 4C. The results for autorepressors are similar, as shown in Fig. 4B and D, except for the case of burst size = 1, where the distribution is underdispersed. In this case, decoys actually increase the noise strength slightly so that the distribution becomes more Poissonian.
Fig. 4.

Protective decoy sites reduce noise and allow the promoter’s response to the free number of transcription factors to approach that which is expected by mass action. In A we show that when decoy sites are added to an autoactivator (dashed lines), the promoter is more likely to be bound, diminishing the deviation from mass action expression. This effect is even more pronounced when the transcription factors are produced in bursts of 10 at a time (gray lines). In C we show that decoy sites also decrease the noise strength in the distribution of free transcription factors, approaching Poisson noise. In B and D we show the same results for an autorepressor. Autorepressors are noticeably less noisy than autoactivators and even underdispersed when the burst size is one. Regardless of the type of regulation, decoy sites assist the gene in attaining mass action binding and Poisson noise because of their ability to reduce correlations between transcription factors. Adding decoy sites Parameters: n† = 5, g0 = g1/10. The binding and unbinding rates are maintained much higher than the production and degradation rates by maintaining the adiabaticity parameter,  , in the so-called strongly adiabatic regime.
These results are restricted to the strongly adiabatic regime where binding and unbinding rates happen very quickly in comparison to the other rates of the system (32, 34–37). The rapid equilibration between bound and free transcription factor subpopulations means that fluctuations in the free transcription factor distribution are buffered and correlations are diminished, resulting in noise that is more nearly Poisson.
Disruption of Bistability
In certain regions of parameter space, when the promoter site binds transcription factors as dimers, depending on initial conditions, autoactivators can reach two relatively stable quasi-steady states, i.e., they become bistable. In the case of slow time scales, the transcription factor numbers will fluctuate between a “low” and a “high” value. Transitions back and forth between these quasi-steady states are caused by the molecular noise (28, 34). In Fig. 5 we show a phase diagram delineating the bistable regime in terms of the equilibrium binding constant (n†) and the production rate (g1/k). The contour lines show the boundaries of the bistable region of parameter space for zero, one, and five decoy sites. The addition of protective decoy sites decreases the size of the bistable region by stabilizing the high state. The region of parameter space where the low state is the only possible solution is unaltered by the addition of decoy sites. Much as in the case of binding monomers, the addition of protective decoy sites does not drastically alter the mean number of free transcription factors, amplifying the total number of transcription factors. The larger total numbers of transcription factors buffer the fluctuations in the free transcription factor distribution. We note that this is a stochastic effect, and the stochastic phase diagram with many decoys added resembles that of the deterministic model (see Figs. S2 and S3).
Fig. 5.

Protective decoy sites decrease the region of parameter space that exhibits bistability. The region of bistability in the free transcription factor copy number distribution decreases in size as protective decoy sites are added. The boundary of the bistable region is outlined and decreases in area as zero, one, and five decoy sites are added to the system. By protecting a pool of bound transcription factors, decoy sites buffer fluctuations, converting bistable systems into monostable “high state” systems. See SI Text for more details. Parameters: g0 = g1/10, κ = 104.
Discussion
In this paper we have explored the effects of adding decoy binding sites to an autoregulated gene. We have shown that a gene regulatory system with decoy binding sites can often be described as a quasi gene, a gene with effective binding and degradation parameters that mimics a realistic gene in an environment of decoy binding sites. We found that there is a qualitative difference between those cases where the added decoy sites allow bound transcription factors to be degraded and those where bound transcription factors are immune to degradation. Nonprotective decoys compete with a gene for transcription factors and reduce the probability that the gene’s promoter will be bound. Protective decoys do not alter the probability that the promoter is bound but instead provide stability by reducing correlations between the transcription factor copy numbers. We found that decoy sites can reduce molecular noise, especially when transcription factors are produced in bursts.
The issues considered in this paper have practical implications. Appreciating how decoy sites impede or assist specific molecular recognition is a prerequisite for developing physically based models for distinguishing true expression sites bioinformatically from decoys. Understanding nonfunctional binding sites may also have an application in the development of new gene therapies that use transfected synthetic binding sites to inhibit the expression of disease related genes (38). Artificial noise reduction through engineered decoys may also be desirable in the laboratory design of specific gene expression circuitry. We do point out that the question of the evolutionary benefits of under- or over-representation of nonfunctional binding sites in real genomes remains open. Any benefits gained from protective decoy sites could easily be negated by substantial side effects that have not been considered here. For example, there is clear metabolic cost to having a lot of chemical energy stored in a large number of unused transcription factors. We also suspect that the speed of the response to external signals can be reduced by the buffering effects of protective decoy sites, which may or may not be desirable in the biological context.
Supplementary Material
Acknowledgments.
We thank Masaki Sasai and Jin Wang for helpful comments. This work was supported by a San Diego Fellowship and National Science Foundation–sponsored Center for Theoretical Biological Physics Grant PHY-0822283.
Footnotes
The authors declare no conflict of interest.
This article contains supporting information online at www.pnas.org/cgi/content/full/0915138107/DCSupplemental.
*We could easily choose to make the decoy and promoter binding equilibrium constants different. This complication will not be discussed in this paper, except to say that weakening a decoy site’s binding affinity (by increasing n†) diminishes the effect the decoy makes on the gene’s behavior.
‡We include binding to the promoter in counting bound sites, hence the factor of M + 1.
§In many experimental setups, tagging all copies of one type of protein by a fluorescent marker allows all of them to contribute to the total fluorescence. In this case, fluorescence profiles measure the total concentrations of transcription factors, which can differ significantly from the free concentrations of transcription factors (see Fig. 2). As a result, the characteristics of a quasi gene are generally more experimentally accessible than the characteristics of the bare, isolated gene. A beautiful, notable exception can be found in the recent papers by Elf et al. (4), where the bound transcription factor concentrations are measured directly.
¶The form of 1 - χ in Eq. 12 resembles a Hill function from the perspective of a transcription factor, where the substrate is the supply of unbound binding sites.
References
- 1.Sasai M, Wolynes PG. Stochastic gene expression as a many-body problem. Proc Natl Acad Sci USA. 2003;100(5):2374–2379. doi: 10.1073/pnas.2627987100. [DOI] [PMC free article] [PubMed] [Google Scholar]
- 2.Buchler NE, Gerland U, Hwa T. On schemes of combinatorial transcription logic. Proc Natl Acad Sci USA. 2003;100(9):5136–5141. doi: 10.1073/pnas.0930314100. [DOI] [PMC free article] [PubMed] [Google Scholar]
- 3.Bakk A, Metzler R. Nonspecific binding of the OR repressors CI and Cro of bacteriophage λ. J Theor Biol. 2004;231:525–533. doi: 10.1016/j.jtbi.2004.07.007. [DOI] [PubMed] [Google Scholar]
- 4.Elf J, Li GW, Xie XS. Probing transcription factor dynamics at the single-molecule level in a living cell. Nature. 2007;316:1191–1194. doi: 10.1126/science.1141967. [DOI] [PMC free article] [PubMed] [Google Scholar]
- 5.Wunderlich Z, Mirny LA. Fundamentally different strategies for transcriptional regulation are revealed by analysis of binding motifs. Nature Precedings. 2008. Dec 19, http://hdl.handle.net/10101/npre.2008.2688.1.
- 6.Brendel V, Perelson AS. Kinetic analysis of adsorption processes. SIAM J Appl Math. 1987;47(6):1306–1319. [Google Scholar]
- 7.Gerland U, Moroz JD, Hwa T. Physical constraints and functional characteristics of transcription factor-DNA interaction. Proc Natl Acad Sci USA. 2002;99(19):12015–12020. doi: 10.1073/pnas.192693599. [DOI] [PMC free article] [PubMed] [Google Scholar]
- 8.Berg OG, Winter RB, von Hipple PH. Diffusion-driven mechanisms of protein translocation on nucleic acids. 1. Models and theory. Biochemistry-US. 1981;20(24):6929–6948. doi: 10.1021/bi00527a028. [DOI] [PubMed] [Google Scholar]
- 9.Wunderlich Z, Mirny LA. Spatial effects on the speed and reliability of protein-DNA search. Nucleic Acids Res. 2008;36(11):3570–3578. doi: 10.1093/nar/gkn173. [DOI] [PMC free article] [PubMed] [Google Scholar]
- 10.Papoian GA, Wolynes PG. The physics and bioinformatics of binding and folding—An energy landscape perspective. Biopolymers. 2003;125:9170–9178. doi: 10.1002/bip.10286. [DOI] [PubMed] [Google Scholar]
- 11.Wang J, Verkhivker GM. Energy landscape theory, funnels, specificity, and optimal criterion of biomolecular binding. Phys Rev Lett. 2003;90:188101–188104. doi: 10.1103/PhysRevLett.90.188101. [DOI] [PubMed] [Google Scholar]
- 12.Jenal U, Hengge-Aronis R. Regulation by proteolysis in bacterial cells. Curr Opin Microbiol. 2003;6:163–172. doi: 10.1016/s1369-5274(03)00029-8. [DOI] [PubMed] [Google Scholar]
- 13.Buchler NE, Gerland U, Hwa T. Nonlinear protein degradation and the function of genetic circuits. Proc Natl Acad Sci USA. 2005;102(27):9559–9564. doi: 10.1073/pnas.0409553102. [DOI] [PMC free article] [PubMed] [Google Scholar]
- 14.Maurizi MR. Proteases and protein degradation in E. coli. Experientia. 1992;48:178–201. doi: 10.1007/BF01923511. [DOI] [PubMed] [Google Scholar]
- 15.Muratani M, Tansey WP. How the ubiquitin-proteasome system controls transcription. Nat Rev Mol Cell Biol. 2003;4:1–10. doi: 10.1038/nrm1049. [DOI] [PubMed] [Google Scholar]
- 16.Desterro JMP, Rodriguez MS, Hay RT. Regulation of transcription factors by protein degradation. Cell Mol Life Sci. 2000;57:1207–1219. doi: 10.1007/PL00000760. [DOI] [PMC free article] [PubMed] [Google Scholar]
- 17.Thomas D, Tyers M. Transcriptional regulation: Kamikaze activators. Curr Biol. 2000;10(9):R341–R343. doi: 10.1016/s0960-9822(00)00462-0. [DOI] [PubMed] [Google Scholar]
- 18.Molinari E, Gilman M, Natesan S. Proteasome-mediated degradation of transcriptional activators correlates with activation domain potency in vivo. EMBO J. 1999;18(22):6439–6447. doi: 10.1093/emboj/18.22.6439. [DOI] [PMC free article] [PubMed] [Google Scholar]
- 19.Pariat M, et al. Proteolysis by calpains: A possible contribution to degradation of p53. Mol Cell Biol. 1997;17(5):2806–2815. doi: 10.1128/mcb.17.5.2806. [DOI] [PMC free article] [PubMed] [Google Scholar]
- 20.Abu Hatoum O, et al. Degradation of myogenic transcription factor MyoD by the ubiquitin pathway in vivo and in vitro: Regulation by specific DNA binding. Mol Cell Biol. 1998;18(10):5670–5677. doi: 10.1128/mcb.18.10.5670. [DOI] [PMC free article] [PubMed] [Google Scholar]
- 21.Hill TL. Cooperativity Theory in Biochemistry. New York: Springer; 1985. [Google Scholar]
- 22.Swain PS, Elowitz MB, Siggia ED. Intrinsic and extrinsic contributions to stochasticity in gene expression. Proc Natl Acad Sci USA. 2002;99(20):12795–12800. doi: 10.1073/pnas.162041399. [DOI] [PMC free article] [PubMed] [Google Scholar]
- 23.Elowitz MB, Levine AJ, Siggia ED, Swain PS. Stochastic gene expression in a single cell. Science. 2002;297:1183–1186. doi: 10.1126/science.1070919. [DOI] [PubMed] [Google Scholar]
- 24.Thattai M, van Oudenaarden A. Intrinsic noise in gene regulatory networks. Proc Natl Acad Sci USA. 2001;98(15):8614–8619. doi: 10.1073/pnas.151588598. [DOI] [PMC free article] [PubMed] [Google Scholar]
- 25.Kaern M, Elston TC, Blake WJ, Collins JJ. Stochasticity in gene expression: From theories to phenotypes. Nat Rev Genet. 2005;6:451–464. doi: 10.1038/nrg1615. [DOI] [PubMed] [Google Scholar]
- 26.Paulsson J. Summing up the noise in gene networks. Nature. 2004;427:415–418. doi: 10.1038/nature02257. [DOI] [PubMed] [Google Scholar]
- 27.Shang Y. Stochastic noise in auto-regulatory genetic network: Model-dependence and statistical complication. Acta Math Sin. 2008;24(4):563–572. [Google Scholar]
- 28.Scott M, Hwa T, Ingalls B. Deterministic characterization of stochastic genetic circuits. Proc Natl Acad Sci USA. 2007;104(18):7402–7407. doi: 10.1073/pnas.0610468104. [DOI] [PMC free article] [PubMed] [Google Scholar]
- 29.Cai L, Friedman N, Xie XS. Stochastic protein expression in individual cells at the single molecule level. Nature. 2006;440:358–362. doi: 10.1038/nature04599. [DOI] [PubMed] [Google Scholar]
- 30.Yu J, Xiao J, Ren X, Lao K, Xie XS. Probing gene expression in live cells, one protein molecule at a time. Science. 2006;311:1600–1603. doi: 10.1126/science.1119623. [DOI] [PubMed] [Google Scholar]
- 31.Ozbudak EM, Thattai M, Kurtser I, Grossman AD, van Oudenaarden A. Regulation of noise in the expression of a single gene. Nat Genet. 2002;34(69) doi: 10.1038/ng869. [DOI] [PubMed] [Google Scholar]
- 32.Walczak AM, Sasai M, Wolynes PG. Self-consistent proteomic field theory of stochastic gene switches. Biophys J. 2005;88(2):808–828. doi: 10.1529/biophysj.104.050666. [DOI] [PMC free article] [PubMed] [Google Scholar]
- 33.Mehta P, Mukhopadhyay R, Wingreen NS. Exponential sensitivity of noise-driven switching in genetic networks. Phys Biol. 2008;5:026005. doi: 10.1088/1478-3975/5/2/026005. [DOI] [PMC free article] [PubMed] [Google Scholar]
- 34.Walczak AM, Onuchic JN, Wolynes PG. Absolute rate theories of epigenetic stability. Proc Natl Acad Sci USA. 2005;102(52):18926–18931. doi: 10.1073/pnas.0509547102. [DOI] [PMC free article] [PubMed] [Google Scholar]
- 35.Walczak AM, Wolynes PG. Gene-gene cooperativity in small networks. Biophys J. 2008;96(11):4525–4541. doi: 10.1016/j.bpj.2009.03.005. [DOI] [PMC free article] [PubMed] [Google Scholar]
- 36.Hornos JEM, et al. A self-regulating gene: An exact solution. Phys Rev E . 2005;72:51907–51912. doi: 10.1103/PhysRevE.72.051907. [DOI] [PubMed] [Google Scholar]
- 37.Schultz D, Walczak AM, Onuchic JN, Wolynes PG. Extinction and resurrection in gene networks. Proc Natl Acad Sci USA. 2008;105(49):19165–19170. doi: 10.1073/pnas.0810366105. [DOI] [PMC free article] [PubMed] [Google Scholar]
- 38.Morishita R, Higaki J, Tomita N, Ogihara T. Application of transcription factor “decoy” strategy as means of gene therapy and study of gene expression in cardiovascular disease. Circ Res. 1998;82:1023–1028. doi: 10.1161/01.res.82.10.1023. [DOI] [PubMed] [Google Scholar]
Associated Data
This section collects any data citations, data availability statements, or supplementary materials included in this article.