

Abstract
Complex dynamics, such as population cycles, can arise when the individual members of a population become synchronized. However, it is an open question how readily and through which mechanisms synchronization-driven cycles can occur in unstructured microbial populations. In experimental chemostats we studied large populations (>109 cells) of unicellular phytoplankton that displayed regular, inducible and reproducible population oscillations. Measurements of cell size distributions revealed that progression through the mitotic cycle was synchronized with the population cycles. A mathematical model that accounts for both the cell cycle and population-level processes suggests that cycles occur because individual cells become synchronized by interacting with one another through their common nutrient pool. An external perturbation by direct manipulation of the nutrient availability resulted in phase resetting, unmasking intrinsic oscillations and producing a transient collective cycle as the individuals gradually drift apart. Our study indicates a strong connection between complex within-cell processes and population dynamics, where synchronized cell cycles of unicellular phytoplankton provide sufficient population structure to cause small-amplitude oscillations at the population level.
Keywords: cell cycle, Chlorella vulgaris, chemostat, Kuramoto model, population cycles
Phase synchronization is an adjustment of the rhythms of oscillating objects that can lead to the emergence of complex synchronized behavior (1–3), such as periodic color changes of catalytic microparticles (4), the simultaneous flashing of fireflies (5), or the rhythmic clapping of human audiences (6). Similarly, the densities of many ecological populations oscillate with frequencies that cannot be explained by diurnal, annual, or other seasonal variation (7–9). Often, such regular oscillations are caused by multispecies interactions (10–13). Experiments have shown that also single-species populations can undergo regular sustained or damped oscillations (14, 15). “Single-generation cycles” and “delayed-feedback cycles” (16) are types of single-species oscillations that are known to occur when vital rates are density dependent. Here we are concerned with single-species oscillations that occur when individuals synchronize the progression through their life cycles. Synchronization may be caused by locking of individual life cycles to an external force (entrainment), but it may also arise spontaneously through the internal interactions among the individuals (2–4), and can occur in spatially distant populations (10, 13, 17, 18). Populations with obvious internal structure can easily become synchronized by environmental triggers, for example, an insect population that loses all adults to a cold spell before eggs are produced and needs to restart growth on the basis of the surviving larval fraction of the population. In contrast, little is known about the potential for synchronized cycles in microbial populations, despite their important role in all ecosystems across the globe.
In this study, we experimentally induced regular oscillations in populations of unicellular algae that lack distinct life stages other than defined by their cell cycle. The oscillations could be maintained in the absence of external periodic rhythms and can be explained through collective synchronization among a large population of interacting phase oscillators, in agreement with a generalized version of the Kuramoto model (19). Given the causal link between the cell cycle and the cycling of the population, we provide evidence for synchronization of oscillatory dynamics across biological levels of organization.
We ran chemostat experiments with three different unicellular freshwater phytoplankton species and compared the dynamics with those predicted by a mathematical model that allows for nitrogen availability and the nitrogen-dependent progression of phytoplankton cells through their cell cycle (SI Section 1 and 3). To track phytoplankton dynamics in the chemostats we used an automated light extinction measurement system (20) (SI Section 2). This allowed us to collect measurements with a signal sensitivity and temporal resolution (5-min intervals) that is unusually accurate for ecological time-series experiments. In addition, we used a particle counter to determine cell abundance and size distribution (4- to12-h intervals). We used cell volume as a proxy for the phase of the cell cycle in which a phytoplankton cell is located.
Results
We present results from two experimental scenarios, involving three different phytoplankton species, in which we induced cell cycle synchronization that led to oscillatory population dynamics. We hypothesize that phytoplankton cells can become synchronized by nitrogen depletion and can remain synchronized over several generations of population growth. Basic chemostat theory predicts that single-species populations show sigmoid growth after inoculation and reach a steady state. In the first scenario we tested whether characteristics of the sigmoid growth depend on the potential degree of synchronization among cells and started chemostats with phytoplankton cultures that had a different history of nutrient availability: either nitrogen limited or not limited by nitrogen. Chemostat cultures inoculated with either type of phytoplankton showed sigmoid growth, but we observed the smoothly increasing curve predicted by theory only when cells had been previously cultured under nonlimiting conditions (Fig. 1A). When we inoculated from a nitrogen-limited culture, however, cell numbers did not increase monotonously but displayed oscillations toward steady state (Fig. 1A). These results agree with our hypothesis that cells become synchronized when nitrogen depletion arrests cell progression in the nitrogen-sensitive phase in their cell cycle.
Fig. 1.

Oscillatory dynamics in one-species phytoplankton chemostats. Measurements of light extinction [V] are equivalent to algal biovolume (SI Section 2). (A) Smooth and oscillatory increase toward steady state. Chlorella vulgaris (blue) from nitrogen-sufficient culture, δ = 0.65·day−1, Ni = 320 μmol·L−1; Monoraphidium minutum (green) from nitrogen-limited culture, δ = 0.51·day−1, Ni = 160 μmol·L−1. (B) Induced damped oscillations after pausing of chemostat flow. C. vulgaris, δ = 0.0·day−1 from day 20 to 25; otherwise δ = 0.81·day−1, Ni = 160 μmol·L−1. (C) Induced sustained oscillations after pausing of chemostat flow. C. vulgaris, δ = 0.0·day−1 from day 22 to 29; otherwise δ = 0.61·day−1, Ni = 320 μmol·L−1. Arrows indicate when chemostat flow was switched off and back on. Insets show details of the oscillatory part of the dynamics.
In the second, more comprehensive scenario, we tested whether oscillations can be induced in steady-state chemostat populations by directly manipulating nitrogen availability to cells. This setup would, in theory (refs. 21–23 and our model described below), induce oscillations through synchronization. We grew nonsynchronized phytoplankton populations to steady state and then stopped inflow into and outflow out of the chemostat (dilution rate δ = 0·day−1) for several days. This manipulation potentially synchronizes cells because initially cell numbers increase (no mortality due to outflow) but, as the remaining nutrients are being depleted (no nutrient inflow), the cells accumulate in the nitrogen-sensitive phase of their cell cycles. When the flow through the chemostat vessel resumes, cell numbers will decrease to previous steady-state levels. However, cell density will now oscillate because the majority of cells enter the nitrogen-nonsensitive phase of the cell cycle simultaneously and cell divisions occur at approximately the same time.
In our experiments, we observed exactly the dynamic behavior predicted by theory. Small-amplitude oscillations (measured as changes in light extinction or cell densities; Figs. 1 B and C, 2, and 3) occurred after the “off–on” manipulation of the chemostat in separate cultures of three different phytoplankton species and at a variety of chemostat dilution rates and nitrogen concentrations, Ni, of the inflowing medium (SI Section 5). The induced oscillations were damped for small values of external nutrient concentration combined with high dilution rates (Fig. 1B); however, we observed sustained oscillations (up to16 cycles) when δ was lower and Ni was high (Fig. 1C). The oscillations showed period lengths ranging from 1.03 to 3.5 days, thus ruling out circadian cell culture rhythms (23, 24) as the general cause of the oscillations.
Fig. 2.

Cell size distributions (Lower) at consecutive phase locations of the population cycle (Upper, detail from chemostat trial with C. vulgaris, Fig. 1B). Letters (A–H) indicate locations in the population cycle at which cell size distributions were measured (see text for details).
Fig. 3.

Fundamental agreement of oscillatory population behavior and cell cycle phases between experiment and structured model simulation for a chemostat trial with C. vulgaris (compare Fig. 1B). (A) Observed dynamics (red, cell numbers) and model prediction (blue). Inset shows detail of days 26–35. (B) Order parameter R as a simple, direct measure of the degree of synchronization among individual oscillators for the experimental populations (red) and the simulations (blue). (C) Model prediction of cell phase distributions. For each time step color indicates the fraction of the algal population that occupies a certain position along the cell cycle. (D) Observed cell volume distributions as proxy for the cell phase distributions. Color indicates the fraction of the population that has a certain cell volume V (200 bins in 0 μm3 ≤ V ≤ 4,189 μm3).
Measurements of cell size distributions provide evidence that the phytoplankton populations periodically changed their demographic structure with the periodicity of the population oscillations. We measured cell size distributions at distinct phase locations of the population cycles induced by the off–on manipulation and found recurring patterns that can be linked to phases of the cell cycle (Fig. 2). The cycle starts with a unimodal distribution of cell sizes (Fig. 2 A and E) around a small volume of 5 μm3, directly after division of most cells, reminiscent of the cell size distribution in the stationary state (Fig. S4 in SI Section 4). From this point cells grow as a cohort from small to large, which is visible as a moving peak in the cell size distribution that shifts to the right (Fig. 2 A–D and E–H). As soon as the first cells of the cohort begin to divide, a second peak in the cell size distribution at small cell sizes appears, giving rise to a distinct bimodal cell size distribution (Fig. 2 C and G). Because progression through the cell cycle is retarded in the nitrogen-dependent, premitotic phase of the cell cycle, cells entering this second peak are temporarily arrested in their progress. Consequently, the left peak does not shift to the right but increases in size as cells continue to divide, whereas the right peak continues to shift and decreases in size (Fig. 2 D and H). When all cells of the cohort have finished cell division and the right peak of large cells has disappeared, the cycle starts anew if sufficient nitrogen is available (see also Fig. S5 for comparison of experimental with simulated cell size distributions).
Spectral plots of cell size distributions measured over the full length of the chemostat experiment clearly reveal the contribution of cellular level events to the synchronization of the whole population. The steady-state population before the off–on manipulation was characterized by a rather broad unimodal stationary cell size distribution (Fig. S4). Switching off flow through the chemostat led to an extreme accumulation of small cells. After the flow resumed, the collective development of cell cohorts was clearly visible as recurring diagonal stripes in a phase time plot (Fig. 3D). These time periodic patterns align with the oscillations of cell counts (Fig. 3A) and light extinction and can be quantified by oscillations in the order parameter, as a direct measure of the degree of synchronization among individuals (Fig. 3B). The periodicity and intensity of oscillations in light extinction and in cell volume distributions remained directly linked to one another for many generations. Further, the cell size distribution indicates ratios in cell volumes between mother and daughter cells ranging from 3.81 to 4.29 (assuming spherical shapes), which is consistent with Chlorella’s typical mode of division by splitting into four daughter cells.
Mathematical Model Predictions and Agreement with Experimental Data
A mathematical model can provide further insight into the mechanisms that led to synchronization of population and cell cycles in our experimental cultures. The model is based on the Kuramoto theory (19), describing the collective synchronization among a large population of all-to-all coupled oscillators; i.e., each cell adjusts its cell cycle with that of all other cells. In the model we associate a cell's age to a phase variable  , which may be interpreted as the cell's development index. For each cell this phase advances according to its aging velocity g(N, θ) and is disturbed by independent, identically distributed white noises ξi(t) (25, 26):
Because individual organisms in the mixed culture cannot sense their phase difference to others, in contrast to the Kuramoto model (19), we propose that the nutrient concentration N(t) acts as a mean field that is able to mediate interactions among the oscillators. Following Pascual and Caswell (21) we assume that the cell progression g(θ, N) is divided into a nutrient-sensitive and a nonsensitive phase:
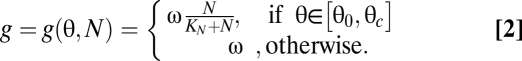 |
In the interval [θ0, θc] aging depends on the nutrient concentration in a Monod-wise function, with half-saturation constant KN. In the absence of nutrients (N = 0) progression in this interval becomes zero ( ) and a cell stops its individual development. For the rest of the cycle, cell phase progression g occurs with the constant maturation velocity ω (taken to be identical for all cells). This gives rise to the following model for the phase distribution p(θ, t) of oscillators at phase θ (note the similarity to the McKendrick-von Foerster equation; see e.g. ref. 7),
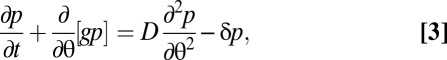 |
where the last term takes into account the losses by the chemostat system with dilution rate δ and the term D > 0 derives from the noise terms (25, 26).
Synchronization theory describes a fixed number of oscillators, but in our case the number of oscillators is not necessarily conserved. This leads to a system of oscillators, where each oscillator gives birth to new ones when its phase has reached 2π and is subsequently eliminated. Cell division enters the model in the form of a boundary condition p(0, t) = νp(2π, t), where ν is the number of daughter cells after cell division (note that in the model the phase of a cell is defined only in the interval 0 ≤ θ ≤ 2π).
Finally, the model is complemented by a dynamic equation for the nutrient concentration,
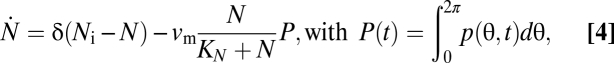 |
where Ni is the input nutrient concentration and P(t) the total population density.
We fitted model parameters to one data set using maximum-likelihood estimation (Fig. 3 and SI Section 3) and used these to independently generate simulations for the remaining data sets. Predictions of the parameterized model are in good agreement with the observed dynamics (Fig. 3). Most notably, across all experiments performed the observed period lengths and the equilibrium cell density agree well with those predicted by our model at different dilution rates (Fig. 4). Moreover, all three major model components (“population dynamics,” “cell cycle dynamics,” and “nutrients as common medium”) are essential and necessary to explain the dynamics of the phytoplankton populations. As in standard Monod-type chemostat models, the growth of the population density P(t) depends on the nutrient concentration. But the model also exhibits a synchronized state in which phase-locked cell cohorts rotate and divide with a common frequency and the population density oscillates in time. These synchronized dynamics appear as two dynamic variants. For some parameter combinations the model exhibits a spontaneous transition to the synchronized state where oscillations are self sustained. For other parameters, the internal coupling is not sufficient to maintain sustained oscillations, so that cycles are damped and decay as the oscillators drift apart in phase. This behavior is reminiscent of the Kuramoto theory (19, 26), where a phase transition occurs at a critical coupling strength. When the coupling strength is below the threshold, the system relaxes to an incoherent state (p(θ, t) = 1/2π). However, for coupling above the threshold collective synchronization sets in spontaneously among a fraction of oscillators that are locked in phase.
Fig. 4.

Period lengths and equilibrium densities in chemostat trials with C. vulgaris at different dilution rates. (A) Period length of oscillations arising after “off–on” manipulation of the chemostat. Blue symbols: Mean period length (±1 SD) of oscillations in 5 separate chemostat trials. Red line: Values predicted by simulations of the structured model. Nitrogen concentration of inflowing medium Ni = 160 μmol·L−1 for all trials. (B) Equilibrium cell density reached in 17 separate trials (blue symbols), either before “off–on” manipulation or without such manipulation performed. Red line: Model prediction. Ni = 80 μmol·L−1 for all trials.
Note that even below the synchronization threshold individual oscillators are rotating along their cycle, but because the oscillators are desynchronized, there is no rhythm in the macroscopic average. In this situation it is possible to unmask the intrinsic dynamics by manually resetting the oscillators’ phase. Such an external perturbation will establish a transient collective cycle that decays as the individuals gradually drift apart. The generation of a collective cycle and relaxation to an incoherent state by dephasing have been experimentally observed (23, 27) and theoretically described as a generalized Landau damping with exponential decay of oscillation amplitudes at intermediate times, but slower than exponential decay at long times (28).
Given the phase distribution p(θ, t), the degree of synchronization or phase coherency among individual cells can be estimated by the order parameter 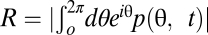 , both for the simulated and for the experimental populations (SI Section 3). As expected by theory, we observed moderate degrees of synchronization (R ≈ 0.7) before dilution switch-off, increasing synchronization (R ≈ 0.9) during the off phase, and oscillatory fading out of synchronization after dilution resumed (Fig. 3B). In some regards, these observations of our experimental and simulated cell cycles differ from what would be expected from the Kuramoto model. First, in contrast to the Kuramoto theory, here the order parameter does not vanish in the asynchronous state as the phase density is not uniform (Fig. S4). The reason for this is that most oscillators will be located in the nutrient-sensitive phase interval (due to the slow aging progression) and also have a higher probability to be washed out with increasing progress in phase (leading to a decay of phase density with θ). Second, in our system (both theory and experiment) onset of synchronization is characterized by oscillations of the order parameter (Fig. 3B). Oscillating order parameters can arise in modified versions of the Kuramoto model, for example, in the presence of structure in the coupling topology among the oscillators (29). But here, the oscillations of the order parameter after perturbation reflect the periodic changes in the shape of the phase density, periodically shifting between unimodal and bimodal distributions.
Discussion
Our experiments show that unicellular phytoplankton can possess an internal population structure that is sufficient to affect population dynamics. In the absence of periodic external forces (in particular, under constant illumination) we observed single-species cycles that can be understood by the interaction between the nutrient pool and nutrient-dependent and -independent phases of the cell cycle. Such cycles cannot occur in standard ecological models that describe unstructured, single populations; i.e., the population behavior cannot be reduced to that of an average cell. When we removed structure from our mathematical model by making all phases of the cell cycle equally nutrient dependent, cells were unable to synchronize and unable to oscillate in abundance.
Previous studies have established that progression through the algal cell cycle can depend on light (24) or nutrient availability (30), that algal populations can be entrained into periodic changes of illumination and that they, in theory, can maintain the entrained state for some time even in the absence of the forcing stimulus (21). Here we show that nutrient shortage, an ecologically important condition, can lead to the entrainment of cell cycle oscillations and that cell cycle and population oscillations remain frequency locked for long periods of time, sometimes without any apparent signs of damping. The most likely explanation for this behavior is that the algal cells act as globally coupled, individual oscillators that interact and become synchronized with one another through a common extracellular field, the nitrogen pool. Even when synchronization is transient and oscillations are damped (Fig. 1B), the characteristic shape and dynamics of the phase distribution (with periodic change between unimodal and bimodal distributions, Fig. 2) provide strong evidence for an internal coupling by the nutrient pool. In this case, coupling is not sufficiently strong to effect sustained synchronization but it is unlikely that such phase distributions can be generated if cells simply drift apart by virtue of their different natural frequencies. Instead, the phase distribution can be sensibly explained only if internal coupling via the common nutrient pool is present. Our mathematical model corroborates this conclusion. We observed the characteristic dynamics of the phase distribution only if we included coupling to the nutrient pool via a nutrient-sensitive and nonsensitive phase interval. Similar types of synchronization (yet at much shorter period lengths of several minutes and hours) have been observed in yeast cell cultures where glycolytic (31) or cell-cycle-dependent (32, 33) oscillations became synchronized through the concentration of extracellular substrates and in nanochemostats where bacterial cells regulated cell density through a feedback mechanism based on quorum sensing of a signaling molecule (15).
The distinction between steady state and cycles is a fundamental one (34, 35). Our study reveals a mechanism by which small-amplitude oscillations can arise in phytoplankton populations that lack obvious internal structure and that are traditionally modeled as groups of homogeneous cells. Our concrete experimental examples and mathematical model showed how complex processes occurring within individual cells may have dynamic consequences at the population level. Thereby, the interaction between within-cell processes and population dynamics goes both ways. On the one hand, population dynamics are able to induce synchrony in the cell cycle of many individuals (through nutrient limitation). On the other hand, collective cell cycles among individual cells generate oscillations at the population level. Because the interaction between phytoplankton and the nutrient pool is the most basic trophic module in aquatic ecosystems, we suggest that cell-cycle-to-population synchronization is also likely to be an important mechanism in natural communities.
Methods
We used experimental populations of the three green algae Monoraphidium minutum, Chlorella vulgaris, and Chlamydomonas reinhardtii. We ran experiments in 0.8-L chemostats at 23.3 ± 0.4 °C and constant fluorescent illumination at 110 μE·m−2·s−1. Algae were cultured in modified Woods Hole WC medium (36) at pH = 6.8. Nitrogen concentrations in the inflow (Ni) were adjusted to limit algal growth and varied between 40 and 320 μmol·L−1. Peristaltic pumps transported the sterilized medium through the chemostats with a continuous flow δ (varying between 0.29 and 0.81·day−1 among chemostat trials) and cultures were bubbled with sterile air. We determined algal biovolume by quasi-continuous, noninvasive light extinction measurements (19). Additionally, we took small (<1-mL) samples of live phytoplankton from the effluent of chemostats and used a CASY particle counter (Schärfe) to measure cell size distributions as well as cell numbers and algal biovolume.
Supplementary Material
Acknowledgments
We thank E. Denzin for help with the chemostat experiments; A. Ryabov for help with the numerical simulations; and T. Hintze and N. Walz for supporting us with the extinction measuring system. We acknowledge support by the Volkswagen Foundation, the German Research Foundation (Deutsche Forschungsgemeinschaft), the Natural Sciences and Engineering Research Council, and the James S. McDonnell Foundation.
Footnotes
The authors declare no conflict of interest.
This article is a PNAS Direct Submission.
This article contains supporting information online at www.pnas.org/cgi/content/full/0908725107/DCSupplemental.
References
- 1.Strogatz S. Sync: The Emerging Science of Spontaneous Order. New York: Hyperion; 2003. [Google Scholar]
- 2.Pikovsky A, Rosenblum M, Kurths J. Synchronization—A Universal Concept in Nonlinear Sciences. Cambridge, UK: Cambridge Univ Press; 2001. [Google Scholar]
- 3.Winfree AT. On emerging coherence. Science. 2001;298:2336–2337. doi: 10.1126/science.1072560. [DOI] [PubMed] [Google Scholar]
- 4.Taylor AF, Tinsley MR, Wang F, Huang Z, Showalter K. Dynamical quorum sensing and synchronization in large populations of chemical oscillators. Science. 2009;323:614–617. doi: 10.1126/science.1166253. [DOI] [PubMed] [Google Scholar]
- 5.Buck J. Synchronous rhythmic flashing of fireflies. Q Rev Biol. 1988;63:265–289. doi: 10.1086/415929. [DOI] [PubMed] [Google Scholar]
- 6.Neda Z, Ravasz E, Brechet Y, Vicsek T, Barabasi AL. The sound of many hands clapping—tumultuous applause can transform itself into waves of synchronized clapping. Nature. 2000;403:849–850. doi: 10.1038/35002660. [DOI] [PubMed] [Google Scholar]
- 7.De Roos AM, Diekmann O, Metz JAJ. Studying the dynamics of structured population models—a versatile technique and its application to Daphnia. Am Nat. 1992;139:123–147. [Google Scholar]
- 8.Kendall BE, et al. Why do populations cycle? A synthesis of statistical and mechanistic modeling approaches. Ecology. 1999;80:1789–1805. [Google Scholar]
- 9.McCauley E, Nelson WA, Nisbet RM. Small-amplitude cycles emerge from stage-structured interactions in Daphnia-algal systems. Nature. 2008;455:1240–1243. doi: 10.1038/nature07220. [DOI] [PubMed] [Google Scholar]
- 10.Blasius B, Huppert A, Stone L. Complex dynamics and phase synchronization in spatially extended ecological systems. Nature. 1999;399:354–359. doi: 10.1038/20676. [DOI] [PubMed] [Google Scholar]
- 11.Fussmann GF, Ellner SP, Shertzer KW, Hairston NG., Jr Crossing the Hopf bifurcation in a live predator-prey system. Science. 2000;290:1358–1360. doi: 10.1126/science.290.5495.1358. [DOI] [PubMed] [Google Scholar]
- 12.Becks L, Hilker FM, Malchow H, Jürgens K, Arndt H. Experimental demonstration of chaos in a microbial food web. Nature. 2005;435:1226–1229. doi: 10.1038/nature03627. [DOI] [PubMed] [Google Scholar]
- 13.Vasseur DA, Fox JW. Phase-locking and environmental fluctuations generate synchrony in a predator-prey community. Nature. 2009;460:1007–1010. doi: 10.1038/nature08208. [DOI] [PubMed] [Google Scholar]
- 14.Costantino RF, Desharnais RA, Cushing JM, Dennis B. Chaotic dynamics in an insect population. Science. 1997;275:389–391. doi: 10.1126/science.275.5298.389. [DOI] [PubMed] [Google Scholar]
- 15.Balagaddé FK, You LC, Hansen CL, Arnold FH, Quake SR. Long-term monitoring of bacteria undergoing programmed population control in a microchemostat. Science. 2005;309:137–140. doi: 10.1126/science.1109173. [DOI] [PubMed] [Google Scholar]
- 16.Murdoch WW, et al. Single-species models for many-species food webs. Nature. 2002;417:541–543. doi: 10.1038/417541a. [DOI] [PubMed] [Google Scholar]
- 17.Haddad NM, Tilman D, Knops JMH. Long-term oscillations in grassland productivity induced by drought. Ecol Lett. 2002;5:110–120. [Google Scholar]
- 18.Manderson JP. The spatial scale of phase synchrony in winter flounder (Pseudo-pleuronectes americanus) production increased among southern New England nurseries in the 1990s. Can J Fish Aquat Sci. 2008;65:340–351. [Google Scholar]
- 19.Kuramoto Y. Chemical Oscillations, Waves, and Turbulence. Berlin: Springer; 1984. [Google Scholar]
- 20.Walz N, Hintze T, Rusche R. Algae and rotifer turbidostats: Studies on stability of live feed cultures. Hydrobiologia. 1997;358:127–132. [Google Scholar]
- 21.Pascual M, Caswell H. From the cell cycle to population cycles in phytoplankton-nutrient interactions. Ecology. 1997;78:897–912. [Google Scholar]
- 22.Lemesle V, Gouzé JL. A simple unforced oscillatory growth model in the chemostat. Bull Math Biol. 2008;70:344–357. doi: 10.1007/s11538-007-9254-5. [DOI] [PubMed] [Google Scholar]
- 23.Beck F, Blasius B, Lüttge U, Neff R, Rascher U. Stochastic noise interferes coherently with a model biological clock and produces specific dynamic behaviour. Proc R Soc Lond B Biol Sci. 2001;268:1307–1313. doi: 10.1098/rspb.2001.1655. [DOI] [PMC free article] [PubMed] [Google Scholar]
- 24.Goto K, Johnson CH. Is the cell division cycle gated by a circadian clock? The case of Chlamydomonas reinhardtii. J Cell Biol. 1995;129:1061–1069. doi: 10.1083/jcb.129.4.1061. [DOI] [PMC free article] [PubMed] [Google Scholar]
- 25.Strogatz SH. From Kuramoto to Crawford: Exploring the onset of synchronization in populations of coupled oscillators. Physica D. 2000;143:1–20. [Google Scholar]
- 26.Acebro JA, Bonilla LL, Péres Vicente CJ, Ritort F, Spigler R. The Kuramoto model: A simple paradigm for synchronization phenomena. Rev Mod Phys. 2005;77:137–185. [Google Scholar]
- 27.Mainen ZF, Sejnowski TJ. Reliability of spike timing in neocortical neurons. Science. 1995;268:1503–1506. doi: 10.1126/science.7770778. [DOI] [PubMed] [Google Scholar]
- 28.Strogatz SH, Mirollo RE, Matthews PC. Coupled nonlinear oscillators below the synchronization threshold: Relaxation by generalized Landau damping. Phys Rev Lett. 1992;68:2730–2733. doi: 10.1103/PhysRevLett.68.2730. [DOI] [PubMed] [Google Scholar]
- 29.Montbrio E, Kurths J, Blasius B. Synchronization of two interacting populations of oscillators. Phys Rev E Stat Nonlin Soft Matter Phys. 2004;70:056125. doi: 10.1103/PhysRevE.70.056125. [DOI] [PubMed] [Google Scholar]
- 30.Vaulot D, Olson RJ, Merkel S, Chisholm SW. Cell-cycle response to nutrient starvation in two phytoplankton species, Thalassosira weissflogii and Hymenomonas carterae. Mar Biol. 1987;95:625–630. [Google Scholar]
- 31.De Monte S, d'Ovidio F, Danø S, Sørensen PG. Dynamical quorum sensing: Population density encoded in cellular dynamics. Proc Natl Acad Sci USA. 2007;104:18377–18381. doi: 10.1073/pnas.0706089104. [DOI] [PMC free article] [PubMed] [Google Scholar]
- 32.Martegani E, Porro D, Ranzi BM, Alberghina L. Involvement of a cell size control mechanism in the induction and maintenance of oscillations in continuous cultures of budding yeast. Biotechnol Bioeng. 1990;36:453–459. doi: 10.1002/bit.260360504. [DOI] [PubMed] [Google Scholar]
- 33.Münch T, Sonnleitner B, Fiechter A. The decisive role of the Saccharomyces cerevisiae cell cycle behaviour for dynamic growth characterization. J Biotechnol. 1992;22:329–352. doi: 10.1016/0168-1656(92)90150-8. [DOI] [PubMed] [Google Scholar]
- 34.Murdoch WW, Briggs CJ, Nisbet RM. Consumer-Resource Dynamics. Princeton, NJ: Princeton Univ Press; 2003. [Google Scholar]
- 35.Turchin P. Complex Population Dynamics. Princeton, NJ: Princeton Univ Press; 2003. [Google Scholar]
- 36.Guillard RR, Lorenzen CJ. Yellow-green algae with chlorophyllide c. J Phycol. 1972;8:10–14. [Google Scholar]
Associated Data
This section collects any data citations, data availability statements, or supplementary materials included in this article.