

Abstract
The blue copper protein from Pseudomonas aeruginosa, azurin, immobilized at gold electrodes through hydrophobic interaction with alkanethiol self-assembled monolayers (SAMs) of the general type [-S - (CH2)n - CH3] (n = 4, 10, and 15) was employed to gain detailed insight into the physical mechanisms of short- and long-range biomolecular electron transfer (ET). Fast scan cyclic voltammetry and a Marcus equation analysis were used to determine unimolecular standard rate constants and reorganization free energies for variable n, temperature (2–55 °C), and pressure (5–150 MPa) conditions. A novel global fitting procedure was found to account for the reduced ET rate constant over almost five orders of magnitude (covering different n, temperature, and pressure) and revealed that electron exchange is a direct ET process and not conformationally gated. All the ET data, addressing SAMs with thickness variable over ca. 12 Å, could be described by using a single reorganization energy (0.3 eV), however, the values for the enthalpies and volumes of activation were found to vary with n. These data and their comparison with theory show how to discriminate between the fundamental signatures of short- and long-range biomolecular ET that are theoretically anticipated for the adiabatic and nonadiabatic ET mechanisms, respectively.
Keywords: electron transfer mechanism, pressure, protein friction, reorganization, temperature
The intrinsic electron transfer (ET) mechanisms of even small and otherwise well-characterized proteins such as cytochrome c or azurin (Az) are difficult to identify conclusively because of the proteins’ complexity, i.e., inhomogeneous structural and dynamic properties (1 –14). The use of bioelectrochemical tunneling junctions, such as self-assembled monolayer (SAM) films of variable composition and thickness on metal electrodes, with redox proteins immobilized at the solution interface (or freely diffusing to the SAM terminal groups) have been shown to provide an assembly with well-defined and variable control parameters. As such, these assemblies are well suited for fundamental studies (15 –32) and offer promise for versatile nanotechnology applications (32,33). On the basis of earlier fundamental efforts, this work studies ET between a Au electrode that is coated with a SAM alkanethiol film of variable thickness and a “model” biomolecular target, the blue copper protein, Az, from Pseudomonas aeruginosa that is immobilized through hydrophobic interactions onto the SAM. As a decisive development of the preceding work (19, 20, 25, 26), we offer unique kinetic data obtained through temperature- and pressure-variation and the mechanistic analysis through a unique global fitting procedure accounting for ET at different SAM thickness, temperature, and pressure conditions that provided the variation of the reduced ET rate constant over almost five orders of magnitude. Importantly, our previous work demonstrated that Au-deposited SAMs can withstand pressure-related stress within 5 to 150 MPa (27, 28, 34).
The rate constant, k et, for nonbiological and biological ET may be cast in a thermally activated Arrhenius form that is valid within the range of commonly used temperatures (1, 3, 35 –45):
| [1] |
where  is an activation free energy for reaching the transition state, which arises from the complete Franck–Condon weighted density of states and is connected with the medium’s dielectric (cumulative sum) response, and A is a preexponential factor whose form is specific for the ET mechanism (see below) (1, 3, 35
–45). Previous studies that exploited SAM-coated electrodes revealed two kinds of phenomenological behavior (17
–22, 24
–31). For the case of thicker SAMs (long-range ET), these studies showed an exponential decay of k
et with the SAM thickness (that is a part of the ET distance, R
e); in accordance with the nonadiabatic ET (tunneling) theory (1, 3, 17
–22, 24
–32, 46
–50):
is an activation free energy for reaching the transition state, which arises from the complete Franck–Condon weighted density of states and is connected with the medium’s dielectric (cumulative sum) response, and A is a preexponential factor whose form is specific for the ET mechanism (see below) (1, 3, 35
–45). Previous studies that exploited SAM-coated electrodes revealed two kinds of phenomenological behavior (17
–22, 24
–31). For the case of thicker SAMs (long-range ET), these studies showed an exponential decay of k
et with the SAM thickness (that is a part of the ET distance, R
e); in accordance with the nonadiabatic ET (tunneling) theory (1, 3, 17
–22, 24
–32, 46
–50):
| [2] |
where R o is the electrode-reactant (so-called donor–acceptor) separation distance at their closest approach, and β is the distance decay parameter, which has a value of ca. 1 Å -1 for alkanethiol SAMs (17 –22, 24 –32). Because of this well-recognized signature, a common consensus exists for the nonadiabatic nature of long-range ET through alkanethiol or other insulating SAMs, independent of the type of redox probe and its interaction mode with the SAM (1, 3, 17 –22, 24 –32, 46 –50).
The situation is different and more controversial with respect to short-range ET at SAM-modified metal electrodes, given a similar composition for SAMs involved in the short- and long-range ET. Importantly, contemporary ET theory accounts for a change in the reaction mechanism with a change in the ET distance, by way of the consequent change in electronic coupling between the electrode and redox center (see below) (1, 3, 35 –45). As the strength of the electronic coupling increases (corresponding to a decrease in R e), the ET mechanism changes from the nonadiabatic limit to an adiabatic or dynamically controlled limit,* provided that the ET process can be viewed as a single barrier-crossing event in both cases. It is well known (1, 3, 35 –45) that an experimental signature of adiabatic ET (or solvent-controlled ET) is a dependence of k et on the polarization dynamics; i.e.,
| [3] |
where ν eff is the effective nuclear vibrational frequency for the fluctuating polar environment that determines barrier-crossing attempts of the reactive system. For the case of Debye-like solvents, ν eff is associated with the longitudinal dielectric relaxation time, whereas for the case of slowly relaxing media with several or a distribution of relaxation times (viscous molecular or ionic liquids, biomolecules, etc.), it can be associated either with the combination, or slower diffusional or quasi-diffusional modes that are linked to local and/or the bulk viscosity (12, 37 –42, 51, 52). In any case, the apparent adiabaticity in soft matter (in contrast to nonconductive crystalline solids, e.g., refs. 3, 35, 36) is intrinsically related to “viscosity control” in the sense that the same relaxation modes determine both phenomena, ET and viscous flow (12, 34, 37 –42, 48, 53). This feature is captured by Eq. 4:
| [4] |
where η is the zero-frequency, bulk shear viscosity, and δ is an “empirical” solvent–protein coupling parameter with values between zero and one (see, e.g., refs. 24, 27, 28, 54, 55). Thus a correlation of the rate constant with the macroscopic (or microscopic) viscosity is a signature for an apparent adiabatic ET (frictionally controlled) mechanism both for nonbiological and biological processes, given that the ET event is not complicated by other barrier-crossing processes such as simple mass transport or conformational interconversion, e.g., refs. 24, 27, 28, 41, 48, 51, 52, 54, 55. For biological ET processes, the bulk (macroscopic) solution viscosity (or applied hydrostatic pressure) affect the proteins’ internal (local) viscosity and ET control occurs through the “protein friction” mechanism (27 –29, 56), which is the biological counterpart of the solvent-controlled (apparent adiabatic) mechanism.
The same experimental signature has been proposed for the “conformational-gating” mechanism, which arises from an extra barrier-crossing event [e.g., (macro)molecular intra- or intermolecular rearrangement] that is not intrinsically coupled with ET but may be rate limiting. In this limiting mechanism, the effective rate constant, k eff, is also proposed to become independent of R e (Eq. 2) and dependent on η (13, 14, 18, 26, 55). A number of examples of rigorously confirmed conformationally gated ET have been reported (13) and it appears to be of considerable biological importance. However, it should be considered as a special case compared to the more general adiabatic ET mechanism that is of essentially “universal” origin (see below) (24, 27 –29, 34, 48, 53, 56 –58). Regrettably, as far as biological ET is concerned, except for several cases limited to different cytochrome c assemblies (24, 27 –29, 56 –58), the apparent adiabatic mechanism has not been discussed or demonstrated unequivocally. In fact, viscosity-related kinetics [also exhibiting a very weak dependence (almost independence) of the rate on the SAM thickness] is often interpreted as arising from a conformational-gating mechanism without relevant experimental cross-testing or analysis to ascertain whether it could arise from a certain adiabatic ET mechanism (see below). Consequently, advanced in-depth investigation of (biological) ET that identifies fundamental mechanisms and, possibly, changeover between them, is a challenging task of general interdisciplinary importance.
Results and Discussion
Rate Constants and Reorganization Free Energies from Cyclic Voltammetry (CV) Peak Analysis.
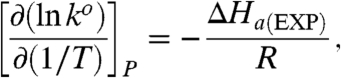
According to earlier work (19, 20, 25, 26, 30, 31), Az can be immobilized by the interaction of its hydrophobic patch with the hydrophobic CH3-terminal groups of the SAM of the general type: [Au - S - (CH2)n - CH3] (n = 2–17). The plots of ln(k o) (where k o is the standard electrochemical rate constant for electron exchange between Az and Au), versus n (values from 2 to 17) exhibited biphasic behavior, namely, the exponential dependence of the type, Eq. 2 within the range of n = 11–17, and a plateau region (weak dependence of k o on n) over the range of n = 3–9; see Fig. 1. For the purpose of in-depth mechanistic studies, we selected three systems with n = 4, 10, and 15. Two of these fall well within the two limiting mechanistic regimes and the third (n = 10) lies in an intermediate range. Fast scan CV applied throughout resulted in well-defined anodic and cathodic peaks arising from the Faradaic process of electron exchange (Fig. S1)and was measured as a function of scan rate to determine rate constants. Typical CV curves under variable experimental conditions are depicted in Figs. S2 and S3. The method of Weber and Creager (59) and Tender et al. (60), which is based on the Marcus relation (1) (see also ref. 61), was applied to obtain unimolecular standard rate constants and reorganization free energies through a fitting algorithm for values of the cathodic and anodic peak potentials as a function of the scan rate (see also refs. 23, 24, 29, 31, 57). Furthermore, we have generalized the fitting algorithm to include the impact of temperature over the range studied in this work (0–60 °C) and applied a global fitting procedure to increase the accuracy for the determination of λ o. The latter procedure allows for the simultaneous fitting of all the data corresponding to ca. 100-fold variation of the potential scan rate and ca. 1000-fold variation of the rate constant throughout the experiments. This corresponds to the variation of the scaled rate constant, v/k o, over almost five orders of magnitude; see Fig. 2 (SI Text contains more details).
Fig. 1.

Logarithmic plots of unimolecular standard rate constants for Az electron exchange at Au electrodes modified by CH3-terminated alkanethiol SAMs with variable methylene number. (Red diamonds) data of Guo et al. (31); (Blue diamonds) Chi et al. (26); (*) Yokoyama et al. (30); (+) Yeuken et al. (20); (▪) this work, 2 °C (Az from Sigma); (Gray circles) the same, 25 °C; (Gray triangles) (Az from Fluka). The broken curves are for eye guidance only. See text for further details and discussion.
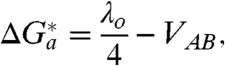
Fig. 2.

Master plots that demonstrate global fitting of the experimental data for the CV peak shift versus potential scan rates, v, reduced to standard rate constants, k o. SEs for experimental points directly match the symbol size. (A) Data collection and global fitting for rate constants at n = 4, 10, 15, and temperatures of 2, 25, and 50 °C; theoretical curves generated for λ o = 0.3 eV at temperatures of 2, 25, and 60 °C (from bottom to top). (B) Data collection and global fitting for the data obtained at n = 4, 10, 15, temperature 2–3 °C, and pressure 5, 50, 100, and 150 MPa; theoretical curves generated for λ o = 0.3 eV, 2 °C (middle curve), λ o = 0.3 eV, 25 °C (upper curve), λ o = 0.6 eV, 2 °C (lower curve). See SI Text for further details.
First we consider and discuss the values of the reorganization free energies, λ o, for ET that are extracted from the CV peak analysis. Figs. S2 and S3 show representative fitting curves accomplished for distinct experimental series under variable temperature and pressure conditions, whereas Fig. 2 A and B report the temperature- and pressure-related datasets for the global fitting procedure. For all three types of SAMs that were studied, the procedures of traditional fitting and original global fitting yielded the common value of λ o = 0.3 eV.† The value from the global fit has an accuracy of ± 0.03 eV (from least-squares analysis), whereas the same analysis for the thinner SAM assemblies with n = 10 and 4 (with data points falling mostly in the middle and bottom parts of the global curves, Fig. 2 A and B) has an average accuracy of ± 0.1 eV. The globally fitted value of λ o = 0.3 ± 0.03 eV seems especially reliable and agrees satisfactorily with the average of values determined for thicker SAMs in previous work (19, 20, 31).
Activation Enthalpies from Arrhenius Analysis.
Next we consider results from the Arrhenius analysis of kinetic data obtained under variable temperature conditions, according to Eq. 5 (1, 3, 35):
 |
[5] |
where ΔH a(EXP) denotes the experimental enthalpy of activation. Fig. 3 depicts Arrhenius-like plots for unimolecular standard rate constants for electron exchange of Az functionalized at Au electrodes modified by alkanethiol SAMs of different thickness (n = 4, 10, 15). The respective values of ΔH a(EXP) along with the values of λ o discussed in the previous subsection are collected in Table 1. In the Marcus model with zero reaction driving force, which is the basic condition for the standard electrochemical rate constants, the activation free energy of the ET process may be related to the reorganization free energy through Eq. 6 (1, 3, 35, 36, 42):
 |
[6] |
where 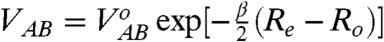 is the “integral” electronic coupling parameter variable with R
e (see also Eq. 2),‡ and
is the “integral” electronic coupling parameter variable with R
e (see also Eq. 2),‡ and  is its value at the minimal electrode-reactant separation, R
o. For all three cases encountered here, it can be readily deduced that V
AB ≪ λ
o/4 (see, e.g., refs. 1, 28, 48, 50, 53 for representative examples). Thus, for the long-range (nonadiabatic) ET we find that
is its value at the minimal electrode-reactant separation, R
o. For all three cases encountered here, it can be readily deduced that V
AB ≪ λ
o/4 (see, e.g., refs. 1, 28, 48, 50, 53 for representative examples). Thus, for the long-range (nonadiabatic) ET we find that 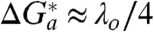 , implying that
  is determined solely by the complete Franck–Condon factor and does not have an appreciable contribution from the preexponential factor; see Eq. 1.
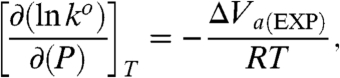
Fig. 3.

Arrhenius plots for unimolecular standard rate constants reduced to the standard value at 2 °C for electron exchange of Azurin hydrophobically immobilized on SAM-coated Au electrodes; the CH3-terminated n-alkanethiol SAMs are n = 4 (Red), 10 (Green), and 15 (Blue). SEs for experimental points directly match the symbol size.
Table 1.
Standard rate constants, intrinsic free energy of activation (derived from the fitted value of reorganization energy, second column), and separately derived “effective” activation parameters for ET of Az at Au electrodes modified by alkanethiol SAMs [-S - (CH2)n - CH3] of different thickness (n = 4, 10, 15)
| SAM, | ko, s-1 (25 °C) |
 (λo/4), (λo/4), |
ΔHa(EXP), | ΔHa(η), | ΔVa(EXP), | ΔVa(η), |
| n | ± 2% | kJ mol-1 | kJ mol-1 | kJ mol-1 | cm3 mol-1 | cm3 mol-1 |
| 4 | 1,098 | 7.2 ± 0.7 | 15.4 ± 2 | 7.8 ± 3.0 | +1.7 ± 0.3 | +4.2 ± 0.6 |
| 10 | 171 | 7.2 ± 0.7 | 11.7 ± 1.3 | 4.1 ± 1.5 | −1.9 ± 0.3 | +2.1 ± 0.6 |
| 15 | 1.42 | 7.2 ± 0.7 | 7.6 ± 0.6 | ≈0 | −5.1 ± 0.6 | ≈0 |
From Table 1 it follows that, for n = 15, within the experimental accuracy, ΔH
a(EXP) ≈ λ
o/4. This result could be expected on the basis that the nonadiabatic mechanism applies and  (that is,
  ; see below). In general terms, the value of
  can be estimated independently using the strict form of the expression for nonadiabatic ET at zero reaction driving force, Eq. 7 (1, 3, 19, 24, 26, 41, 48):
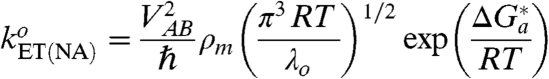 |
[7] |
where ρ
m is the density of electronic states in the metal (electrode) around the Fermi level. However, notwithstanding the awareness of other parameters, a lack of precise information concerning the ET distance R
e (namely, the portion attributable to the protein section), and hence V
AB, makes such an estimate too speculative. Given that the rate constant for ET through thicker SAMs (n = 15) falls within the range attributable to the nonadiabatic mechanism, the obtained result (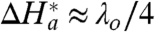 ) seems to be in accord with Eq. 6. This agreement suggests that the value of the reorganization free energy mostly comes from water that is distant from the active site hydrophobic patch. Indeed, the rather small value of λ
o ≈ 0.3 eV found in this work and by others (19, 20, 26, 31) is considerably smaller than that one finds from various homogeneous experiments (63, 64) or theoretical calculations (11). This difference may result from partial burial of the protein’s active site into the SAM’s outer layer, hence its essential isolation from nearby water. Adjacent water is believed to contribute strongly to λ
o, especially to its entropic part (11), and one might expect such contributions to be negligible for hydrophobically adsorbed Az, and lead to
) seems to be in accord with Eq. 6. This agreement suggests that the value of the reorganization free energy mostly comes from water that is distant from the active site hydrophobic patch. Indeed, the rather small value of λ
o ≈ 0.3 eV found in this work and by others (19, 20, 26, 31) is considerably smaller than that one finds from various homogeneous experiments (63, 64) or theoretical calculations (11). This difference may result from partial burial of the protein’s active site into the SAM’s outer layer, hence its essential isolation from nearby water. Adjacent water is believed to contribute strongly to λ
o, especially to its entropic part (11), and one might expect such contributions to be negligible for hydrophobically adsorbed Az, and lead to 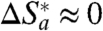 . Importantly, a similar conclusion is deducible for ET within the comparable Au/SAM systems with covalently attached nonbiological metal complexes acting as redox probes (46, 50).
For thinner films, which occur in the apparently adiabatic regime (Eqs. 3, 4), the relaxation component ν
eff is a thermally activated process as well. Hence, in this case, the value of ΔG
a(EXP) (or ΔH
a(EXP), as its constituent part) should contain an additional component, namely, ΔG
a(η) (or, respectively ΔH
a(η)), related to the protein friction (24, 27, 28, 34, 41, 53). For short-range ET (n = 4), the value of ΔH
a(EXP) is twice that of the long-range (n = 15) ET; see Table 1. For an apparent adiabatic mechanism, it is natural to propose that this increase comes from an additional component arising from the slow relaxation (viscosity-related or frictional) term, such that 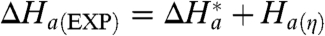 . Assuming that
 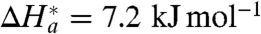 (because still V
AB ≪ λ
o/4; see above), one obtains H
a(η) = 15.4 - 7.2 = 8.2 (kJ mol-1), a value that can be attributed to the accompanying relaxation process(es) of the slowly fluctuating protein/water/SAM environment (see also refs. 24, 28, 54). Interestingly, the value of ΔH
a(EXP) for n = 10 (the transition point between two regimes; Fig. 1) is intermediate to the other two cases; see Table 1.
(because still V
AB ≪ λ
o/4; see above), one obtains H
a(η) = 15.4 - 7.2 = 8.2 (kJ mol-1), a value that can be attributed to the accompanying relaxation process(es) of the slowly fluctuating protein/water/SAM environment (see also refs. 24, 28, 54). Interestingly, the value of ΔH
a(EXP) for n = 10 (the transition point between two regimes; Fig. 1) is intermediate to the other two cases; see Table 1.
Activation Volumes from High-Pressure Kinetic Studies.
The high-pressure kinetic studies provide activation volumes for the process, obtained according to Eq. 8 (65 –69):
 |
[8] |
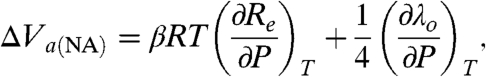
where ΔV a(EXP) denotes the experimental volume of activation to be specified below. Fig. 4 shows logarithmic plots for reduced rate constants as a function of pressure. Experimental values for ΔV a(EXP) obtained for the cases of n = 4, 10, and 15 are presented in Table 1. One can see a dramatic change in the value and even the sign of ΔV a(EXP) on going from the long- to short-range ET. The value for n = 10 that is the transition point between the two regimes, Fig. 1, is intermediate to the other values, Table 1. Next we consider the different contributions to ΔV a(EXP) in more detail.
Fig. 4.

Logarithmic plots for unimolecular standard rate constants reduced to standard pressure at 5 MPa versus hydrostatic pressure for the electron exchange of Azurin hydrophobically attached to Au electrodes modified by CH3-terminated n-alkanethiol SAMs, n = 4 (Red), 10 (Green), and 15 (Blue). SEs for experimental points are two times larger than the symbol size.
From Eqs. 7 and 8 for a nonadiabatic ET mechanism, one obtains Eq. 9 (27, 28, 67):
 |
[9] |
from which it follows that ΔV a(EXP) originates from the effect of pressure on changing the ET distance and/or a change in the medium (SAM/protein/solvent) reorganization energy (27, 28). The value of ΔV a(EXP) = -5.1 ± 0.6 cm3 mol-1 obtained in this case (n = 15, Table 1) is very similar to that reported earlier for the ET of cytochrome c freely diffusing to [Au - S - (CH2)6 - OH] junctions, namely, -5.5 ± 0.5 cm3 mol-1 (which occurs in the nonadiabatic limit) (27, 28). Assuming that the fraction of λ o from the protein interior is small and hardly affected by pressure (70), the contribution of the first term of Eq. 9 can be ascribed to reorganization energy changes of the remote bulk water amounting to ca. -(2 to 3) cm3 mol-1 (25), and the remainder, -(2 to 3) cm3 mol-1, can be ascribed to the contribution from the system’s compression in the transition state versus the initial state (28).
On considering the effect of pressure on the apparent adiabatic (viscosity-related) ET process, from Eqs. 1, 4, 6, and 8, one arrives at Eq. 10 (27, 28, 56, 68, 69):
 |
[10] |
The value of ΔV a(EXP) = +1.7 ± 0.3 cm3 mol-1 obtained in this case (n = 4, Table 1) is considerably smaller than that reported earlier for the ET of cytochrome c freely diffusing to [Au - S - (CH2)3 - OH] junctions (with an ET mechanism attributed to the same adiabatic type), namely, +6.7 ± 0.5 cm3 mol-1 (27, 28). Assuming that the second term of Eq. 10 is similar to that of Eq. 9, the contribution of the first viscosity-related term, ΔV a(η) (caused by protein friction) is found to be +(4 to 5) cm3 mol-1 (Table 1). We note that according to refs. 71, 72, the native structure of Az is preserved under pressure up to 300 MPa, although its internal flexibility decreases (71). This is a direct confirmation for the increase in internal friction under pressure that is deduced from our results. This value is about half of the analogous estimate for free cytochrome c, namely, +(8 to 10) cm3 mol-1 (28). Assuming that the apparent adiabatic mechanism operates for both proteins, this difference must reflect a different flexibility (mobility) of the cytochrome c and Az interiors, under their different interaction conditions with SAMs. The freely diffusing regime for cytochrome c versus the “rigidified,” immobilized Az (because of multipoint interaction with the SAM terminal groups) presumably allows for the stronger impact of pressure on its flexibility.
In summary, the results of temperature and pressure kinetic studies are in mutual agreement, and together with those for the reorganization free energy provide a self-consistent picture for the ET process. Namely, aside from the common value of λ o = 0.3 ± 0.03 eV (which is justifiable theoretically), the long- and short-range ET motifs display distinctive signatures of nonadiabatic and apparent adiabatic ET mechanisms [controlled by the electron tunneling and protein’s slow intramolecular fluctuations (friction), respectively], and the indication of a smooth changeover between them through the mixed ET regime, notably for n = 10. These findings are in remarkable agreement with our previous results for cytochrome c operating at Au/SAM junctions through both irreversibly adsorbed (24, 29) and freely diffusing (27, 28) modes. Given that Azurin and cytochrome c have different redox cores (Cu versus Fe), metal coordination and architecture, and are immobilized at SAMs through essentially different binding modes, the combination of these findings allow for an essentially critical generalization. Namely, the universal nature of two distinct intrinsic mechanisms for biological ET, including the nonadiabatic (tunneling controlled) and apparent adiabatic (friction controlled) patterns, has been demonstrated.
Materials and Methods
Materials.
Highly purified P. aeruginosa azurin was purchased from Sigma and was used without further purification. Alkanethiols, highest purity commercially available, [1-pentanethiol (Acros), 1-undecanethiol (Aldrich), and 1-hexadecanethiol (Aldrich)] were used as received. The buffer components, ultrapure 5 M ammonium acetate (NH4Ac) stock solution and HClO4 (70%) were from Fluka. The Az films were prepared according to published procedures (see SI Text for details).
Instrumentation and Data Processing.
Electrochemical measurements were carried out with an Autolab Electrochemical Analyzer PGSTAT 30, equipped with the General Purpose Electrochemical System software for Windows (Version 4.9). The pressure vessel and electrochemical cell have been described elsewhere (27, 28, 34, 56). The Autolab software was used for the primary data analysis (finding peak positions, midpoint potentials, etc.) and the “postmeasurement” Ohmic potential drop (IR S, where R S is solution resistance between the reference and working electrodes) corrections for the experimental CV response (see SI Text for more details).
The variable pressure measurements were performed with pressure steps of 25 MPa starting at P = 5 MPa (to eliminate any small bubbles), at 2 °C throughout. The variable temperature measurements were performed at ambient pressure starting from 2 °C with a first temperature step of 4° and further steps of 5 °C until 45–55 °C (depending on the CV signal persistency) was reached.
See SI Text for details of the experimental procedures and data analysis.
Supplementary Material
Acknowledgments.
We thank J. Ulstrup, W. Schmickler, P. Hildebrandt, and D. Murgida for past stimulating discussions, especially concerning the problem of adiabatic biomolecular electron transfer. Research grants from the Volkswagen Foundation (R.v.E., D.E.K., T.D.D., and M.S.), Georgian National Science Foundation (D.E.K., T.D.D., and M.S.), and the Deutsche Forschungsgemeinschaft as part of SFB 583 on “Redox-active Metal Complexes” (R.v.E.) are kindly acknowledged. D.H.W. acknowledges financial support from the US National Science Foundation (CHE-0718755).
Footnotes
The authors declare no conflict of interest.
This article is a PNAS Direct Submission.
This article contains supporting information online at www.pnas.org/cgi/content/full/0910837107/DCSupplemental.
*It has been shown that ET reactions that have electronic coupling much smaller than k B T may display a dependence on the solvent response time if it is slow enough (35 –45). Hereafter we refer to the phenomenon as a “dynamically controlled,” “frictionally controlled” (implying protein’s internal friction), or simply “apparent adiabatic” mechanism.
References
- 1.Marcus RA, Sutin AN. Electron transfers in chemistry and biology. Biochim Biophys Acta. 1985;811:265–322. [Google Scholar]
- 2.Hoffman BM, Ratner MA. Gated electron transfer: when are observed rates controlled by conformational interconversion? J Am Chem Soc. 1987;109:6237–6243. [Google Scholar]
- 3.Kuznetsov AM, Ulstrup J. Chichester, UK: Wiley; 1999. Electron Transfer in Chemistry and Biology; pp. 1–374. [Google Scholar]
- 4.van Eldik R. Electron transfer reactions under high pressure: Application of spectroscopic and electrochemical techniques. Adv Chem Ser. 1998;254:315–330. [Google Scholar]
- 5.Bixon M, Jortner J. Electron transfer—from isolated molecules to biomolecules. Adv Chem Phys. 1999;106:35–202. [Google Scholar]
- 6.Regan JJ, Onuchic JN. Electron transfer tubes. Adv Chem Phys. 1999;107:497–553. [Google Scholar]
- 7.Warshel A, Parson W. Dynamics of biochemical and biophysical reactions: Insight from computer simulations. Q Rev Biophys. 2001;34:563–679. doi: 10.1017/s0033583501003730. [DOI] [PubMed] [Google Scholar]
- 8.Gray HB, Winkler JR. Electron tunneling through proteins. Q Rev Biophys. 2003;36:341–372. doi: 10.1017/s0033583503003913. [DOI] [PubMed] [Google Scholar]
- 9.Gray HB, Winkler JR. Long-range electron transfer. Proc Natl Acad Sci USA. 2005;102:3534–3539. doi: 10.1073/pnas.0408029102. [DOI] [PMC free article] [PubMed] [Google Scholar]
- 10.Skourtis SS, Balabin IA, Kawatsu T, Beratan DN. Protein dynamics and electron transfer: Electronic decoherence and non-Condon effects. Proc Natl Acad Sci USA. 2005;102:3552–3557. doi: 10.1073/pnas.0409047102. [DOI] [PMC free article] [PubMed] [Google Scholar]
- 11.Cascella M, Magistrato A, Tavernelli I, Carloni P, Rothlisberger U. Role of protein frame and solvent for the redox properties of azurin from Pseudomonas aeruginosa . Proc Natl Acad Sci USA. 2006;103:19641–19646. doi: 10.1073/pnas.0607890103. [DOI] [PMC free article] [PubMed] [Google Scholar]
- 12.LeBard DN, Matyushov DV. Glassy protein dynamics and gigantic solvent reorganization energy of plastocyanin. J Phys Chem B. 2008;112:5218–5227. doi: 10.1021/jp709586e. [DOI] [PubMed] [Google Scholar]
- 13.Davidson V. Protein control of true, gated, and coupled electron transfer reactions. Acc Chem Res. 2008;41:730–738. doi: 10.1021/ar700252c. [DOI] [PMC free article] [PubMed] [Google Scholar]
- 14.Murgida DH, Hildebrandt P. Disentangling interfacial redox processes of proteins by SERR spectroscopy. Chem Soc Rev. 2008;37:937–945. doi: 10.1039/b705976k. [DOI] [PubMed] [Google Scholar]
- 15.Tarlov MJ, Bowden EF. Electron-transfer reaction of cytochrome c adsorbed on carboxylic acid terminated alkanethiol monolayer electrodes. J Am Chem Soc. 1991;113:1847–1849. [Google Scholar]
- 16.Bond AM. Chemical and electrochemical approaches to the investigation of redox reactions of simple electron transfer metalloproteins. Inorg Chim Acta. 1994;226:293–340. [Google Scholar]
- 17.Feng ZQ, Imabayashi S, Kakiuchi T, Niki K. Long-range electron-transfer reaction rates to cytochrome c across long- and short-chain alkanethiol self-assembled monolayers: Electroreflectance studies. J Chem Soc Faraday Trans. 1997;93:1367–1370. [Google Scholar]
- 18.Avila A, Gregory BW, Niki K, Cotton TM. An electrochemical approach to investigate gated electron transfer using a physiological model system: Cytochrome c immobilized on carboxylic acid-terminated alkanethiol self-assembled monolayers on gold electrodes. J Phys Chem B. 2000;104:2759–2766. [Google Scholar]
- 19.Chi Q, Zhang J, Andersen JET, Ulstrup J. Ordered assembly and controlled electron transfer of the blue copper protein azurin at gold (111) single-crystal substrates. J Phys Chem B. 2001;105:4669–4679. [Google Scholar]
- 20.Jeuken LJC, McEvoy JP, Armstrong FA. Insights into gated electron-transfer kinetics at the electrode–protein interface: A square wave voltammetry study of the blue copper protein azurin. J Phys Chem B. 2002;106:2304–2313. [Google Scholar]
- 21.Murgida DH, Hildebrandt P. Electron-transfer processes of cytochrome c at interfaces. New insights by surface-enhanced resonance Raman spectroscopy. Acc Chem Res. 2004;37:854–861. doi: 10.1021/ar0400443. [DOI] [PubMed] [Google Scholar]
- 22.Niki K, et al. Coupling to lysine-13 promotes electron tunnelling through carboxylate-terminated alkanethiol self-assembled monolayers to cytochrome c . J Phys Chem B. 2003;107:9947–9949. [Google Scholar]
- 23.Wei J, et al. Direct wiring of cytochrome c's heme unit to an electrode: Electrochemical studies. J Am Chem Soc. 2002;124:9591–9599. doi: 10.1021/ja025518c. [DOI] [PubMed] [Google Scholar]
- 24.Khoshtariya DE, Wei J, Liu H, Yue H, Waldeck DH. Charge-transfer mechanism for cytochrome c adsorbed on nanometer thick films. Distinguishing frictional control from conformational gating. J Am Chem Soc. 2003;125:7704–7714. doi: 10.1021/ja034719t. [DOI] [PubMed] [Google Scholar]
- 25.Fujita K, et al. Mimicking protein—protein electron transfer: Voltammetry of Pseudomonas aeruginosa azurin and the thermus thermophilus CuA domain at ω-derivatized self-assembled-monolayer gold electrodes. J Am Chem Soc. 2004;126:13954–13961. doi: 10.1021/ja047875o. [DOI] [PubMed] [Google Scholar]
- 26.Chi Q, Farver O, Ulstrup J. Long-range protein electron transfer observed at the single-molecule level: In situ mapping of redox-gated tunnelling resonance. Proc Natl Acad Sci USA. 2005;102:16203–16208. doi: 10.1073/pnas.0508257102. [DOI] [PMC free article] [PubMed] [Google Scholar]
- 27.Khoshtariya DE, Dolidze TD, Sarauli D, van Eldik R. High-pressure probing of a changeover in the charge-transfer mechanism for intact cytochrome c at gold/self-assembled monolayer junctions. Angew Chem Int Edit. 2006;45:277–281. doi: 10.1002/anie.200502386. [DOI] [PubMed] [Google Scholar]
- 28.Khoshtariya DE, et al. Kinetic, thermodynamic, and mechanistic patterns for free (unbound) cytochrome c at Au/SAM junctions: Impact of electronic coupling, hydrostatic pressure, and stabilizing/denaturing additives. Chem Eur J. 2006;12:7041–7056. doi: 10.1002/chem.200600059. [DOI] [PubMed] [Google Scholar]
- 29.Dolidze TD, Rondinini S, Vertova A, Waldeck DH, Khoshtariya DE. Impact of self-assembly composition on the alternate interfacial electron transfer for electrostatically immobilized cytochrome c . Biopolymers. 2007;87:68–73. doi: 10.1002/bip.20789. [DOI] [PubMed] [Google Scholar]
- 30.Yokoyama K, et al. Electron tunneling through Pseudomonas aeruginosa azurins on SAM gold electrodes. Inorg Chim Acta. 2008;361:1095–1099. doi: 10.1016/j.ica.2007.08.022. [DOI] [PMC free article] [PubMed] [Google Scholar]
- 31.Guo Y, Zhao J, Yin X, Gao X, Tian Y. Electrochemistry investigation on protein protection by alkanethiol self-assembled monolayers against urea impact. J Phys Chem C. 2008;112:6013–6021. [Google Scholar]
- 32.Nitzan A, Ratner MA. Electron transport in molecular wire junctions. Science. 2003;300:1384–1389. doi: 10.1126/science.1081572. [DOI] [PubMed] [Google Scholar]
- 33.Chakraborty T, Peeters F, Sivan U, editors. Nano-Physics and Bio-Electronics: A New Odyssey. Amsterdam: Elsevier; 2003. pp. 1–362. [Google Scholar]
- 34.Dolidze TD, et al. High-pressure testing of heterogeneous charge transfer in a room-temperature ionic liquid: Evidence for solvent dynamic control. J Phys Chem B. 2008;112:3085–3100. doi: 10.1021/jp077734j. [DOI] [PubMed] [Google Scholar]
- 35.Dogonadze RR, Kuznetsov AM. Theory of charge transfer kinetics at solid-polar liquid interfaces. Prog Surf Sci. 1975;6:1–41. [Google Scholar]
- 36.Deskins NA, Dupuis M. Electron transport via polaron hopping in bulk TiO2. A density functional theory characterization. Phys Rev B. 2007;75:195212. [Google Scholar]
- 37.Zusman LD. Outer-sphere electron transfer in polar solvents. Chem Phys. 1980;49:295–304. [Google Scholar]
- 38.Calef DF, Wolynes PG. Classical solvent dynamics and electron transfer. 1. Continuum theory. J Phys Chem. 1983;87:3387–3400. [Google Scholar]
- 39.Hynes JT. Outer-sphere electron-transfer reactions and frequency-dependent friction. J Phys Chem. 1986;90:3701–3706. [Google Scholar]
- 40.Rips I, Jortner J. Dynamic solvent effects on outer-sphere electron transfer. J Chem Phys. 1987;87:2090–2104. [Google Scholar]
- 41.Zusman LD. Dynamic solvent effects in electron transfer reactions. Z Phys Chem. 1994;186:1–29. [Google Scholar]
- 42.Beratan DN, Onuchic JN. Adiabaticity and nonadiabaticity in bimolecular outer-sphere charge transfer reactions. J Chem Phys. 1988;89:6195–6203. [Google Scholar]
- 43.Kosloff R, Ratner MA. Rate constant turnovers: Energy spacings and mixings. J Phys Chem B. 2002;106:8479–8483. [Google Scholar]
- 44.Schmickler W, Mohr J. The rate of electrochemical electron-transfer reactions. J Chem Phys. 2002;117:2867–2872. [Google Scholar]
- 45.Mishra AK, Waldeck DH. A unified model for the electrochemical rate constant that incorporates solvent dynamics. J Phys Chem C. 2009;113:17904–17914. [Google Scholar]
- 46.Chidsey CED. Free energy and temperature dependence of electron transfer at the metal-electrolyte interface. Science. 1991;251:919–922. doi: 10.1126/science.251.4996.919. [DOI] [PubMed] [Google Scholar]
- 47.Finklea HO. Electrochemistry of organized monolayers of thiols and related molecules on electrodes. Electroanal Chem. 1996;19:109–335. [Google Scholar]
-
48.Khoshtariya DE, Dolidze TD, Zusman LD, Waldeck DH. Observation of the turnover between the solvent friction (overdamped) and tunneling (nonadiabatic) charge-transfer mechanisms for a
 electrode process and evidence for a freezing out of the Marcus barrier. J Phys Chem A. 2001;105:1818–1829. [Google Scholar]
 - 49.Weber K, Hockett L, Creager S. Long-range electronic coupling between ferrocene and gold in alkanethiolate-based monolayers on electrodes. J Phys Chem B. 1997;101:8286–8291. [Google Scholar]
- 50.Smalley JF, et al. Heterogeneous electron-transfer kinetics for ruthenium and ferrocene redox moieties through alkanethiol monolayers on gold. J Am Chem Soc. 2003;125:2004–2013. doi: 10.1021/ja028458j. [DOI] [PubMed] [Google Scholar]
- 51.Liu M, et al. Solvent friction effect on intramolecular electron transfer. J Am Chem Soc. 2005;127:17867–17876. doi: 10.1021/ja055596a. [DOI] [PubMed] [Google Scholar]
- 52.Chakrabarti S, Liu M, Waldeck DH, Oliver AM, Paddon-Row MN. Solvent dynamical effects on electron transfer in U-shaped donor-bridge-acceptor molecules. J Phys Chem A. 2009;113:1040–1048. doi: 10.1021/jp807412c. [DOI] [PubMed] [Google Scholar]
- 53.Khoshtariya DE, Dolidze TD, van Eldik R. Multiple mechanisms for electron transfer at metal/self-assembled monolayer/room-temperature ionic liquid junctions: Dynamical arrest versus frictional control and non-adiabaticity. Chem Eur J. 2009;15:5254–5262. doi: 10.1002/chem.200802450. [DOI] [PubMed] [Google Scholar]
- 54.Goguadze NG, Khoshtariya DE, Hammerstad-Pedersen JM, Ulstrup J. Conformational dynamics and solvent viscosity effects in carboxypeptidase-A-catalyzed benzoylglycylphenyllactate hydrolysis. Eur J Biochem. 1991;200:423–429. doi: 10.1111/j.1432-1033.1991.tb16200.x. [DOI] [PubMed] [Google Scholar]
- 55.Crnogorac MM, Shen C, Young S, Hansson Ö, Kostić NM. Effects of mutations in plastocyanin on the kinetics of the protein rearrangement gating the electron-transfer reaction with zinc cytochrome c. Analysis of the rearrangement pathway. Biochemistry. 1996;35:16465–16474. doi: 10.1021/bi961914u. [DOI] [PubMed] [Google Scholar]
- 56.Dolidze TD, Khoshtariya DE, Waldeck DH, Macyk J, van Eldik R. Positive activation volume for a cytochrome c electrode process: Evidence for a “protein friction” mechanism from high-pressure studies. J Phys Chem B. 2003;107:7172–7179. [Google Scholar]
- 57.Yue H, et al. On the electron transfer mechanism between cytochrome c and metal electrodes. Evidence for dynamic control at short distances. J Phys Chem B. 2006;110:19906–19913. doi: 10.1021/jp0620670. [DOI] [PubMed] [Google Scholar]
- 58.Yue H, Waldeck DH. Understanding interfacial electron transfer to monolayer protein assemblies. Curr Opin Solid St M. 2005;9:28–36. [Google Scholar]
- 59.Weber K, Creager SE. Voltammetry of redox-active groups irreversibly adsorbed onto electrodes. Treatment using the Marcus relation between rate and overpotential. Anal Chem. 1994;66:3164–3172. [Google Scholar]
- 60.Tender L, Carter MT, Murrey RW. Cyclic voltammetric analysis of ferrocene alkanethiol monolayer electrode kinetics based on Marcus theory. Anal Chem. 1994;66:3173–3181. [Google Scholar]
- 61.Napper AM, Liu H, Waldeck DH. The nature of electronic coupling between ferrocene and gold through alkanethiolate monolayers on electrodes: The importance of chain composition, interchain coupling, and quantum interference. J Phys Chem B. 2001;105:7699–7707. [Google Scholar]
- 62.Liu YP, Newton MD. Reorganization energy for electron transfer at film-modified electrode surfaces: A dielectric continuum model. J Phys Chem. 1994;98:7162–7169. [Google Scholar]
- 63.Di Bilio AJ, et al. Reorganization energy of blue copper: Effects of temperature and driving force on the rates of electron transfer in ruthenium- and osmium-modified azurins. J Am Chem Soc. 1997;119:9921–9922. [Google Scholar]
- 64.Gray HB, Malmström BG, Williams RJP. Copper coordination in blue proteins. J Biol Inorg Chem. 2000;5:551–559. doi: 10.1007/s007750000146. [DOI] [PubMed] [Google Scholar]
- 65.van Eldik R, Asano T, Le Noble WJ. Activation and reaction volumes in solution. 2. Chem Rev. 1989;89:549–688. doi: 10.1021/cr970461b. [DOI] [PubMed] [Google Scholar]
- 66.Hubbard CD, van Eldik R. Application of high pressure in inorganic and bioinorganic chemistry. In: Riad Manaa M, editor. Chemistry at Extreme Conditions. Amsterdam: Elsevier; 2005. Chap. 4. [Google Scholar]
- 67.Furukawa Y, Ishimori K, Moroshima I. Pressure dependence of the intramolecular electron transfer reaction in myoglobin reinvestigated. J Phys Chem B. 2000;104:1817–1825. [Google Scholar]
- 68.Fu Y, Cole AS, Swaddle TW. Solvent dynamics and pressure effects in the kinetics of the tris(bipyridine)cobalt(III/II) electrode reaction in various solvents. J Am Chem Soc. 1999;121:10410–10415. [Google Scholar]
- 69.Swaddle TW. Homogeneous versus heterogeneous self-exchange electron transfer reactions of metal complexes: Insights from pressure effects. Chem Rev. 2005;105:2573–2608. doi: 10.1021/cr030727g. [DOI] [PubMed] [Google Scholar]
- 70.Miyashita O, Go N. Pressure dependence of protein electron transfer reactions: Theory and simulation. J Phys Chem B. 1999;103:562–571. [Google Scholar]
- 71.Cioni P. Role of protein cavities on unfolding volume change and on internal dynamics under pressure. Biophys J . 2006;91:3390–3396. doi: 10.1529/biophysj.106.085670. [DOI] [PMC free article] [PubMed] [Google Scholar]
- 72.Mei G, et al. The effect of pressure and guanidine hydrochloride on azurins mutated in the hydrophobic core. Eur J Biochem. 1999;265:619–626. doi: 10.1046/j.1432-1327.1999.00751.x. [DOI] [PubMed] [Google Scholar]
Associated Data
This section collects any data citations, data availability statements, or supplementary materials included in this article.