Abstract
Hypertension in SHR is associated with renal redox stress and we hypothesized that nephropathy arises in SHR-A3 from altered capacity to mitigate redox stress compared with nephropathy-resistant SHR lines. We measured renal expression of redox genes in distinct lines of the spontaneously hypertensive rat (SHR-A3, SHR-B2, SHR-C) and the normotensive WKY strain. The SHR lines differ in either resisting (SHR-B2, SHR-C) or experiencing hypertensive nephropathy (SHR-A3). Immediately prior to the emergence of hypertensive renal injury expression of redox genes in SHR-A3 was profoundly altered compared with the injury-resistant SHR lines and WKY. This change appeared to arise in anti-oxidant genes where 16 of 28 were expressed at 34.3% of the level in the reference strain (WKY). No such change was observed in the injury-resistant SHR lines. We analyzed occurrence of transcription factor matrices (TFM) in the promoters of the down-regulated antioxidant genes. In these genes, the HNF1 TFM was found to be nearly twice as likely to be present and the overall frequency of HNF1 sites was nearly 5 times higher, compared with HNF1 TFMs in anti-oxidant genes that were not down-regulated. We identified 35 other (non-redox) renal genes regulated by HNF1. These were also significantly down-regulated in SHR-A3, but not in SHR-B2 or SHR-C. Finally, expression of genes that comprise HNF1 (Tcf1, Tcf2 and Dcoh) was also down-regulated in SHR-A3. The present experiments uncover a major change in transcriptional control by HNF1 that affects redox and other genes and precedes emergence of hypertensive renal injury.
Keywords: SHR, hypertension, renal injury, redox stress, transcription
A clear heritable predisposition to hypertensive renal disease exists that results in familial clustering, with family history of renal disease being the major risk factor for renal disease in hypertensive and diabetic subjects 1. This indicates that, although renal disease may require concurrent hypertension and/or diabetes, manifestation of the disease further requires additional susceptibility, including genetic susceptibility. This interaction between genetic susceptibility and renal injury is also present in the spontaneously hypertensive rat (SHR). This strain was produced by selective breeding to fix elevated blood pressure 2. Subsequent inbreeding to genetic homozygosity produced several distinct SHR lines that share similar levels of blood pressure, but differ in their susceptibility to hypertensive end-organ injury 3. The susceptibility to end-organ injury that is present in the SHR-A3 line, but absent from other SHR lines, provides an opportunity to investigate the genetic basis of susceptibility to hypertensive renal injury and uncover the mechanisms through which genetic susceptibility produces disease 4.
Redox stress is associated with progressive renal disease and may provide a mechanism of renal injury 5–7. Evidence linking oxidative stress to renal injury in animal models is broad. Reduction in dietary anti-oxidants can induce renal injury in rats 8, 9 and several animal models of hypertensive and diabetic nephropathy are linked to injurious mechanisms involving increased oxidative metabolites 10, 11. Redox stress occurs as a result of an imbalance in the production and detoxification of oxidative radicals. Redox balance is achieved as the result of a wide range of anti-oxidant mechanisms that offset the output of numerous biological pathways by which reactive oxygen species are produced. Thus, comprehensive and simultaneous analysis of the activities of all individual components of redox balance at the functional level is impracticable. Gene array methods provide one means to quantitatively assess comprehensive transcriptional levels of many genes encoding proteins participating in redox balance.
We investigated the emergence of progressive renal injury in SHR-A3. We used gene expression array analysis of renal tissue to compare expression in SHR-A3 with expression in two injury-resistant lines, SHR-B2 and SHR-C, and with a normotensive control strain, WKY. In order to avoid the complication of gene expression changes that are consequential to injury, we analyzed samples from animals at several time points prior to the emergence of renal injury. Renal redox stress is known to contribute to hypertension in SHR 12, 13. Our hypothesis is that the SHR-A3 line is susceptible to hypertensive renal injury because its capacity to experience this redox stress and resist injury is less than injury-resistant SHR lines. Our investigation has focused on the expression of genes involved in redox balance as potential mediators of hypertensive renal injury and results in the identification of an important novel transcriptional program affecting redox balance in the kidney. This mechanism is altered in hypertensive injury-prone, but not injury-resistant SHR.
METHODS
Animals
Studies were performed on 4, 8, 12 and 18 week-old male animals (n = 3–4 per strain per age). We used Wistar-Kyoto (WKY) and injury-prone spontaneously hypertensive-A3 (SHR-A3) rats (derived from stocks previously maintained in Heidelberg and kindly provided by Dr. Klaus Lindpaintner) that have been maintained in our facility for 10 years. We also used injury-resistant SHR-B2 and SHR-C animals bred from stocks kindly provided by Professor T. Suzuki, Kinki University School of Medicine, Japan. The genealogical relationships among SHR lines and between SHR and WKY have been documented and these three lines represent the three main breeding lines used to generate inbred SHR animals in Japan 2, 3, 14. More comprehensive information on the relations among SHR lines can be obtained at the Rat Genome Database (http://rgd.mcw.edu/strains) and the National Bio Resource Project for the Rat in Japan (http://www.anim.med.kyoto-u.ac.jp/nbr/home.htm). Animals were housed under controlled conditions in an AAALAC-approved animal facility and provided a standard rodent chow diet and drinking water ad libitum. No dietary sodium loading was employed. All animal use was prospectively reviewed and approved by the University’s Animal Welfare Committee.
Blood pressure in male SHR-A3 (n = 16) and male SHR-B2 (n = 16) was measured by radio-telemetry (Data Sciences, St. Paul, MN) in adult animals 16–19 wks of age. Telemetry catheters were implanted in the abdominal aorta in animals under isoflurane anesthesia. Recordings were begun at least 7 days after implantation and continued for 5–7 days. Differences in blood pressure between SHR-A3 and SHR-B2 were sought by single factor analysis of variance.
For tissue collection, animals were anesthetized by isoflurane inhalation and kidneys were rapidly dissected via ventral laparotomy. Renal gene expression analysis used total RNA preparations from axial renal segments including cortex and medulla. Ureteric pelvis and major vascular structures of the renal sinus were removed from the sample. Each sample from each animal was treated as an independent sample and no pooling was performed.
Histological analysis
Kidney tissue was fixed in 4% buffered formalin and paraffin embedded using standard techniques. Five micron serial sections were stained with Periodic-Acid-Schiff’s stain (PAS) for assessment of renal injury, and PicroSirus red to evaluate the extent of collagen accumulation 15. Histologic analysis was performed in a blinded fashion.
Gene array analysis
Initial studies were focused on expression of genes involved in pathways of reactive radical formation and detoxification. Affymetrix rat RG-U34A arrays were used to determine transcript abundance of genes in SHR-A3, SHR-B2, SHR-C, and WKY animals in each of the 4 age groups. Three to four replicate samples per line × age group were included in the experiments. Sample preparation, array hybridization, and array scanning were performed according to the manufacturer’s recommended protocols. Data processing and scaling prior to analysis was performed using the Affymetrix MAS5.0 software. This data set has been deposited in the NCBI Gene Expression Omnibus (GEO database) with series accession number GSE2104 and was previously used to seek evidence of the heritability of gene expression in SHR lines 16.
TaqMan Assays to verify array data
We performed quantitative RT-PCR to verify gene expression differences observed by gene array. Comparisons were made in renal RNA collected from SHR-A3 and WKY animals. The analysis employed an ABI TaqMan 7700 instrument with reporter probes coupled at the 5’-terminus to FAM and at the 3’- terminus to TAMRA. Normalization of transcript abundance in each sample was by comparison with abundance of 18S RNA.
Electrophoretic mobility shift assays
Gel shift assays were performed using double stranded (DS) oligos corresponding to proximal promoter regions containing putative HNF1 matrix sequences. Nuclear extracts were prepared from rat kidney cells. DNA DS oligos were labeled with 32P. After incubation with nuclear extracts, reactions were resolved on acrylamide gels and developed on film. Competitions were performed with excess unlabelled DS oligos, these included DS oligos with the same sequence as the labeled oligo, DS oligos that were otherwise identical except for containing mutations in residues conserved in the HNF1 binding matrix and DS oligos containing mutations outside the HNF1 matrix.
Bioinformatics
After identification of a set of genes involved in redox balance (please see http://hyper.ahajournals.org, Supplemental Table 1), features of the proximal control of expression of these genes were analyzed in silico using the Genomatix software, MatInspector, to identify the occurrence and frequency of transcription factor matrix sequences in the proximal promoters of redox balance genes (www.genomatix.de).
RESULTS
Emergence of hypertensive renal Injury in SHR-A3 occurs in the absence of dietary modification
Although SHR-A3 is recognized to be prone to end-organ injury, this susceptibility has been reported to require a “Japanese-style” diet with elevated sodium and reduced potassium and protein intake 17. Using PAS and Picro-Sirius red staining we observed that renal structures were undamaged and fibrosis was absent in 18wk old SHR-A3 raised on a standard laboratory rodent chow and provided water to drink (Figure 1). However, by 24 wks of age, glomerular and tubular injury, along with fibrosis and increased interstitial cellularity were present in SHR-A3, but absent from WKY and from the injury resistant SHR-B2 and SHR-C strains. The extent and severity of this injury progressed in SHR-A3 animals at 30 wks of age, but the other SHR lines remained free from injury.
Fig 1.
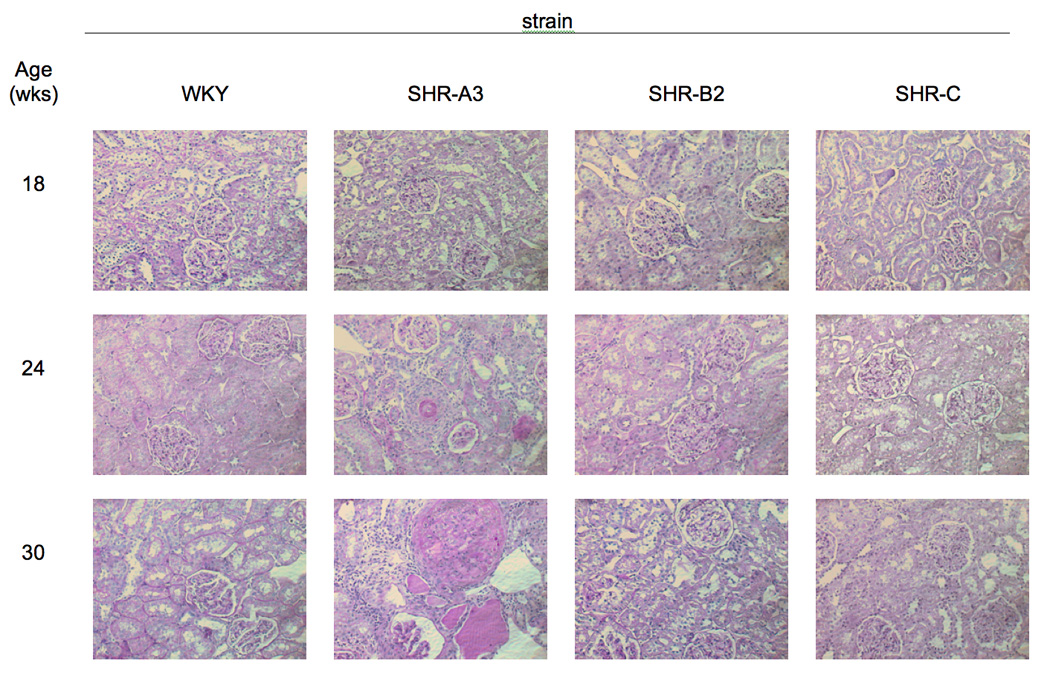
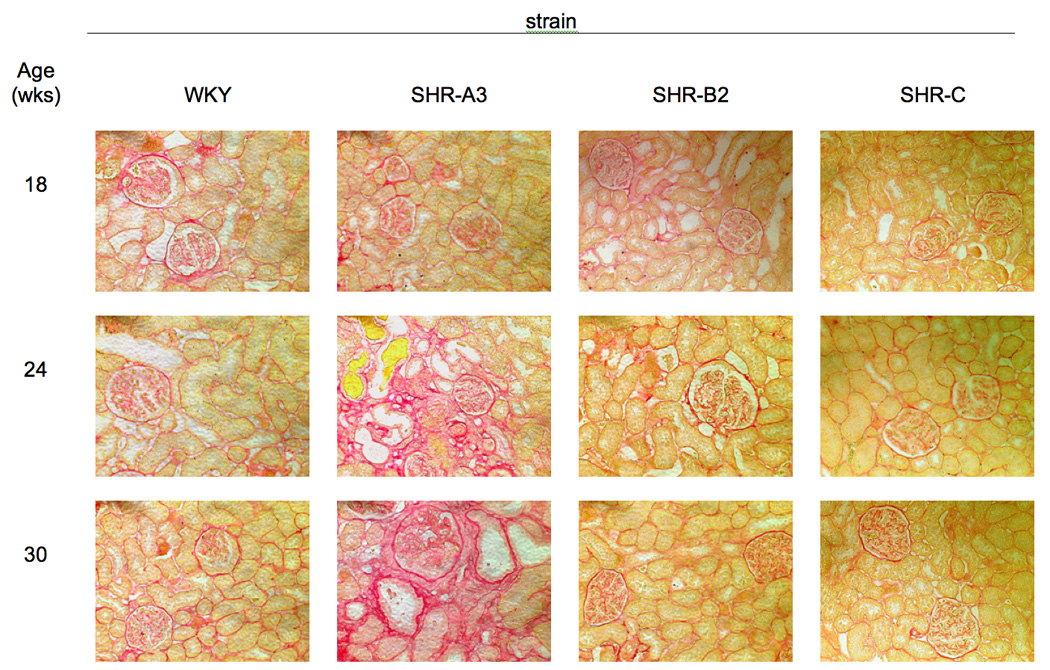
A. Periodic Acid-Schiff stained sections of kidney from 4 rat lines (WKY, SHR-A3, SHR-B2, SHR-C, columns) at 18, 24 and 30wks of age (rows). SHR-A3 demonstrates patchy injury at 24wks of age that is absent at 18wks of age and that increases in extent and severity by 30wks of age. Injury includes glomerular hypercellularity and sclerosis, as well as tubulointerstial inflammation and fibrosis. No similar evidence of renal injury was present in other rats lines. Magnification is eyepiece 10X, objective 20X. B. Picric-acid- Sirius red staining of similar sections as in Fig 1A. Sirius red stains collagen and provides an indication of fibrotic change. Evidence of evidence of increased glomerular and tubular collagen accumulation emerges in the 24wk old SHR-A3 and is largely absent from the other lines which remain free of fibrotic change at least up to 30wks of age.
Studies by others produced no clear consensus whether blood pressure differs between SHR-A3 and injury-resistant SHR lines 4, 18. However, this issue has not been rigorously examined using precise radio-telemetry methods for measuring blood pressure. We made such measurements in SHR-A3 and SHR-B2 animals, recording blood pressure after the maturation of hypertension, but prior to the emergence of renal injury (16–19 wks of age). We observed a small, but statistically significant difference in blood pressure (please see http://hyper.ahajournals.org, Supplemental Table 2)
Expression of redox genes is altered in SHR-A3 prior to the emergence of renal injury
Renal redox stress may contribute to renal injury in hypertension. This suggested the utility of examining changes in gene expression along pathways involved in radical production and mitigation during the development of hypertension in SHR lines that contrast in susceptibility to renal injury. We performed a literature survey and identified 67 genes whose protein products have been implicated either in the processes by which oxidative species are generated or detoxified (please see http://hyper.ahajournals.org, Supplemental Table 1). Representation of these genes on the RG U34A arrays used in the present studies was broad, but incomplete (36 of 67 genes). We studied gene expression prior to the onset of histologically verifiable renal injury, so as to capture changes that may contribute to the initiation of renal injury while avoiding alterations in expression occurring in response to injury.
To assess whether expression of genes involved in redox balance is broadly altered in the renal injury-prone SHR-A3 line, we examined the correlation between expression of individual redox genes in SHR-A3 and the expression of these genes in the other groups of rats (please see http://hyper.ahajournals.org, Supplemental Figure 1 for illustration). Table 1 indicates the result of this analysis comparing SHR-A3 to all other strains at each of the four ages examined. The strong correlation in expression levels among these redox balance genes across rat lines was remarkably eroded in 18 wk old injury-prone SHR-A3 animals, just prior to the emergence of histological renal injury. This suggested a major shift in the regulation of redox balance in 18 wk old SHR-A3 compared with injury-resistant strains. We examined the expression of individual redox genes to assess whether any simple patterns among the genes (radical generating genes predominantly up or down, or detoxification genes up or down) might account for the reduced relationship between SHR-A3 redox pathway gene expression. Many genes in pathways involved in radical detoxification were expressed at substantially lower levels in 18 wk SHR-A3, but there was no evidence for changes in expression of genes involved in radical generation at 18 wks of age (though such genes are not as well represented on the array). Among genes involved in radical detoxification we segregated those genes that were down-regulated in 18wk old SHR-A3, compared with WKY, SHR-B2 and SHR-C. We found that 16 of 28 genes involved in radical mitigation were down-regulated, comparing SHR-A3 with the other strains (p <0.01, ANOVA followed by Tukey HSD test). Overall, this down-regulation was to less than 40% of the level in the reference strain (Figure 2). To validate the altered expression in 18wk old animals, we selected 9 genes to represent the major component pathways of antioxidant defense and re-assessed expression by TaqMan-based quantitative RT-PCR (please see http://hyper.ahajournals.org, Supplemental Table 3 for details). The results supported the conclusion from the array data of down-regulation in SHR-A3 of each one of the genes tested.
Table 1.
Relationship between expression of redox genes in SHR-A3 and injury-resistant SHRB2, SHR-C and normotensive WKY rats.
| Age | ||||
|---|---|---|---|---|
| Comparison | 4wks | 8wks | 12wks | 18wks |
| SHR A3 vs. | R Square |
|||
| SHR B2 | 0.61 | 0.95 | 0.95 | 0.16 |
| SHR C | 0.59 | 0.97 | 0.97 | 0.21 |
| WKY | 0.92 | 0.97 | 0.97 | 0.59 |
Fig 2.
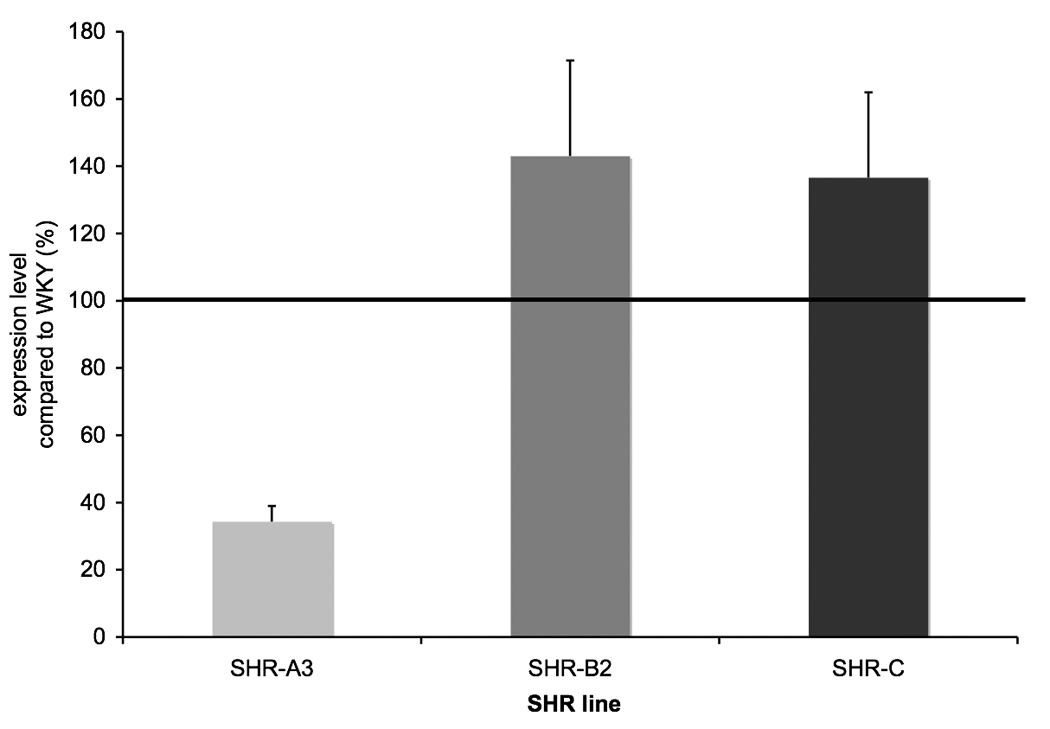
Expression of 16 or 28 genes identified as involved in radical detoxification. For each gene, the expression level for WKY was normalized to 100 and the corresponding value calculated for the remaining rat lines. The group mean value (±SEM) was then calculated across all 16 genes and plotted. ANOVA followed by Tukey’s HSD test was used to determine differences between SHR-A3, SHR-B2 and SHR-C. Significant differences observed were between SHR-A3 and SHR-B2 and SHR-A3 and SHR-C (p<0.01).
The transcription factor HNF1 is an important regulator of redox gene expression in the kidney
The reduced expression in many, but not all, genes involved in radical mitigation suggested a coordinated transcriptional mechanism operating in SHR-A3 and shared by the down-regulated genes. We sought to identify this transcriptional regulation by examining the proximal promoters of each of the genes involved in radical detoxification to compare whether transcription factor-DNA interaction matrix sequences (TFM) occurred with differing frequency when the 16 down-regulated anti-oxidant genes were compared with the 12 anti-oxidant genes that were not down-regulated. Promoters were examined by MatInspector and the TFM’s identified were tabulated. Table 2 shows TFM’s that were disproportionately represented in the down-regulated genes. TFM’s for the important renal transcription factor HNF1 were identified in nearly twice as many down-regulated radical anti-oxidant genes than in such genes that were not down-regulated. Further, the total occurrence of such TFM’s was nearly 5 fold greater in the down-regulated anti-oxidant genes. Generally, the presence of multiple binding sites for a single transcription factor in the promoter of a gene increases the likelihood that the expression of this gene is regulated by the transcription factor 19, 20.
Table 2.
Comparison of the occurrence of transcription factor (TF) matrix sequences in the promoters of redox detoxification genes down-regulated in SHR-A3 with redox scavenging genes not down-regulated. Promoters were assessed to determine, for each gene whether a TF matrix occurred or not in the promoter. For HNF1, nearly twice as many down-regulated detoxification genes contained the HNF1 matrix. Since genes regulated by a TF frequently have multiple occurrences of the matrix corresponding to this TF in the promoter, we then compared the average number of occurrences of each matrix per promoter across the two groups of genes.
| Fold Difference |
||
|---|---|---|
| Matrix | % genes containing matrix | Average copies/gene |
| IRFF | 2.95 | 3.02 |
| SORY | 1.96 | 2.12 |
| HNF1 | 1.84 | 4.91 |
| RORA | 1.84 | 1.84 |
| PBXC | 1.72 | 1.75 |
| E2FF | −1.58 | −1.52 |
The role of HNF1 in the renal regulation of anti-oxidant genes was unexpected as only one of the genes has previously been reported to be subject to HNF1 regulation 21, 22. The identification of a TFM in a promoter suggests a regulatory role that requires confirmation. Evidence that HNF1 TFM’s correspond to evolutionarily conserved regions of the promoter provides further support of a functional role. We used the Consite tool (http://asp.ii.uib.no:8090/cgi-bin/CONSITE/consite) to assess concordance between location of HNF1 TFM’s and evolutionary conservation of the promoter, comparing rat to human promoter sequences 23. The results of this analysis support the idea that HNF1 provides regulation of expression of these genes. Figure 3 illustrates the output of one such analysis.
Fig 3.
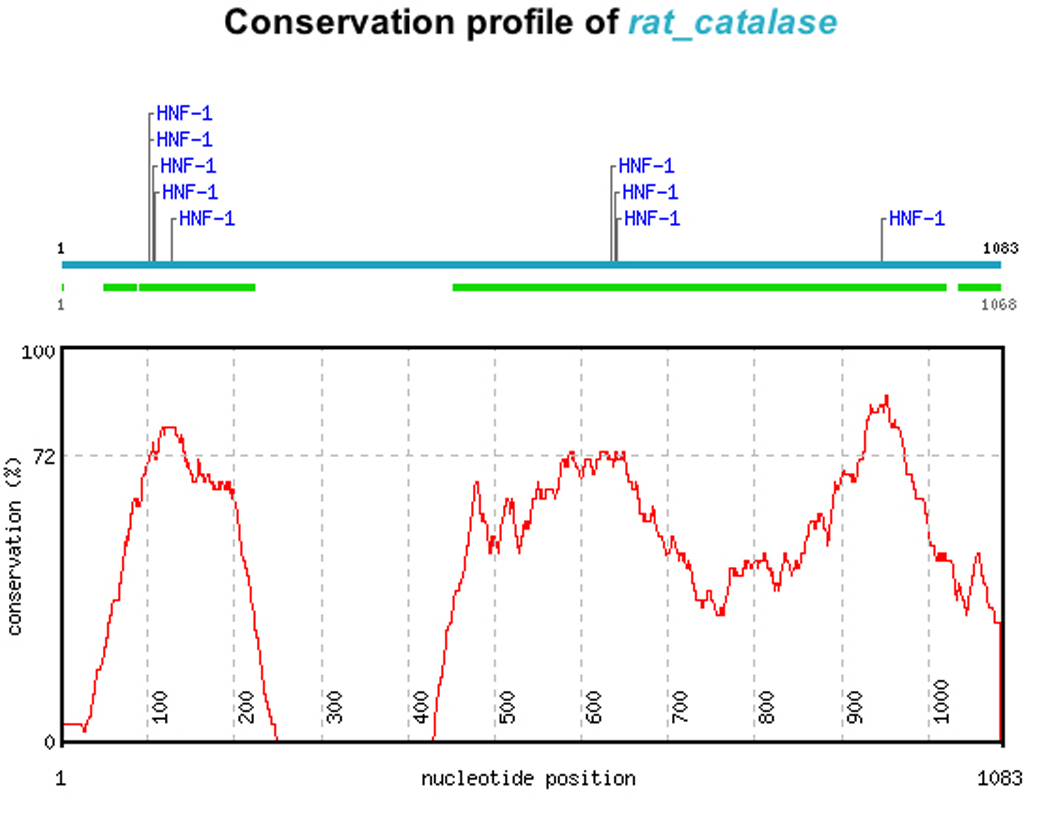
Evolutionary conservation of HNF1 TFM’s demonstrated by comparing the human and rat promoters of down regulated anti-oxidant genes. Catalase is shown for illustration. The location of HNF1 TFM’s in the rat promoter is shown (upper horizontal line), conserved blocks in the human catalase promoter are indicated by the broken lower horizontal line. Overall conservation is shown by the graphed line. The rat HNF1 sites correspond to regions of highest sequence conservation between the rat and the human promoter.
To extend the bioinformatic analysis, we performed gel shift experiments on 5 of the down-regulated genes to determine whether HNF1 TFM-containing regions of the promoters of these genes could bind renal nuclear extract proteins. In each of the genes tested, evidence was obtained to support the capacity of HNF1 sites in the promoters of these genes to bind renal nuclear proteins and this appeared to depend specifically on sequences within the HNF1 TFM, rather than adjacent sequences (please see http://hyper.ahajournals.org, Supplemental Figure 2).
The effect of altered HNF1 control of gene expression in SHR-A3 extends to non-redox genes that are controlled by HNF1
A large set of hepatic genes has been identified and experimentally confirmed as being subject to HNF1 regulation 24. We determined which of these genes were both present on the array and expressed at a level greater than background in the rat kidney. This identified 35 further HNF1-regulated genes, none of which is involved in redox balance. We examined the expression of these 35 genes in 18 wk old SHR-A3 compared with the other strains. If the inference that HNF1 regulation of expression of radical scavenging genes is altered in 18 wk old SHR-A3 is correct, it must also be generalizable to other renal genes regulated by HNF1. We found that expression of these genes in SHR-A3 was significantly lower than in the other lines (68.0% of WKY level, p<0.05, Tukey HSD, Figure 4). The occurrence and frequency of HNF1 TFM’s in the promoters of down-regulated redox genes was similar to that in genes known to be regulated by HNF1 (please see http://hyper.ahajournals.org, Supplemental Table 4).
Fig 4.
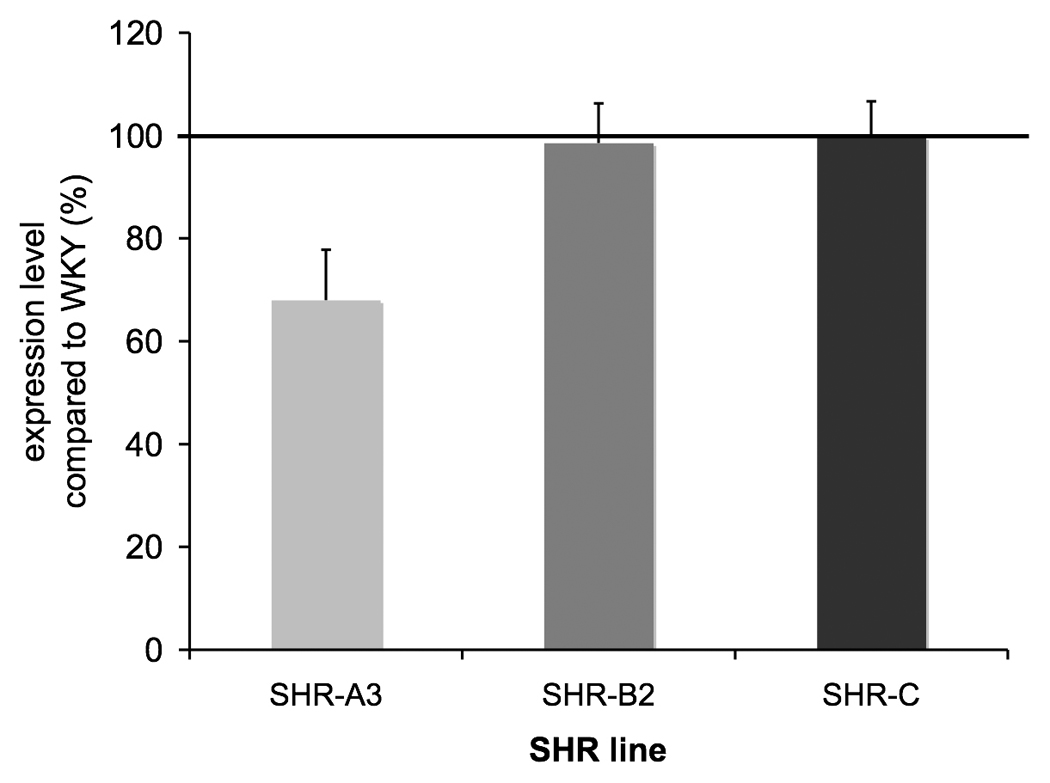
Effects of altered HNF1 regulation of transcription in SHR-A3 kidney are generalized to other genes lying outside pathways of redox balance. We identified 35 genes for which existing evidence of HNF1 regulation existed that were also present on the array and that had renal expression levels higher than background. Normalizing expression of each gene to the corresponding level in WKY, these genes were found to be, on average, expressed at significantly lower levels in SHR-A3 than in SHr-B2 and SHR-C (p<0.05, Tukey HSD test).
HNF1 TFM’s are able to bind two HNF1 proteins encoded by Tcf1 and Tcf2. In kidney Tcf2 is the more abundant isoform and is exclusively nuclear 25, 26. Dimerization of Tcf1 and Tcf2 is facilitated by another protein, Dcoh 27–29. Probes for Tcf1, Tcf2 and Dcoh were present on the array and expression of all three genes was significantly reduced in 18 wk old SHR-A3 compared with the other strains (Figure 5)
Fig 5.
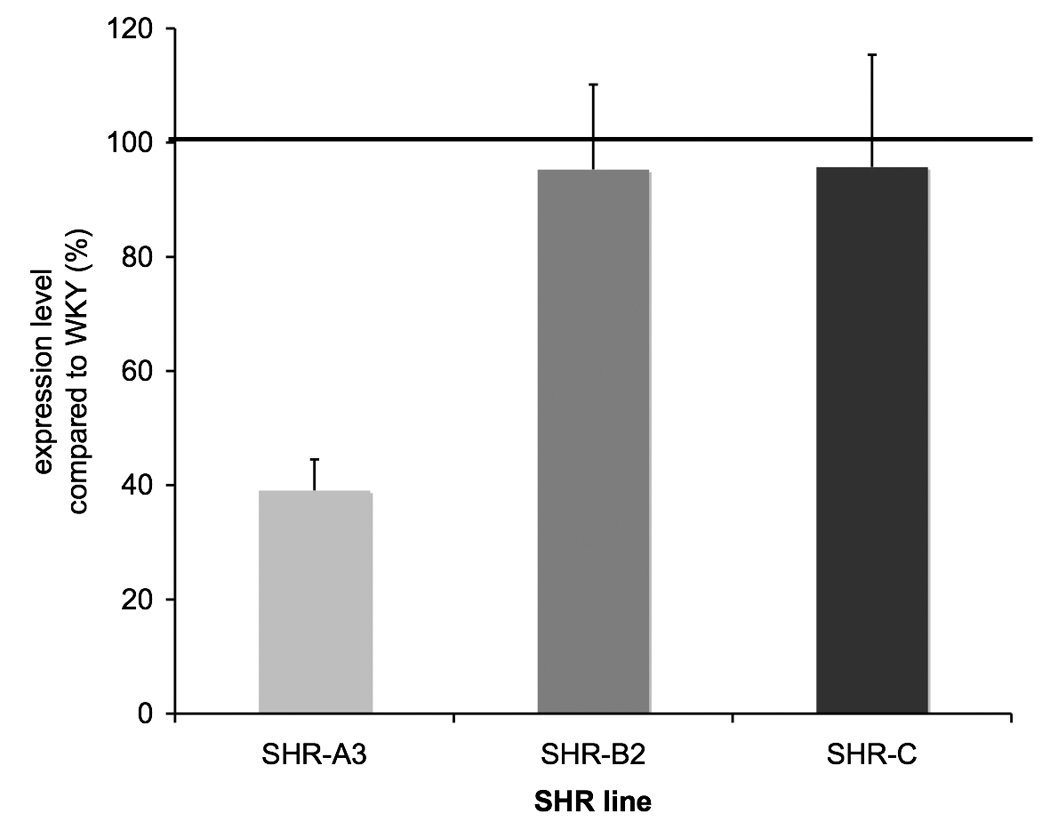
Expression of Tcf1, Tcf2 and Dcoh, each encoding proteins that contribute to the HNF1 transcription factor. Expression levels are normalized to WKY expression as above. Reduced expression of HNF1 component genes suggests that altered expression of HNF1 dependent genes may arise, in part from altered availability of the transcription factor protein.
DISCUSSION
The present studies indicate that a major shift in the control of renal gene expression occurs in the kidney of hypertensive renal–injury prone SHR-A3 rats prior to the emergence of histological indicators of injury. This change in gene expression is mediated by the abundant renal transcription factor, HNF1. The change in HNF1 function is absent in closely related renal injury-resistant SHR lines (SHR-B2 and SHRC) and in the normotensive WKY strain. Altered transcriptional control by HNF1 reduces the renal expression of many genes involved in radical scavenging pathways, suggesting that increased oxidative stress may contribute to the emergence of renal injury. This capacity of HNF1 to affect the expression of anti-oxidant genes in the kidney is new and unexpected and provides an important extension of understanding of the regulation of anti-oxidant gene expression in kidney. While the transcription factor Nrf2 is known to bind to the antioxidant response element present in the promoters of most anti-oxidant genes, there was no difference in the occurrence of this transcription factor recognition site among the anti-oxidant genes that were down-regulated in SHR-A3, compared with those that were not. This suggests that Nrf2 was not the principal mediator of the alteration of anti-oxidant gene expression.
HNF1 affects the expression of a large set of renal genes (including many genes not involved in redox balance) and the present studies are unable to distinguish whether any role played by HNF1 in the emergence of hypertensive renal injury is attributable specifically to altered redox balance. A kidney-specific mouse knock-out model of the major renal HNF1 gene, Tcf2, has recently been reported 30. These mice die rapidly after birth with severely deficient renal function. Furthermore, mutations in Tcf2 are associated with loss of renal function in humans 31. This suggests that the reduction in renal HNF1 in SHR-A3 may compromise renal function in these animals, leading to susceptibility to hypertensive injury.
The origin of altered HNF1 function in SHR-A3 is not clear from these studies. The concurrent effect on expression of all three HNF1-encoding genes (Tcf1, Tcf2 and Dcoh), which are each located on different rat chromosomes, suggests that altered expression of Tcf1, Tcf2 and Dcoh may be the result of an upstream regulatory pathway that spreads its effect across all three of these genes. A possible indication of where such an input might arise emerges from evidence that the hepatic expression of glutathione s-transferase alpha, a negative acute phase protein, is regulated by HNF1 and that this regulation is transmitted through cytokine signaling 21, 32, 33. Given the association with hypertensive renal injury and the infiltration of lymphocytes and macrophages into the renal interstitium 34–36, it may be that renal inflammation contributes to the coordinated down-regulation of HNF1. However, further work will be required to evaluate this possibility.
The present studies uncover a novel biological mechanism linking HNF1 to renal redox balance by which renal function may be compromised in renal injury-prone hypertensive rats. This mechanism occurs prior to the emergence of renal injury and accounts for a substantial shift in the level of expression of a wide range of genes involved in oxidative radical mitigation. By this mechanism, or through other consequences of altered HNF1 function, renal injury may emerge. While the present study reveals the proximal control of altered gene expression by HNF1 in the period immediately preceding the emergence of hypertensive renal injury, it is unable to clarify the mechanisms that lie upstream of these transcriptional changes. In addition, while the changes in renal HNF1 function in SHR-A3 are likely to alter renal function and to reduce renal capacity to detoxify reactive radicals, the present work was not designed in a way that would allow cause and effect relationships to be tested.
Finally, our blood pressure measurements indicate that SHR-A3 experiences slightly higher blood pressure levels than injury-resistant SHR-B2. At present, we cannot say whether the emergence of renal injury is due exclusively to this difference in blood pressure, nor is it clear whether altered HNF1 function contributes to this blood pressure difference. Nonetheless, clear and profound changes in gene expression occur in SHRA3 kidney that are mediated by HNF1, that anticipate hypertensive renal injury and that may reflect a pathway by which injury emerges in this line. The previously unrecognized involvement of HNF1 in renal redox balance and the association between redox stress and progressive renal injury resulting from a wide range of predisposing conditions suggests that this may be an important mechanism by which progressive renal injury emerges.
Perspective
Redox stress has been implicated in the genesis of hypertensive and diabetic renal disease. This study indicates that the SHR-A3 line, an inbred model of hypertension in the rat, experiences hypertensive renal injury without dietary sodium loading. In contrast, other hypertensive SHR lines resist renal injury, in spite of similar levels of hypertension. In SHR-A3, emergence of histological renal injury is preceded by a change in the expression of many renal redox genes, notably those genes involved in antioxidant mechanisms. We have shown that this change is mediated by upstream transcriptional control produced by the abundant renal transcription factor HNF1. Previously, no role of HNF1 in renal redox balance was known. Altered control of expression by HNF1 is further linked to changes in the expression of many genes in pathways outside redox balance. At present it is unclear if these changes are the immediate cause of renal injury, however, a mouse kidney specific knockout of the gene encoding the major renal HNF1 protein, Tcf2, is associated with early renal failure. Thus, these studies propose a novel unifying mechanism linking the initiation of hypertensive renal injury in SHR-A3 to altered renal function mediated by the broad effects of HNF1 on renal gene expression including the expression of antioxidant genes.
Supplementary Material
Acknowledgments
Sources of Funding
This work was supported by grants to PAD (NIH: DDK45538, DDK74680, AHA Texas Affiliate: Grant 0455034Y) and to EB (NIH HL51021).
Footnotes
Disclosures
NONE
REFERENCES
- 1.Satko SG, Sedor JR, Iyengar SK, Freedman BI. Familial clustering of chronic kidney disease. Semin Dial. 2007;20:229–236. doi: 10.1111/j.1525-139X.2007.00282.x. [DOI] [PubMed] [Google Scholar]
- 2.Okamoto K, Aoki K. Development of a strain of spontaneously hypertensive rats. Jpn Circ J. 1963;27:282–293. doi: 10.1253/jcj.27.282. [DOI] [PubMed] [Google Scholar]
- 3.Okamoto K, Yamori Y, Nagaoka A. Establishment of the Stroke-prone Spontaneously Hypertensive Rat (SHR) Circ Res. 1974;14:I143–I153. [Google Scholar]
- 4.Gigante B, Rubattu S, Stanzione R, Lombardi A, Baldi A, Baldi F, Volpe M. Contribution of genetic factors to renal lesions in the stroke-prone spontaneously hypertensive rat. Hypertension. 2003;42:702–706. doi: 10.1161/01.HYP.0000084635.01667.8A. [DOI] [PubMed] [Google Scholar]
- 5.Beisswenger PJ, Drummond KS, Nelson RG, Howell SK, Szwergold BS, Mauer M. Susceptibility to diabetic nephropathy is related to dicarbonyl and oxidative stress. Diabetes. 2005;54:3274–3281. doi: 10.2337/diabetes.54.11.3274. [DOI] [PubMed] [Google Scholar]
- 6.Oberg BP, McMenamin E, Lucas FL, McMonagle E, Morrow J, Ikizler TA, Himmelfarb J. Increased prevalence of oxidant stress and inflammation in patients with moderate to severe chronic kidney disease. Kidney Int. 2004;65:1009–1016. doi: 10.1111/j.1523-1755.2004.00465.x. [DOI] [PubMed] [Google Scholar]
- 7.Shah SV, Baliga R, Rajapurkar M, Fonseca VA. Oxidants in chronic kidney disease. J Am Soc Nephrol. 2007;18:16–28. doi: 10.1681/ASN.2006050500. [DOI] [PubMed] [Google Scholar]
- 8.Fujieda M, Naruse K, Hamauzu T, Miyazaki E, Hayashi Y, Enomoto R, Lee E, Ohta K, Yamaguchi Y, Wakiguchi H, Enza H. Effect of selenium-deficient diet on tubular epithelium in normal rats. Pediatr Nephrol. 2007;22:192–201. doi: 10.1007/s00467-006-0266-4. [DOI] [PubMed] [Google Scholar]
- 9.Reddi AS, Bollineni JS. Selenium-deficient diet induces renal oxidative stress and injury via TGF-beta1 in normal and diabetic rats. Kidney Int. 2001;59:1342–1353. doi: 10.1046/j.1523-1755.2001.0590041342.x. [DOI] [PubMed] [Google Scholar]
- 10.Manning RD, Jr, Tian N, Meng S. Oxidative stress and antioxidant treatment in hypertension and the associated renal damage. Am J Nephrol. 2005;25:311–317. doi: 10.1159/000086411. [DOI] [PubMed] [Google Scholar]
- 11.Trolliet MR, Rudd MA, Loscalzo J. Oxidative stress and renal dysfunction in salt-sensitive hypertension. Kidney Blood Press Res. 2001;24:116–123. doi: 10.1159/000054217. [DOI] [PubMed] [Google Scholar]
- 12.Chabrashvili T, Tojo A, Onozato ML, Kitiyakara C, Quinn MT, Fujita T, Welch WJ, Wilcox CS. Expression and cellular localization of classic NADPH oxidase subunits in the spontaneously hypertensive rat kidney. Hypertension. 2002;39:269–274. doi: 10.1161/hy0202.103264. [DOI] [PubMed] [Google Scholar]
- 13.Schnackenberg CG, Welch WJ, Wilcox CS. Normalization of blood pressure and renal vascular resistance in SHR with a membrane-permeable superoxide dismutase mimetic: role of nitric oxide. Hypertension. 1998;32:59–64. doi: 10.1161/01.hyp.32.1.59. [DOI] [PubMed] [Google Scholar]
- 14.Louis WJ, Howes LG. Genealogy of the spontaneously hypertensive rat and Wistar-Kyoto rat strains: implications for studies of inherited hypertension. J Cardiovasc Pharmacol. 1990;16 Suppl 7:S1–S5. [PubMed] [Google Scholar]
- 15.Constantine VS, Mowry RW. Selective staining of human dermal collagen. II. The use of picrosirius red F3BA with polarization microscopy. J Invest Dermatol. 1968;50:419–423. doi: 10.1038/jid.1968.68. [DOI] [PubMed] [Google Scholar]
- 16.Hinojos CA, Boerwinkle E, Fornage M, Doris PA. Combined genealogical, mapping, and expression approaches to identify spontaneously hypertensive rat hypertension candidate genes. Hypertension. 2005;45:698–704. doi: 10.1161/01.HYP.0000156498.78896.37. [DOI] [PubMed] [Google Scholar]
- 17.Yamori Y, Horie R, Tanase H, Fujiwara K, Nara Y, Lovenberg W. Possible role of nutritional factors in the incidence of cerebral lesions in stroke-prone spontaneously hypertensive rats. Hypertension. 1984;6:49–53. doi: 10.1161/01.hyp.6.1.49. [DOI] [PubMed] [Google Scholar]
- 18.Nagaoka A, Iwatsuka H, Suzuoki Z, Okamoto K. Genetic predisposition to stroke in spontaneously hypertensive rats. Am J Physiol. 1976;230:1354–1359. doi: 10.1152/ajplegacy.1976.230.5.1354. [DOI] [PubMed] [Google Scholar]
- 19.Anderson GM, Freytag SO. Synergistic activation of a human promoter in vivo by transcription factor Sp1. Mol Cell Biol. 1991;11:1935–1943. doi: 10.1128/mcb.11.4.1935. [DOI] [PMC free article] [PubMed] [Google Scholar]
- 20.Chen X, Azizkhan JC, Lee DC. The binding of transcription factor Sp1 to multiple sites is required for maximal expression from the rat transforming growth factor alpha promoter. Oncogene. 1992;7:1805–1815. [PubMed] [Google Scholar]
- 21.Romero L, Higgins MA, Gilmore J, Boudreau K, Maslen A, Barker HJ, Kirby GM. Down-regulation of alpha class glutathione S-transferase by interleukin-1beta in human intestinal epithelial cells (Caco-2) in culture. Drug Metab Dispos. 2002;30:1186–1193. doi: 10.1124/dmd.30.11.1186. [DOI] [PubMed] [Google Scholar]
- 22.Whalen R, Voss SH, Boyer TD. Decreased expression levels of rat liver glutathione S-transferase A2 and albumin during the acute phase response are mediated by HNF1 (hepatic nuclear factor 1) and IL6DEX-NP. Biochem J. 2004;377:763–768. doi: 10.1042/BJ20031256. [DOI] [PMC free article] [PubMed] [Google Scholar]
- 23.Sandelin A, Wasserman WW, Lenhard B. ConSite: web-based prediction of regulatory elements using cross-species comparison. Nucleic Acids Res. 2004;32:W249–W252. doi: 10.1093/nar/gkh372. [DOI] [PMC free article] [PubMed] [Google Scholar]
- 24.Tronche F, Ringeisen F, Blumenfeld M, Yaniv M, Pontoglio M. Analysis of the distribution of binding sites for a tissue-specific transcription factor in the vertebrate genome. J Mol Biol. 1997;266:231–245. doi: 10.1006/jmbi.1996.0760. [DOI] [PubMed] [Google Scholar]
- 25.Lazzaro D, De Simone V, De Magistris L, Lehtonen E, Cortese R. LFB1 and LFB3 homeoproteins are sequentially expressed during kidney development. Development. 1992;114:469–479. doi: 10.1242/dev.114.2.469. [DOI] [PubMed] [Google Scholar]
- 26.Ott MO, Rey-Campos J, Cereghini S, Yaniv M. vHNF1 is expressed in epithelial cells of distinct embryonic origin during development and precedes HNF1 expression. Mech Dev. 1991;36:47–58. doi: 10.1016/0925-4773(91)90071-d. [DOI] [PubMed] [Google Scholar]
- 27.Bach I, Mattei MG, Cereghini S, Yaniv M. Two members of an HNF1 homeoprotein family are expressed in human liver. Nucleic Acids Res. 1991;91:3553–3559. doi: 10.1093/nar/19.13.3553. [DOI] [PMC free article] [PubMed] [Google Scholar]
- 28.Rey-Campos J, Chouard T, Yaniv M, Cereghini S. vHNF1 is a homeoprotein that activates transcription and forms heterodimers with HNF1. Embo J. 1991;10:1445–1457. doi: 10.1002/j.1460-2075.1991.tb07665.x. [DOI] [PMC free article] [PubMed] [Google Scholar]
- 29.Mendel DB, Khavari PA, Conley PB, Graves MK, Hansen LP, Admon A, Crabtree GR. Characterization of a cofactor that regulates dimerization of a mammalian homeodomain protein. Science. 1991;254:1762–1767. doi: 10.1126/science.1763325. [DOI] [PubMed] [Google Scholar]
- 30.Gresh L, Fischer E, Reimann A, Tanguy M, Garbay S, Shao X, Hiesberger T, Fiette L, Igarashi P, Yaniv M, Pontoglio M. A transcriptional network in polycystic kidney disease. Embo J. 2004;23:1657–1668. doi: 10.1038/sj.emboj.7600160. [DOI] [PMC free article] [PubMed] [Google Scholar]
- 31.Bingham C, Hattersley AT. Renal cysts and diabetes syndrome resulting from mutations in hepatocyte nuclear factor-1beta. Nephrol Dial Transplant. 2004;19:2703–2708. doi: 10.1093/ndt/gfh348. [DOI] [PubMed] [Google Scholar]
- 32.Ng L, Nichols K, O'Rourke K, Maslen A, Kirby GM. Repression of human GSTA1 by interleukin-1beta is mediated by variant hepatic nuclear factor-1C. Mol Pharmacol. 2007;71:201–208. doi: 10.1124/mol.106.028563. [DOI] [PubMed] [Google Scholar]
- 33.Voss SH, Whalen R, Boyer TD. Mechanism of negative regulation of rat glutathione S-transferase A2 by the cytokine interleukin 6. Biochem J. 2002;365:229–237. doi: 10.1042/BJ20011514. [DOI] [PMC free article] [PubMed] [Google Scholar]
- 34.Mervaala EM, Muller DN, Park JK, Schmidt F, Lohn M, Breu V, Dragun D, Ganten D, Haller H, Luft FC. Monocyte infiltration and adhesion molecules in a rat model of high human renin hypertension. Hypertension. 1999;33:389–395. doi: 10.1161/01.hyp.33.1.389. [DOI] [PubMed] [Google Scholar]
- 35.Rodriguez-Iturbe B, Pons H, Herrera-Acosta J, Johnson RJ. Role of immunocompetent cells in nonimmune renal diseases. Kidney Int. 2001;59:1626–1640. doi: 10.1046/j.1523-1755.2001.0590051626.x. [DOI] [PubMed] [Google Scholar]
- 36.Romero F, Rodriguez-Iturbe B, Parra G, Gonzalez L, Herrera-Acosta J, Tapia E. Mycophenolate mofetil prevents the progressive renal failure induced by 5/6 renal ablation in rats. Kidney Int. 1999;55:945–955. doi: 10.1046/j.1523-1755.1999.055003945.x. [DOI] [PubMed] [Google Scholar]
Associated Data
This section collects any data citations, data availability statements, or supplementary materials included in this article.


