

Abstract
The planned expansion of biofuel plantations in Brazil could potentially cause both direct and indirect land-use changes (e.g., biofuel plantations replace rangelands, which replace forests). In this study, we use a spatially explicit model to project land-use changes caused by that expansion in 2020, assuming that ethanol (biodiesel) production increases by 35 (4) x 109 liter in the 2003-2020 period. Our simulations show that direct land-use changes will have a small impact on carbon emissions because most biofuel plantations would replace rangeland areas. However, indirect land-use changes, especially those pushing the rangeland frontier into the Amazonian forests, could offset the carbon savings from biofuels. Sugarcane ethanol and soybean biodiesel each contribute to nearly half of the projected indirect deforestation of 121,970 km2 by 2020, creating a carbon debt that would take about 250 years to be repaid using these biofuels instead of fossil fuels. We also tested different crops that could serve as feedstock to fulfill Brazil’s biodiesel demand and found that oil palm would cause the least land-use changes and associated carbon debt. The modeled livestock density increases by 0.09 head per hectare. But a higher increase of 0.13 head per hectare in the average livestock density throughout the country could avoid the indirect land-use changes caused by biofuels (even with soybean as the biodiesel feedstock), while still fulfilling all food and bioenergy demands. We suggest that a closer collaboration or strengthened institutional link between the biofuel and cattle-ranching sectors in the coming years is crucial for effective carbon savings from biofuels in Brazil.
Keywords: deforestation, integrated assessment, livestock, policy analysis, Global Environment Outlook 4
Brazil’s government and biofuel industry are planning a large increase in the production of biofuels in the next 10 years. This increase is driven by internal and external market demand (ethanol), as well as by government-enforced blending (biodiesel) (1 –3). Although Brazilian sugarcane ethanol is often considered to have one of the best production systems with respect to carbon savings (4 –8), there are concerns about the land-use changes (LUC) that would be incurred by an expansion of biofuel croplands (6, 7). Soybean plantations, from which most of the Brazilian biodiesel is produced (1, 3), already occupy 35% of the country’s cultivated land (9). It is known that biofuels can replace vast areas of farmland and native habitats, driving up food prices and resulting in little reduction of or even increasing greenhouse gas (GHG) emissions (6, 7, 10 –15).
Previous studies focused on the direct land-use changes (DLUC) and the “carbon debt” caused by the replacement of native habitats by biofuel crops in Brazil (7, 8, 10, 11). Others pointed to the probable indirect land-use changes (ILUC) in Brazil caused by future expansion of biofuel croplands in the United States (14 –16). Overall, these studies show that potential LUC must be taken into account to assess the efficacy of a given biofuel. However, these studies were neither spatially explicit, nor did they explicitly consider competition between different land uses in view of concurrent food and biofuel demands. Fargione et al. (7), for example, show the LUC carbon debt in terms of rate (e.g., MgCO2 ha−1), since they did not consider the total extent of land dedicated to biofuels or the total area of native habitats affected. Therefore, the net debt in absolute terms (e.g., MgCO2) arising from future biofuel production remains undetermined. Moreover, the cascade effect of biofuel crops pushing the agricultural and cattle ranching frontier is still poorly understood.
Most of Brazil’s sugarcane expansion in the last 5 years occurred on land previously used as rangeland in the southeastern states (11, 17). The same holds true for more than 90% of the soybean plantations in the Amazon region after the 2006 moratorium was implemented (18). One of the potential consequences of such LUC is the migration of cattle ranchers to other regions and possible increased deforestation (16, 19 –21). In light of the role rangeland plays in deforestation in Brazil (16, 19 –21) and the steadily increasing cattle herd [average of 3 million additional head per year in the 1974–2007 period (9)], the ILUC to replace rangeland displaced by biofuels are highly important (22).
In this study we use a spatially explicit modeling framework to project the DLUC and ILUC arising from the fulfillment of Brazil’s biofuel production targets for 2020 concurrent with increasing food and livestock demands. This modeling framework comprises: (i) a land-use/land-cover change model for land-use suitability assessment and allocation (23); (ii) a partial equilibrium model of the economy of the agricultural sector for future food and livestock demands as well as technological improvements of crop yields (24); and (iii) a dynamic global vegetation model for crop and grassland potential productivity driven by climate (25, 26). Competition among land uses (for land resources) is considered based on a multicriteria evaluation of suitability, hierarchical dominance of major land-use activities (settlement, crop cultivation, grazing), and a multiobjective land allocation algorithm which looks for land-use pattern stability. Final outputs of this modeling framework are maps of land use and livestock density (Ld). DLUC and ILUC are determined by comparing land-use maps derived from scenarios with and without biofuel expansion. A number of different scenarios are considered to assess the isolated contribution of ethanol and biodiesel fuel production, as well as their impacts on different native habitats. The carbon debt and payback time from such LUC are calculated by using the average emission values employed by Fargione et al. (7). We investigate only the effects of ILUC inside Brazil. We do not consider cellulosic biofuels because the technological development of these fuels is unlikely to be fast enough to enable their large scale use in Brazil by 2020 (27).
Results
Direct Land-Use Changes.
Our simulations with increased biofuel production show that the expansion of sugarcane plantations in response to increased ethanol production would take place mostly in the southeastern states (São Paulo, Minas Gerais, Rio de Janeiro, Paraná) and, to a lesser extent, in northeast Brazil (Figs. 1 and 2 and Table 1). The expansion of soybean plantations in response to increased biodiesel production would happen mainly in the states of Mato Grosso, Mato Grosso do Sul, Goiás, and Minas Gerais. Sugarcane and soybean have potential yield increases of 31.4 and 0.8 Mg/ha, respectively (Table S1). To fill the biofuel production targets for 2020, sugarcane would require an additional 57,200 km2 and soybean an additional 108,100 km2. Roughly 88% of this expansion (145,700 km2) would take place in areas previously used as rangeland. Food cropland area replaced by biofuels would reach 14,300 km2. In our simulations, direct deforestation is only caused by soybean biodiesel and amounts to only 1,800 km2 of forest and 2,000 km2 of woody savanna. Carbon emissions as a result of DLUC would originate mainly from soil carbon losses when converting rangeland to sugarcane or soybean plantations.
Fig. 1.

Modeled direct (A) and indirect (B) LUC caused by the fulfillment of Brazil’s biofuel (sugarcane ethanol and soybean biodiesel) production targets for 2020.
Fig. 2.

Direct, indirect, and total LUC areas (A), carbon debt (B), and time to repay debt (C) for fulfilling Brazil’s biofuel (sugarcane ethanol and soybean biodiesel) production targets for 2020. Here the land-use category “cropland” excludes sugarcane and soybean. Other nat. veg., other natural vegetation; W. savanna, woody savanna.
Table 1.
Land-use and land-use change (relative to 2003) according to different modeled scenarios for Brazil in 2020
| Soybean |
Sugarcane |
Other crops |
Rangeland |
Forest |
Other natural |
Livestock density |
|
| Scenario | x1,000 km2 (Δ03–20, %) | x1,000 km2 (Δ03–20, %) | x1,000 km2 (Δ03–20, %) | x1,000 km2 (Δ03–20, %) | x1,000 km2 (Δ03–20, %) | x1,000 km2 (Δ03–20, %) | head/ha (Δ03–20, %) |
| 2003 | 191 (—) | 55 (—) | 389 (—) | 2,133 (—) | 4,194 (—) | 1,496 (—) | 0.70 (—) |
| 2020 biofuel targets | 285 (+49.3) | 90 (+63.6) | 397 (+2.1) | 2,972 (+44.3) | 3,546 (−15.4) | 1,222 (−21.6) | 0.79 (+12.3) |
| 2020 no biofuel expansion | 178 (−6.9) | 33 (−39.9) | 398 (+2.4) | 2,968 (+44.1) | 3,668 (−12.5) | 1,268 (−18.7) | 0.79 (+12.5) |
| 2020 ethanol targets only | 178 (−6.8) | 90 (+62.8) | 398 (+2.4) | 2,973 (+44.3) | 3,618 (−13.7) | 1,255 (−19.5) | 0.79 (+12.3) |
| 2020 biodiesel targets only | 285 (+49.5) | 33 (−39.7) | 396 (+2.0) | 2,968 (+44.1) | 3,598 (−14.2) | 1,232 (−21.0) | 0.79 (+12.5) |
| 2020 biofuel targets no ILUC | 285 (+49.3) | 90 (+63.6) | 397 (+2.1) | 2,807 (+36.2) | 3,668 (−12.5) | 1,268 (−18.7) | 0.83 (+18.9) |
ha, hectare (equivalent to 1 hm2).
A payback time of 4 years would be necessary to compensate for the sugarcane DLUC emissions with the use of sugarcane ethanol instead of fossil fuels. For soybean biodiesel, DLUC carbon emissions would not be paid back for at least 35 years, primarily because the annual per hectare carbon savings from soybean biodiesel are much smaller than from sugarcane. Despite an increase of 86% in food demand, 4% of the cultivated land (26,000 km2) is spared in the scenario without the expansion of biofuel croplands (in comparison with 2003) because of higher crop yields driven by technological improvements and climate change (Tables S1 and S2).
Indirect Land-Use Changes.
ILUC could considerably compromise the GHG savings from growing biofuels, mainly by pushing rangeland frontier into the Amazon forest and Brazilian Cerrado savanna. In our simulations, there is an expansion of 121,970 km2 of rangeland into forest areas, and 46,000 km2 into other native habitats, due to the expansion of biofuel croplands (Table 1). Modeled country-wide average Ld increases by 0.09 head per hectare in the 2003 to 2020 period if ILUC by biofuels are not avoided, because of the occupation of more (potentially) productive grid cells in the Amazon region. Sugarcane ethanol and soybean biodiesel would be responsible for 41% and 59% of this indirect deforestation, respectively. These percentages were determined by fulfilling only the demand for sugarcane ethanol, while keeping soybean biodiesel production at current levels and vice-versa. Higher potential productivity of grass favors allocation of rangelands in Amazonia instead of in other native habitats. However, when comparing the scenarios with and without increased biofuel production, the displacement of rangelands previously located in high productivity sites in Southeast Brazil to lower productivity sites in Central Brazil causes the newly allocated rangeland area [170,370 km2 (71.9 by sugarcane + 98.5 by soybean)] to be higher than that displaced by biofuels [145,700 km2 (52.7 by sugarcane + 93.0 by soybean)]. Ld increase is 0.001 head per hectare higher in the scenario without increased biofuel production than in the scenario with increased biofuel production. Food croplands displaced by biofuels are not necessarily cultivated in land farther away from cities, and in fact the mean distance of the displaced food croplands to the largest cities is reduced by 17%. It is important to stress that we are not trying to pinpoint the exact places to be indirectly affected by the expansion of biofuel croplands with Fig. 1B, as this map is only the difference between the land-use maps with and without biofuels in 2020 (Fig. S1). Instead, it should be regarded as a spatial evidence of the magnitude that the ILUC might have in the near future because of an expansion of biofuel plantations. The consideration of carbon emissions from ILUC would extend the payback time for sugarcane ethanol by an additional 40 years and for soybean biodiesel by 211 years. Therefore, the payback time for the total LUC (DLUC + ILUC) for sugarcane and soybean would be 44 and 246 years, respectively.
Although the area dedicated to rangeland does not differ greatly between the scenarios with and without increased production of biofuels, the extent of native habitats that are displaced by rangeland is considerably different (Table 1). Therefore, avoiding ILUC by biofuels would demand a smaller increase in rangeland area (∼8% less rangeland compared to the 2020 scenario with ILUC). To achieve such a reduction in rangeland area but still meet the same livestock demand, Ld would need to be increased by 0.13 head per hectare in comparison with 2003 values.
Other Biodiesel Feedstocks.
It can be argued that soybean is not the most efficient feedstock for biodiesel because it occupies large tracts of land, incurs considerable carbon debt (even without considering ILUC), and has a low annual rate of saved carbon from replacing fossil diesel. Therefore, we tested other feedstock options that could serve to fulfill Brazil’s 2020 production demand for biodiesel. Our results show (Fig. 3 and Fig. S2) that if the smallest area and carbon debt from LUC are given priority, then oil palm would be the best feedstock for biodiesel by far. Because of its high oil yield, oil palm would need only 4,200 km2 to fulfill the 2020 demand for biodiesel in Brazil. In comparison, 108,100 km2 would be needed for soybean, 73,000 km2 for rapeseed/sunflower, and 31,700 km2 for Jatropha curcas. The payback time for oil palm would be 7 years for DLUC, which is much smaller than the DLUC payback time of 27 years for sunflower/rapeseed. However, if oil palm is strictly planted only in rangeland areas, the DLUC payback time would be reduced to 4 years. Sunflower/rapeseed plantations would be located mainly in south-central states. Jatropha curcas plantations, which were forced to occur only in Northeast Brazil in our simulations (Methods), are concentrated in the coastal area, where potential yields are higher. Oil palm plantations would be located entirely in Pará state, close to the Amazon forest and where most current plantations are located (9). Oil palm would incur some direct deforestation (300 km2), although much less than that directly caused by soybean. If oil palm is used as biodiesel feedstock in conjunction with sugarcane for ethanol, then Ld would need to be increased by only 0.10 head per hectare from 2003 to 2020 to avoid ILUC, compared to the 0.13 head per hectare increase needed for the soybean-sugarcane combination.
Fig. 3.

Fulfilling Brazil’s biodiesel production target for 2020 with different feedstocks: (A) soybean, (B) sunflower/rapeseed, (C) Jatropha curcas, (D) oil palm. (red) Direct land-use changes; (blue) indirect land-use changes (see Fig. S2 for carbon debt and payback time).
Discussion
Our results show that sugarcane-ethanol and oil palm-biodiesel grown in Brazil are the best plant feedstocks in terms of carbon savings for fulfilling the country’s demand for biofuels in 2020, assuming that the LUC associated with the increased production are restricted to the DLUC in rangelands. The simulated DLUC, which occur predominantly in rangelands, have already been observed for sugarcane (9, 11, 17) and soybean (16, 18, 19) in recent years. For sugarcane, this trend will probably continue in the next years because of the growing number of standards being imposed on sugarcane plantations (2, 28). However, the proximity of sugarcane plantations to Atlantic forest remnants in Southeast Brazil is of particular concern, considering that any further deforestation there would have major impacts on the biodiversity and connectivity of this highly threatened forest (29). The moratorium on soybean introduced in 2006 has proven to be an efficient way for preventing deforestation directly caused by soybean production in the Amazon region (18). Moreover, increasing pressure by the media and nongovernmental organizations (30) suggests that the moratorium will continue to be respected in the coming years. Even though oil palm is strongly associated with deforestation in Southeast Asia (31), the Brazilian palm oil production is still small and could be expanded into nonforest sites, assisted by improved governance in the Amazon region (32, 33).
The efficacy of biofuels in Brazil can be considerably compromised if biofuel-related ILUC, namely moving the rangeland frontier into native habitats, take place as projected here. It has been suggested that ILUC indeed occur in the Amazon region, especially the case where rangeland is shifted by soybean and reestablished elsewhere closer to the deforestation frontier (16, 19 –21). However, to our knowledge there has been no research quantifying these ILUC and establishing their cause–effect relationships. Therefore, although difficult to validate, the ILUC driven by biofuels projected in our simulations is a hypothesis that cannot be disregarded and may indeed happen in the next years. The question, then, is whether all of the displaced rangeland will need to be reallocated and where this will happen. Roughly 36% of the national cattle herd and rangeland area is currently located in the Brazilian Amazon region, the only region in Brazil that has experienced an increase of rangeland area in the last two decades (9, 34). In part, this suggests that the expansion of cultivated land in other regions of Brazil is pushing the rangeland frontier into the Amazon forest. Steady annual deforestation rates of the Brazilian Cerrado savanna indicate that this sort of ILUC may also be happening in Central Brazil (12), despite a decrease in the area of rangeland there (9).
Animal acquisition is heavily subsidized in Brazilian cattle ranching, especially in the Amazon region, but very few incentives are provided specifically for the recovery of degraded pastures and intensification of grazing (16, 34, 35). Moreover, land tenure issues do not encourage the intensification of cattle ranching in the region. For example, in many cases Ld is kept at a minimum level only to guarantee ownership over public land (16, 34, 35). Roughly 290,000 km2 of land, equivalent to 15% of the currently grazed rangeland, was once grazed in Brazil and is now abandoned (36). Furthermore, up to 60% of the currently grazed rangeland face some form of degradation and could have its productivity improved (37). In that sense, our results (LUC and carbon debt) can be regarded as conservative because rangeland degradation processes, which would increase land requirements for livestock, are not considered in our simulations. If we assume that all rangeland areas will be well-managed, meaning that there will be no soil carbon losses (38), then the overall carbon debt would be reduced only by 13% because most of the carbon lost in the LUC at forest areas is stored in the vegetation. Still, studies suggest that technological innovation or the intensification of livestock inside the Amazon region may increase the attractiveness of cattle ranching there and further stimulate deforestation (35, 39). Therefore, an increase in livestock intensity in Brazil by 0.13 head per hectare, as proposed here, is perfectly possible from a biophysical point of view with the enhancement of grass productivity and introduction of innovative management practices (37). From a socioeconomic point of view, however, increasing Ld in Brazil involves complex interactions between granting the right subsidies (34), governance over land ownership (19, 33), and an increased interconnection between land-use sectors (this latter proposed in this study). We argue that to avoid the undesired ILUC by biofuels presented here, strategies for cooperation between the cattle ranching and biofuel-growing sectors should be implemented by the biofuel sector (based on the sector’s own interest in minimizing GHG emissions), and institutional links between these two sectors should be strengthened by the government. For example, biofuel growers should be able to track the amount of displaced cattle when the rangeland-to-biofuel crop transition takes place and guarantee that this demand will be compensated elsewhere in more intensified conditions. In other words, biofuel organizations and the government should support initiatives toward modernization of the cattle ranching sector to guarantee that the production of biofuels is not causing ILUC, which would compromise the efficacy (in terms of carbon savings) of their own product. Such a requirement should also be considered as a standard for the production of sustainable biofuels (28).
In fact, our results could be worse in view of the somewhat optimistic increases in potential crop yields projected because of technological improvements compared to the crop yield changes observed in the last 20 years. For example, in our simulations technological improvements increase sugarcane yields by 26.9 Mg/ha in the 2003 to 2020 period, compared to the 12.6 Mg/ha increase observed in the last 20 years (Table S1). Such optimistic yield increases are bound to the storyline of the scenario used here (Methods), which, besides predicting a high use of biofuels, also predicts high investments in yield enhancements. If we assume that there will be no enhancements of potential yields until 2020, then the payback time of the DLUC (ILUC) carbon debt would increase to 6 (62) and 50 (301) years for sugarcane and soybean, respectively. In that case, Ld would need to be increased by 0.14 head per hectare to avoid ILUC, compared to the 0.13 head per hectare calculated for 2020 with the yield improvements shown in Table S1. In addition, we do not account for fertilizer and water requirements associated with these yield improvements (22). Overall, our study should be viewed as the lower limit of the probable effects of biofuels on LUC in Brazil, because we predict substantial ILUC, even with optimistic assumptions (e.g., no rangeland degradation and high-yield improvements).
Finally, the efficacy of biofuels is analyzed here in terms of GHG savings and not from the socioeconomical perspective. As a counterpart to the ethanol production chain, Brazil’s National Program on Biodiesel Production seems to aim at promoting small-scale farming and shortening dependence on conventional diesel (3). However, between 75 and 95% (depending on the year) of the biodiesel produced in Brazil so far comes from soybean grown on plantations that are owned or controlled by large-scale farmers, and at production costs that are higher than for production of fossil diesel (1, 16, 19). Comprehensive assessments of labor conditions, land division, food prices, and other socioeconomical implications arising from the expansion of biofuels in Brazil are yet to be done. Nevertheless, joining life-cycle assessment figures to spatially explicit LUC projections, like the present study does, allows for a more accurate evaluation of the efficacy of biofuels in terms of carbon savings.
Methods
Modeling Framework.
The central part of our modeling framework is the LandSHIFT model, which simulates land-use and land-cover change in a spatially explicit way at a resolution of 5 arc minutes (23). The model relies on a “land-use systems” approach that describes the interplay between anthropogenic and environmental system components as drivers for LUC in three major land-use activities (settlement, crop cultivation, and grazing) and their competition for land resources. It calculates not only the occurrence of grazing but also the intensity at which it occurs. LandSHIFT has been applied and validated in assessments of the impact of grazing management in the Jordan River region (40) and quantification of future LUC and water use by agriculture in Africa (41). The framework also comprises other models that, although not coupled to LandSHIFT, provide inputs to the model. The International Model for Policy Analysis of Agricultural Commodities and Trade (IMPACT) (24) calculates future country-level food demands and technological improvements of crop yields, and the International Futures model (42) projects population growth. The LPJ for managed Lands (LPJmL) dynamic global vegetation model is used to calculate crop and grassland potential productivity on a 0.5° resolution grid (25, 26). Starting from an initial land-use map, the spatial allocation of different land uses in subsequent time steps is based on a multicriteria-suitability analysis following the equation:
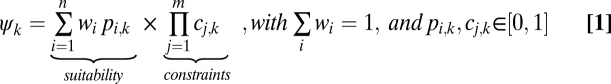 |
where the factor-weights wi determine the importance of each suitability factor pi at grid cell k, and cj determines constraints for changing the land-use type at that given cell. In this study, pi includes potential crop/grassland yield, slope, proximity to settlements, proximity to cropland, road network, and soil fertility (the latter does not apply for grazing). Therefore, n = 6 (5 for grazing). The weights wi for cropland were determined with the use of the analytic hierarchy process test (43). In the SI Text we describe the determination of the relative importance of each pi factor in relation to the others, which is used as an entry to the analytic hierarchy process test. Weights for road network, slope, and soil were fine-tuned from 0.23 to 0.13, from 0.18 to 0.23, and from 0.23 to 0.29, respectively (Table S3), to improve spatial distribution of croplands inside the country. The weights wi for rangeland were assigned all of the same value (0.2). Constraints cj are applied in cells that are designated as conservation areas or according to the land use transition in question (Table S4). A third “constraint” was implemented for sugarcane and soybean. This constraint represents the preferential occurrence of these crops in places where specific infrastructure is or will be implemented [such as ethanol mills (5)] or as in the case of soybean, where production costs are lower (3) and there is political facilitation for the cultivation of soybean (16, 19). The suitability for sugarcane is increased by 35% in the states of São Paulo, Minas Gerais, Mato Grosso do Sul, Goiás, and Distrito Federal. Suitability for soybean is increased by 35% in the states of Goiás, Tocantins, Mato Grosso do Sul, and Distrito Federal. In Mato Grosso, suitability is increased by 80%. These values were chosen to better reproduce the area of sugarcane and soybean in these states (Model Evaluation in the SI Text). The allocation algorithm assumes that crop cultivation takes place on the most suitable cells for each crop type and calculates a “quasi-optimum” spatial crop distribution. However, the multiobjective land allocation heuristic used here seeks pattern stability and respects previous land use, even if another crop type has a higher suitability in that cell (Table S4). Besides soybean and sugarcane, nine other major crop types are considered, including maize, pulses, rice, and wheat. LPJmL yields are applied a crop-specific factor to match current crop yields to statistics on the country level (Table S1) (23, 44). These factors, which are calculated at the first simulation time step, account for uncertainties because of crop management, (e.g., multicropping), or discrepancies because of the aggregation of crop types into the LPJmL crop functional types (e.g., LPJmL pulses refer to extratropical pulses, such as lentils). Crop production of a given grid cell k is defined as the potential crop yield at k multiplied by the area in k that is not covered by settlement.
Allocation of rangeland relies on the potential productivity of grass in the grid cells, based on a livestock feed supply-demand logic. Forage supply is calculated by summing up the grass productivity of every rangeland cell multiplied by the fraction of biomass that can be used by livestock [grazing efficiency ge = 0.3 (45)]. Forage demand is determined by the multiplication of the total livestock herd by the average forage consumption per livestock unit [4.6 Mg/yr (46, 47)]. We assume that 95% of the livestock demand is fulfilled by forage from pastures (47). If forage demand is higher than the supply, then new rangeland cells are allocated, starting from grid cells with higher suitability and continuing until demand is fulfilled. Average Ld is calculated by dividing the total livestock herd by the rangeland area. Preferential allocation of land-use activities follows the order: settlement, crop cultivation, grazing. Only one dominant land-use type can occur in a grid cell.
Input Data and Modeling Protocol.
LandSHIFT is initialized with a combined map of land cover and land use for the year 1992 (48), a map of population density (49), and national statistics of crop production and livestock herd (44). Socioeconomic projections include future demands for food production, technological improvements of crop yields (24), and population growth (42) generated for the United Nations Environment Programme’s Global Environmental Outlook 4 (GEO4) report under the Sustainability First scenario (50). We focus our analysis on this scenario because it predicts the highest use of biofuels worldwide by far and the largest increase in food production in Brazil (50). For the sake of scenario consistency, future potential crop and grassland productivity was calculated with the LPJmL model (25, 26) in 0.5° spatial resolution using as input a climatology of temperature, precipitation, and [CO2] from the IMAGE model (51), which was also generated for the GEO4 report (50). The Sustainability First scenario used here depicts a global mean increase in temperature of 1.1 °C in 2020 in relation to preindustrial times and an atmospheric CO2 concentration of 426 ppm (50). There is a national population increase from 177 million people in 2003 to 202 million in 2020, with an average growth rate of 1.62% per year (42). Oil palm yields, which are not modeled by LPJmL, are simulated by applying a factor of 6.0 to the yields of the tropical roots crop functional type. Resulting yields are in accordance with oil palm yields in Brazil from census data for the 1990s (9) (Northeastern Pará: simulated = 11.4 Mg/ha, census = 13.6 Mg/ha; eastern Bahia: simulated = 3.3 Mg/ha, census = 4.1 Mg/ha; roughly 99% of Brazil’s oil palm area is located in these two regions). Average potential yields for the 1990s are used as baseline yields in LandSHIFT (Table S1). On average, food production increases by 86% in the 2003 to 2020 period (Table S2), and yields increase, on average, by 62% because of the combined effects of technological improvements and climate change (Table S1). Livestock herd grows from 149 million head in 2003 to 234 million head in 2020, with an annual increase of 3.4%. This increase rate is slightly larger than the 3.25% average annual growth rate observed over the last 30 years (9).
Biofuel production follows the official projections by the Brazilian government and the biofuel industry (1, 2) (Table S5). Demands for food and biofuels are fed separately into the model, but they are treated equally inside the model algorithm. No preference is given to either food or biofuels. The main claims for using Jatropha curcas as a biodiesel feedstock are its drought tolerance, the low management inputs needed for its cultivation, and the inclusion of small farmers in the production chain (26), which is in accordance to Brazil’s National Program on Biodiesel Production (3). For that reason, we restrict the occurrence of J. curcas to Northeast Brazil, which is the region targeted by the Brazilian government for inclusion of small-scale farming (3). This restriction is not applied to the other feedstocks.
Four scenario variations are modeled: (i) biofuel targets: 2020 food + 2020 biofuel production; (ii) no increase in biofuel production: 2020 food + 2003 biofuel production; (iii) ethanol targets only: 2020 food + 2020 ethanol + 2003 biodiesel production; and (iv) biodiesel targets only: 2020 food + 2003 ethanol + 2020 biodiesel production. DLUC are determined by the changes in the area covered by biofuel crops in variation (i) compared to variation (ii). ILUC are determined by the difference in the area covered by land uses other than biofuel crops between variations (i) and (ii). The intensification of livestock needed to avoid ILUC by biofuels is estimated by increasing the grazing efficiency (ge) factor to the level at which rangeland area is equal to that of variation-scenario (i) minus the area of rangeland displaced by biofuels.
Model Evaluation.
LandSHIFT model results for Brazil were evaluated in three aspects (a detailed presentation is given in the SI Text).
Crop and rangeland location.
A comparison of LandSHIFT’s calculated suitability with a reality land-use map showed a tendency for the occurrence of high suitability values in crop and rangeland, suggesting the procedure used in LandSHIFT is reasonable for allocation of crop and rangeland (Fig. S3). The land-use map used in this comparison is the same as the one used in the determination of the wi weights, generating a spurious dependency between the datasets used for comparison. However, an analysis where all wi weights were set to the same value of 0.16 further confirmed the tendency of high-suitability values in crop and rangeland grid cells. A second test using the relative operating characteristics (ROC) method (52) showed that the spatial pattern computed by LandSHIFT [ROC(cropland) = 0.87; ROC(rangeland) = 0.80] is not random, in which case it would have a value of 0.5 (Fig. S4).
Crop and rangeland area.
Modeled cropland and rangeland areas are in very good agreement with country-level reported statistics (44), suggesting the model is able to convert country-scale crop production mass into cropland area (Fig. S5). Overestimation of rangelands by 8% might be the result of an underestimation of grassland productivity and also because of the assumption of only one land use per grid cell, which leads to overestimation of the rangeland area, especially in regions where Ld is low, as in Northeast Brazil. Crop and rangeland areas within major regions of Brazil are also in good agreement with statistics (9), except for the overestimation of rangeland in Northeast Brazil (Fig. S6).
Deforestation rates.
The modeled annual deforestation rate for the Amazon region in the 1992 to 2003 period compares well with remote sensing data [LandSHIFT: 16,789 km2/yr, INPE-PRODES: 18,266 km2/yr (53)]. The shares of this deforestation among states are also comparable with PRODES, even though deforestation in Maranhão is overestimated by a factor of 23. However, the land-use map used for model initialization [based on IGBP-DISCover dataset (48)] has 80% more forest in Maranhão compared to PRODES (53). Moreover, LandSHIFT does not consider forestry activities, which might influence deforestation rates. The modeled deforestation rate of Central Brazil Cerrado for the 1992 to 2003 period is 17,753 km2/yr, an amount that lies within the estimated range for the last decade [13,100–26,000 km2/yr (12)].
Carbon Debt and Payback Time.
Carbon debt and payback time are calculated following the approach used by Fargione et al. (7), with two major differences. First, the final numbers are absolute values (Mg CO2) rather than rates (Mg CO2 ha−1) because we calculate total LUCs, and second, the annual CO2 offset by biofuels are calculated on a per ton basis instead of a per hectare basis. All numbers used in the carbon debt and payback time calculations are shown in Tables S6 and S7.
Supplementary Material
Acknowledgments
We thank S. Msangi and an anonymous reviewer for their valuable comments on the manuscript. This study was supported by the International Max Planck Research School on Earth System Modelling in Hamburg, Germany.
Footnotes
The authors declare no conflict of interest.
This article is a PNAS Direct Submission.
This article contains supporting information online at www.pnas.org/cgi/content/full/0907318107/DCSupplemental.
References
- 1.Ministério de Minas e Energia and Empresa de Pesquisa Energética . Portuguese, EPE, Rio de Janeiro. Brazil: 2006. Decadal plan for electrical energy expansion 2006–2015. [Google Scholar]
- 2.União da Indústria de Cana-de-Açúcar . Sugarcane Industry in Brazil: Ethanol, Sugar, Bioelectricity. São Paulo, Brazil: UNICA/ApexBrasil; 2008. [Google Scholar]
- 3.Pousa GP, Santos AL, Suarez PA. History and policy of biodiesel in Brazil. Energy Policy. 2007;35:5393–5398. [Google Scholar]
- 4.Goldemberg J. Ethanol for a sustainable energy future. Science. 2007;315:808–810. doi: 10.1126/science.1137013. [DOI] [PubMed] [Google Scholar]
- 5.Goldemberg J, Coelho ST, Guardabassi P. The sustainability of ethanol production from sugarcane. Energ Pol. 2008;36:2086–2097. [Google Scholar]
- 6.Scharlemann JPW, Laurance WF. Environmental science—how green are biofuels? Science. 2008;319:43–44. doi: 10.1126/science.1153103. [DOI] [PubMed] [Google Scholar]
- 7.Fargione J, Hill J, Tilman D, Polasky S, Hawthorne P. Land clearing and the biofuel carbon debt. Science. 2008;319:1235–1238. doi: 10.1126/science.1152747. [DOI] [PubMed] [Google Scholar]
- 8.Leite RCC, Leal MRLV, Cortez LAB, Griffin WM, Scandiffio MIG. Can Brazil replace 5% of the 2025 gasoline world demand with ethanol? Energy. 2009;34:655–661. [Google Scholar]
- 9.Instututo Brasileiro de Geografia e Estatística 2009. Municipal agricultural production http://www.sidra.ibge.gov.br/ Accessed July 15, 2009.
- 10.Righelato R, Spracklen DV. Environment—carbon mitigation by biofuels or by saving and restoring forests? Science. 2007;317:902. doi: 10.1126/science.1141361. [DOI] [PubMed] [Google Scholar]
- 11.Nassar AM, et al. In: Sugarcane Ethanol: Contributions to Climate Change Mitigation and the Environment. Zuurbier P, Vooren J, editors. Wageningen, The Netherlands: Wageningen Academic Publishers; 2008. pp. 63–94. [Google Scholar]
- 12.Sawyer D. Climate change, biofuels and eco-social impacts in the Brazilian Amazon and Cerrado. Philos Trans R Soc Lond B Biol Sci. 2008;363:1747–1752. doi: 10.1098/rstb.2007.0030. [DOI] [PMC free article] [PubMed] [Google Scholar]
- 13.Crutzen PJ, Mosier AR, Smith KA, Winiwarter W. N2O release from agro-biofuel production negates global warming reduction by replacing fossil fuels. Atmos Chem Phys. 2008;8:389–395. [Google Scholar]
- 14.Hill J, Nelson E, Tilman D, Polasky S, Tiffany D. Environmental, economic, and energetic costs and benefits of biodiesel and ethanol biofuels. Proc Natl Acad Sci USA. 2006;103:11206–11210. doi: 10.1073/pnas.0604600103. [DOI] [PMC free article] [PubMed] [Google Scholar]
- 15.Searchinger T, et al. Use of US croplands for biofuels increases greenhouse gases through emissions from land-use change. Science. 2008;319:1238–1240. doi: 10.1126/science.1151861. [DOI] [PubMed] [Google Scholar]
- 16.Nepstad DC, Stickler CM, Almeida OT. Globalization of the Amazon soy and beef industries: opportunities for conservation. Conserv Biol. 2006;20:1595–1603. doi: 10.1111/j.1523-1739.2006.00510.x. [DOI] [PubMed] [Google Scholar]
- 17.Camargo AMMP, et al. Dynamics and tendency of sugarcane expansion over other agricultural activities, State of São Paulo 2001-2006. Informações Econômicas. 2008;38:47–66. [Google Scholar]
- 18.Brazilian Association of Vegetable Oil Industries 2009. Soy moratorium http://www.abiove.com.br/english/ss_moratoria_us.html Accessed January 20, 2010.
- 19.Fearnside PM. The roles and movements of actors in the deforestation of Brazilian Amazonia. Ecol Soc. 2008;13:23. [Google Scholar]
- 20.Rigon L, et al. Brazilian Cattle Ranching Yearbook. Brazil: Gazeta Santa Cruz, Santa Cruz do Sul; 2005. [Google Scholar]
- 21.Morton DC, et al. Cropland expansion changes deforestation dynamics in the southern Brazilian Amazon. Proc Natl Acad Sci USA. 2006;103:14637–14641. doi: 10.1073/pnas.0606377103. [DOI] [PMC free article] [PubMed] [Google Scholar]
- 22.Melillo JM, et al. Indirect emissions from biofuels: how important? Science. 2009;326:1397–1399. doi: 10.1126/science.1180251. [DOI] [PubMed] [Google Scholar]
- 23.Schaldach R, Koch J. In: Information Technologies in Environmental Engineering. Athanasiadis IN, Mitkas PA, Rizzoli AE, Gómez JM, editors. Berlin: Springer; 2009. pp. 425–438. [Google Scholar]
- 24.Rosengrant MW, et al. International Model for Policy Analysis of Agricultural Commodities and Trade (IMPACT): Model Description. Washington, USA: International Food Policy Research Institute; 2008. [Google Scholar]
- 25.Bondeau A, et al. Modelling the role of agriculture for the 20th century global terrestrial carbon balance. Glob Change Biol. 2007;13:679–706. [Google Scholar]
- 26.Lapola DM, Priess JA, Bondeau A. Modeling the land requirements and potential productivity of sugarcane and jatropha in Brazil and India using the LPJmL dynamic global vegetation model. Biomass Bioenergy. 2009;33:1087–1095. [Google Scholar]
- 27.Robertson GP, et al. Agriculture sustainable biofuels redux. Science. 2008;322:49–50. doi: 10.1126/science.1161525. [DOI] [PubMed] [Google Scholar]
- 28.Roundtable on Sustainable Biofuels . Global Principles and Criteria for Sustainable Biofuels Production. Lausanne, Switzerland: École Polytechnique Fédérale de Lausanne Energy Center; 2008. [Google Scholar]
- 29.Ribeiro MC, Metzger JP, Martensen AC, Ponzoni FJ, Hirota MM. The Brazilian Atlantic forest: how much is left, and how is the remaining forest distributed? Implications for conservation. Biol Conserv. 2009;142:1141–1153. [Google Scholar]
- 30.Greenpeace . Eating up the Amazon. Washington: Greenpeace; 2006. ( http://www.greenpeace.org/international/press/reports/eating-up-the-amazon) Accessed January 20, 2010. [Google Scholar]
- 31.Koh LP, Wilcove DS. Is oil palm agriculture really destroying tropical biodiversity? Conserv Lett. 2008;1:60–64. [Google Scholar]
- 32.Butler RA, Laurance WF. Is oil palm the next emerging threat to the Amazon? Trop Conserv Sci. 2009;2:1–10. [Google Scholar]
- 33.Soares-Filho BS, et al. Modelling conservation in the Amazon basin. Nature. 2006;440:520–523. doi: 10.1038/nature04389. [DOI] [PubMed] [Google Scholar]
- 34.Barreto P, Pereira R, Arima E. Cattle Ranching and Deforestation in Amazonia in the Age of Climate Change. Belém, Brazil: IMAZON; 2008. in Portuguese. [Google Scholar]
- 35.Fearnside PM. In: Deforestation and Land Use in the Amazon. Wood CH, Porro R, editors. Gainesville: University Press of Florida; 2002. pp. 283–364. [Google Scholar]
- 36.Campbell JE, Lobell DB, Genova RC, Field CB. The global potential of bioenergy on abandoned agriculture lands. Environ Sci Technol. 2008;42:5791–5794. doi: 10.1021/es800052w. [DOI] [PubMed] [Google Scholar]
- 37.Food and Agriculture Organization . Tropical Crop-Livestock Systems in Conservation Agriculture: The Brazilian Experience. Rome, Italy: Food and Agriculture Organization; 2007. [Google Scholar]
- 38.Cerri CEP, et al. Predicted soil organic carbon stocks and changes in the Brazilian Amazon between 2000 and 2030. Agric Ecosyst Environ. 2007;122:58–72. [Google Scholar]
- 39.Cattaneo A. Inter-regional innovation in Brazilian agriculture and deforestation in the Amazon: income and environment in the balance. Environ Dev Econ. 2005;10:485–511. [Google Scholar]
- 40.Koch J, Schaldach R, Kochy M. Modeling the impacts of grazing land management on land-use change for the Jordan river region. Global Planet Change. 2008;64:177–187. [Google Scholar]
- 41.Weiß M, Schaldach R, Alcamo J, Flörke M. Quantifying the human appropriation of fresh water by African agriculture. Ecol Soc. 2009;14:25. [Google Scholar]
- 42.Hughes BB. The International Futures (IFs) modeling project. Simul Gaming. 1999;30:304–326. [Google Scholar]
- 43.Saaty TL. The Analytic Hierarchy Process: Planning, Priority Setting, Resource Allocation. Columbus, OH: Mcgraw-Hill; 1980. [Google Scholar]
- 44.Food and Agriculture Organization 2009. FAOSTAT ( http://faostat.fao.org) Accessed July 15, 2009.
- 45.Pedreira CGS, et al. Forage yield and grazing efficiency on rotationally stocked pastures of ‘Tanzania-1’ guineagrass and ‘Guaçu’ elephantgrass. Scientia Agricola. 2005;62:433–439. [Google Scholar]
- 46.Stephenne N, Lambin EF. A dynamic simulation model of land-use changes in Sudano-Sahelian countries of Africa (SALU) Agric Ecosyst Environ. 2001;85:145–161. [Google Scholar]
- 47.Krausmann F, Erb K-H, Gingrich S, Lauk C, Haberl H. Global patterns of socioeconomic biomass flow in the year 2000: a comprehensive assessment of supply, consumption and constraints. Ecol Econ. 2001;65:471–487. [Google Scholar]
- 48.Heistermann M. Modelling the Global Dynamics of Rain-Fed and Irrigated Croplands. Reports on Earth System Science 37/2006. Hamburg, Germany: Max Planck Institute for Meteorology; 2006. [Google Scholar]
- 49.Goldewijk KK. Three centuries of global population growth: A spatial referenced population (density) database for 1700-2000. Popul Environ. 2005;26:343–367. [Google Scholar]
- 50.Rothman DS, Agard J, Alcamo J. in Global Environment Outlook 4. In: United Nations Environment Programme, editor. Valletta, Malta: Progress Press; 2007. pp. 395–454. [Google Scholar]
- 51.Netherlands Environmental Assessment Agency . Integrated Modelling of Global Environmental Change: an Overview of IMAGE 2.4. Bilthoven, The Netherlands: Netherlands Environmental Assessment Agency; 2006. [Google Scholar]
- 52.Pontius RG, Schneider LC. Land-cover change model validation by an ROC method for the Ipswich watershed, Massachusetts, USA. Agric Ecosyst Environ. 2001;85:239–248. [Google Scholar]
- 53.PRODES-INPE 2009. Satellite monitoring of the Amazon forest ( http://www.obt.inpe.br/prodes) Accessed January 20, 2009.
Associated Data
This section collects any data citations, data availability statements, or supplementary materials included in this article.