

Abstract
The living coelacanth is a lobe-finned fish that represents an early evolutionary departure from the lineage that led to land vertebrates, and is of extreme interest scientifically. It has changed very little in appearance from fossilized coelacanths of the Cretaceous (150 to 65 million years ago), and is often referred to as a “living fossil.” An important general question is whether long-term stasis in morphological evolution is associated with stasis in genome evolution. To this end we have used targeted genome sequencing for acquiring 1,612,752 bp of high quality finished sequence encompassing the four HOX clusters of the Indonesian coelacanth Latimeria menadoensis. Detailed analyses were carried out on genomic structure, gene and repeat contents, conserved noncoding regions, and relative rates of sequence evolution in both coding and noncoding tracts. Our results demonstrate conclusively that the coelacanth HOX clusters are evolving comparatively slowly and that this taxon should serve as a viable outgroup for interpretation of the genomes of tetrapod species.
Keywords: genomics, Latimeria menadoensis, BAC clone
The sign outside the Toliara Marine Museum in Madagascar shows a large coelacanth together with a depiction of the descent of man with the caption, Tout le monde evolve sauf moi—“Everybody evolves but me.” Indeed, the living coelacanth, Latimeria, is considered an evolutionary relict that has generated a great deal of intrigue since its discovery in 1938, with interests in its anatomy, physiology, ecology, interrelationships, and even politics (1). Because of its protected status, the best practical approach to its study is from the inside out, i.e., through comparative genomics. To this end we have constructed a high-representation BAC library from the Indonesian coelacanth, Latimeria menadoensis (2), thus allowing indefinite preservation of its genome. Although genomics per se does not provide information as to morphology and function, the information gleaned from the comparative genomics approach can be applied and assayed in other model systems for inferring function (3). It is with the use of this approach that we are addressing evolutionary and developmental (i.e., “evo-devo”) questions concerning the coelacanth and taxa representative of early lineages of vertebrates.
Much of the interest in Latimeria has focused on its unusual morphology, which includes fleshy-lobed fins, a hollow nerve cord, poor ossification of skeleton despite the presence of a rigid notochord that persists throughout its lifetime, lack of defined ribs, and a unique bilobate caudal region, the structure of which has been maintained in coelacanths since the middle Devonian (4). Although it is largely accepted that the coelacanth represents a bona fide outgroup to the tetrapods, the interrelationships of the lungfish, coelacanth, and tetrapods (all sarcopterygian taxa) have been very difficult to resolve (5, 6). In terms of comparative genomics, however, the coelacanth is the only tetrapod outgroup of practical importance, because the lungfishes possess genome sizes that are intractably large for routine genomic analyses (7).
HOX clusters were identified initially in Drosophila as gene complexes whose respective members could induce formation of homeotic transformations when mutated (8, 9). Later, their homology to the vertebrate Hox genes was established (10, 11). The molecular identification of these genes indicated that they all encoded a highly conserved 60-aa motif, the homeodomain, that we now know is involved in DNA binding. Mammals were shown to possess four HOX clusters, whose genes are intimately involved in axial patterning, and in vertebrates, a strict relationship exists between respective genes and their expression limits in somitic and neural tissues, the so-called “Hox code” (12). As a result of their intimate involvement in early development, the Hox genes have often been implicated as potentiators of evolutionary change and are frequently among the first genes examined in an evolutionary context.
Studies of vertebrate HOX cluster genomic organization have shown significant similarities as well as differences among the major taxa. The general conservation of Hox gene orthologues appears to be largely maintained, but overt differences are seen in the absolute number of HOX clusters per taxon as a result of whole genome duplications (WGDs) (13, 14). The WGD events have also led to differences in the number and composition of respective Hox genes via differential gene losses. Collectively, the data indicate that the ancestral condition for the gnathostomes (jawed vertebrates) is four HOX clusters (A, B, C, and D). These four clusters are thought to have been derived from an archetypal single HOX cluster via two WGDs before the emergence of the cartilaginous fishes (14 –17) (Fig. 1). The euteleosts (inclusive bony fish clade) have undergone an independent WGD such that the ancestral euteleost possessed eight HOX clusters (15, 18 –20), although most modern-day representatives (e.g., zebrafish, medaka, puffer fishes, and cichlids) have fewer than eight as a result of cluster loss. The zebrafish genome contains seven HOX clusters, with a remnant of the eighth cluster (HOXDb) having retained only a single microRNA (21). A recent PCR survey of the mooneye (Hiodon alosoides, Osteoglossomorpha) provides evidence for the survival of all eight HOX clusters in the aftermath of the WGD (22). Within the teleosts, some fishes such as the salmonids (salmons and trouts) have undergone yet an additional genome doubling event such that they possess twice as many HOX clusters as other teleosts (23). In contrast, basal ray-finned fishes such as bichir, gar, and bowfin do not appear to have undergone this extra WGD (22, 24–26). The effects of the extra HOX clusters within teleosts are still unclear; some authors have implicated that they may have contributed to the success (speciation) of the teleost fishes (16, 20, 27), although this is an ad hoc hypothesis especially when one considers that this increase in cluster number has been accompanied by increases in gene losses (28).
Fig. 1.

Evolution of the HOX clusters in chordates. For each taxon, HOX clusters are illustrated from top to bottom: HOXA, HOXB, HOXC, and HOXD. Genes shown in cyan are inferred to constitute the ancestral states of the major chordate lineages. Dark blue boxes are losses in the actinopterygian stem linages, red boxes are genes that are absent from Latimeria, and yellow boxes indicate Latimeria genes that are lost in the tetrapod stem-lineage. The number of retained Hox genes is indicated by blue numbers; the gene designations among the branches are those Hox genes inferred to have been lost. Ancestral gene complements are a composite of previous publications (22, 23, 30 –34, 45). Gene counts include Hox pseudogenes but exclude Exv paralogues. Most data from actinopterygian fishes come from teleosts, which have undergone an additional round of genome duplication. A gene is counted as present if it survived in at least one of the two teleostean copies. Duplicated paralogues are not added to the total.
Koh et al. (29) used a comprehensive PCR based approach to isolate Hox genes from the Indonesian coelacanth and to make inferences with regard to the number of HOX clusters and their genomic organizations. In this report we have greatly extended this analysis by completely isolating all of the HOX clusters of the Indonesian coelacanth in BAC clones, thereby allowing the generation of high-quality sequences for the entire HOX complement. This enabled us to unequivocally identify all of the respective Hox genes. The goals of the project were to (i) definitively identify all of the Hox genes in the four HOX clusters of the coelacanth and determine their respective genomic organizations; (ii) compare and contrast the HOX cluster organization of the coelacanth with that of other gnathostome species; (iii) identify potential cis-regulatory elements using a comparative genomics approach; and (iv) measure relative rates of evolution of the coelacanth coding and noncoding sequences in comparison with that of other gnathostomes.
Results
Cluster Organization.
We isolated BAC contigs encompassing the four L. menadoensis HOX clusters and determined their complete DNA sequence. The complete sequence of the four clusters revealed a high level of conservation. In total, there are 42 Hox genes ordered in the same transcriptional orientation throughout respective clusters, as well as two Evx paralogues associated with the HOXA and HOXD clusters. Based on our data and those of other taxa (22, 23, 26, 30 –34), we constructed a more complete scenario of the evolutionary history of vertebrate HOX clusters (Fig. 1). The coelacanth has, in particular, retained Hox genes that are frequently lost in other lineages, such as HoxC1 and HoxC3. Compared with cartilaginous fishes, L. menadoensis has lost only HoxD2 and HoxD13. To the contrary, the HoxA14 gene, which is pseudogenized in the horn shark and elephant shark, is still intact in the coelacanth (Fig. 1).
Gene distances are largely conserved between coelacanth and human, as shown by the scale maps of the four clusters in Fig. 2 and in the graphic illustration in Fig. S1. Differences are visible mostly in the regions where Hox genes have been deleted (HoxA14). Interestingly, HoxB10 has been removed from the human HOXB cluster without significant changes in the distance between HoxB9 and HoxB13. The largest differences between human and coelacanth are an increase of the distances between HoxD12 and Exv2 that may be associated with the loss of HoxD13 in the coelacanth, and an expansion of the IGR between HoxD10 and HoxD9. Comparisons of HOX cluster structure among various vertebrate species are given in Fig. S2.
Fig. 2.

Scale map of the Latimeria menadoensis HOX clusters compared with their human counterparts (blue). Major tic marks are 100 kb. Comparison of relative HOX cluster sizes and intergenic spacing among various vertebrates is given in Fig. S2.
The Latimeria menadoensis HOX clusters harbor six microRNA genes, three of each of the two HOX associated families mir-10 and mir-196. The genomic locations of the microRNAs in the Hox10-Hox9 and the Hox5-Hox4 intergenic regions (IGRs), respectively, are the same as in other vertebrates (35). The location of mir-10 upstream of Hox4 is also conserved in the cephalochordate Branchiostoma floridae (36) and in invertebrates including Drosophila (37).
Noncoding Sequences.
Global alignment-based identification of conserved noncoding sequences using mVISTA was carried out for the four coelacanth HOX clusters and clusters of various other vertebrates (Fig. S3). This method has been shown to be effective at identifying and visualizing overtly conserved noncoding elements, including many that had been identified functionally, such as the HoxC8 early enhancer (3), and Evx neuronal enhancer (38) (Fig. S3E). A much more inclusive and comprehensive means for identifying conserved noncoding nucleotides (CNCNs) uses the tracker program (39). Fig. 3 summarizes the distribution of CNCNs as determined by the combination of tracker and dialign for the four Latimeria HOX clusters. A detailed list of the 875 individual phylogenetic footprints comprising 33,343 nt of CNCNs can be found online (http://www.bioinf.uni-leipzig.de/Publications/SUPPLEMENTS/09-002/). The fraction of the IGRs between Hox genes contains nearly an order of magnitude more CNCNs than the surrounding genomic regions. This increase in noncoding sequence conservation was previously observed for the HOX clusters of many other vertebrates (24, 39 –42). Because of the differences in the number and phylogenetic distribution of available HOX sequences for the four paralogons, differences in the sensitivity of the footprinting procedure are inevitable, so the data are not comparable across different clusters. The data also reflect the expected increase in the density of CNCNs in the anterior part of the clusters (36, 42)
Fig. 3.

Distribution of conserved noncoding DNA in IGRs between Hox genes. The figure summarizes the compilation of the conserved phylogenetic footprints as determined by the tracker algorithm. A listing of all conserved footprints is given online (http://www.bioinf.uni-leipzig.de/Publications/SUPPLEMENTS/09-002/). For each IGR, as well as the regions flanking the four Latimeria HOX clusters, the fraction of nucleotides contained in conserved noncoding elements is plotted. The highest totals are seen between HoxA2 and HoxA3, HoxB2 and HoxB3, HoxC5 and HoxC6, and HoxD3 and HoxD4. Functional aspects of these conserved footprints are largely unknown, although many are likely to represent cis-regulatory elements.
Repetitive Elements.
As demonstrated for other vertebrate HOX clusters (43), repetitive elements are strongly excluded from the clusters. Repetitive DNA that appears more than once in the same HOX cluster sequence is located predominantly in the regions flanking the HOX cluster, whereas such repeats are rare in most of the IGRs between Hox genes (Fig. S4). The same pattern arises by measuring the fraction of interspersed repeats, as illustrated in Fig. 4. The search for tRNAs resulted in several tRNA pseudogenes with unassigned anticodon. A BlastN search against 24 fragments of genomic DNA with a length of more 100,000 nt showed that these sequences are relatively frequent in the Latimeria genome. Alignments with the complete set of human tRNAs showed that they fall into just two clusters with related sequences, identifying two related families of repeats. The consensus sequences of the two groups are provided online (http://www.bioinf.uni-leipzig.de/Publications/SUPPLEMENTS/09-002/). Consistent with the strong exclusion of repetitive elements from the HOX clusters, only a single copy was found inside a HOX cluster (between HoxC3 and HoxC1).
Fig. 4.

Density of repetitive elements measured as the fraction of nucleotides annotated as interspersed repeats by repeatmasker. Numbers refer to Hox genes; E, Evx. The fraction of nucleotides in repetitive elements is shown on a log-scale for each IGR and the regions adjacent to the HOX clusters. The three horizontal lines indicate the distribution of the repeat density of the Latimeria genome determined from the 15 longest GenBank entries for Latimeria menadoensis. The middle line is the average density. In addition plus/minus 1 SD is indicated. Repetitive elements are depleted only within the HOX clusters, whereas in the flanking regions the repeat density is consistent with the genomic distribution.
Rates of Evolution.
Relative rate tests (RRTs) of protein coding sequences demonstrate a reduced rate of evolution in the coelacanth relative to other vertebrate species. The differences are substantial based on Tajima tests on the well conserved parts of individual protein coding sequences (Fig. 5 A and B; see Dataset S1 for individual RRTs). Both human and zebrafish proteins evolve significantly faster than those of the coelacanth. The situation is reversed for only a single Hox gene, HoxD10, which is marginally faster in Latimeria than in human.
Fig. 5.

RRTs: (A) Summary of Tajima tests performed on Hox protein sequences using horn shark (HOXA, HOXB, HOXD) or elephant shark (HOXC) as outgroup. For each gene, a Hasse diagram shows highly significant (P ≤ 0.01, solid line) and significant (0.01 < P ≤ 0.05, dotted line) comparisons, with the faster-evolving gene shown above the slower-evolving one. Lm, circle; Hs, square; Dr-a, right-pointing triangle, Dr-b, left-pointing triangle. (B) Summary of significant relative rate tests at species level. Each arrow indicates that RRTs were significant for one or more genes between two species, with the arrow pointing toward the slower-evolving species. Full arrows imply that there are highly significant test results, dotted arrows refer to tests that are only significant. The number of highly significant (significant) tests is indicated for each of the four HOX clusters. Except for the HOXD cluster, most zebrafish genes (triangles) evolve faster than human genes (squares). For HOXD, this situation is reversed. With a single marginally significant exception (HoxD10), Latimeria (circles) never appears as the faster-evolving species. (C) Relative rate tests for conserved noncoding regions. Two outgroups are necessary to determine the conserved nucleotide positions. The test contrasts the evolutionary rate of one of two ingroups (foreground) against a constant rate among the two outgroups and the other ingroup (background). Latimeria always appears slow evolving: as “foreground” it appears significantly retarded. When used as background ingroup, each tetrapod ingroup is significantly accelerated. Significance levels: *P < 0.1, **P < 0.05, ***P < 0.01. Dr, Danio rerio (zebrafish); Hf, Heterodontus francisci (horn shark); Ps, Polypterus senegalus (bichir); Lm, Latimeria menadoensis (coelacanth); Xt, Xenopus tropicalis (clawed frog); Gg, Gallus gallus (chicken); Md, Monodelphis domestica (opossum); Cf, Canis familiaris (dog); Mm, Mus musculus (mouse); Rn, Rattus norvegicus (rat); Hs, Homo sapiens (human).
Rate differences in the evolution of noncoding sequences are harder to measure, as only local alignments are available. One possibility is to consider only sites that are conserved between two outgroups. Rate differences can be measured by differential rates in the loss of this ancestral state (44). The corresponding statistical test can be applied directly to the (concatenated) alignments of blocks of CNCNs described in the previous section. The requirement of two outgroups, however, limits analysis to the A cluster, because appropriate data sets are available for only bichir and shark HOXA and not for other clusters. The duplicated, substantially derived HOX clusters of teleosts are not suitable for this kind of analysis because of the dramatic loss of CNCNs in the wake of the teleost-specific genome duplication (39). The data in Fig. 5C show that CNCNs evolve consistently slower in the HOX cluster than in any of the investigated tetrapod clusters. The fact that we observe larger absolute values of z′ under the assumption that Latimeria CNCNs evolve at the same rate as the two outgroups implies a consistently accelerated rate in tetrapods relative to the other major gnathostome lineages. Details of this analysis may be found online (http://www.bioinf.uni-leipzig.de/Publications/SUPPLEMENTS/09-002/).
Functionality of Hox14.
To access whether coelacanth HoxA14 is potentially functional, we constructed a synthetic HoxA14 cDNA and fused it with GFP to assess activity in a transient transfection assay. Representative data from one such transfection experiment are given in Fig. S5. These results clearly indicate that the Latimeria HoxA14 fusion protein is localized to the nucleus of transfected cells, as would be expected for a typical Hox transcription factor.
Discussion
We have cloned and sequenced the HOX clusters of L. menadoensis. We identified 42 Hox genes in four clusters (Fig. 2), including all 33 genes that were previously identified by Koh et al. (29). Genes not identified in the previous report are HoxA3, HoxA5, HoxA14, HoxB8, HoxB9, HoxB10, HoxC3, HoxC6, and HoxC11. We also identified two Evx genes, Evx1 and Evx2, located upstream of HOXA and HOXD, respectively. Within each cluster, Hox genes were oriented in the same transcriptional orientation and the intergenic spacing was found to be highly similar to that of the human HOX clusters (Fig. S1; also see Fig. 2 and Fig. S2). As in other vertebrates, the Evx genes are in opposite transcriptional orientation to the Hox genes proper. The HOXD cluster was sequenced far upstream and downstream of its Hox genes and contained known coding and noncoding sequences that have been found in other HOXD clusters, including the Lunapark gene and the HOXD global control region at its 5′ end, and the Metaxin2 gene at its 3′ end (41). Identification of the complete Hox gene complement in Latimeria permits a more accurate reconstruction of the evolutionary history of HOX clusters among the jawed vertebrates (Fig. 1). However, in terms of overall gross organization, the coelacanth HOX clusters are unremarkable relative to those from other species with four clusters (Fig. S1), which speaks to the general conservation of the HOX system. The euteleost fishes, in which an independent round of WGD has occurred, appear to be an exception to this trend (22, 26, 45).
The vertebrate HOX clusters have been shown to be largely devoid of repetitive DNA (36, 43). This has been interpreted to mean that the clusters are coadapted gene complexes that are not readily disrupted by recombination (8, 46). Although a repeat library does not yet exist for Latimeria, our analysis suggests that HOX clusters show typical strong depletion of repetitive sequences within the clusters. As observed in previous studies (31, 43), repeat densities close to genomic background are observed in those long IGRs in which the coherence of the clusters weakens. This is shown in Fig. 4 for the HoxB13-HoxB10 IGR, which is also enriched in repeats in other vertebrates, and the two regions of HOXD that deviate most from its human counterpart, namely the posterior end, which suffered the loss of HoxD13, and the HoxD10-HoxD9 IGR, which is threefold expanded in the coelacanth as a result of repeat insertion.
We had previously shown that paralogue group (PG)–14 genes were present in both coelacanth (HoxA14) and horn shark (HoxD14 and HoxA14 pseudogene) (47), suggesting that PG-14 was, in fact, an ancestral condition for jawed vertebrates. The potential functionality of coelacanth HoxA14 was assessed via a simple in vitro assay (Fig. S5) in which Hox14 was fused to GFP. The data confirm that the coelacanth HoxA14 protein can direct proper expression in the nuclei of transiently transfected human fibroblasts, as expected for a functional transcription factor. These data confirm that Hoxa14 is potentially functional. PG-14 genes have also been found in two other cartilaginous fishes, the cloudy catshark, Scyliorhinus torazame (HoxD14) (48), and the elephant shark (HoxD14, as well as HoxA14 and HoxC14 pseudogenes) (33). Moreover, it was shown that the Japanese lamprey, a jawless vertebrate, also possesses a Hox14 gene (48), suggesting that PG-14 existed before the divergence of lampreys and gnathostomes. Expression analysis of the lamprey and catshark Hox14 genes by in situ hybridization indicated that the genes did not show a predicted posterior axial pattern of Hox expression; rather, the genes showed a noncanonical expression pattern in the gut that overlapped with that of Hox13, implying that the PG-14 genes may have arisen as a gene duplicate of Hox13, complete with gut-specific regulatory sequences (48). The timing of this duplication and the relationship of vertebrate PG14 to amphioxus Hox14 (and Hox15) are difficult to assess because of a lack of phylogenetic signal (47).
Vertebrate HOX clusters are well known to exhibit a high level of conservation in their non–protein-coding regions (24, 32, 33, 36, 39, 40, 42). VISTA plots (Fig. S3) readily show that the coelacanth is no exception, and reveal conspicuously conserved regions, among them several footprints whose function has been studied in previous work (3, 38). A more sensitive quantitative method (39) reveals that nearly 10% of the HOX cluster IGR sequences are conserved between Latimeria and tetrapods or cartilaginous fishes, a percentage that exceeds genomic background levels by an order of magnitude. In light of the large evolutionary distance with its vertebrate relatives, this degree of phylogenetic footprint conservation is substantial, and is interpreted as a consequence of the tight and complex cross-regulatory network that characterizes vertebrate Hox genes.
The highly conserved structure of coelecanth HOX is consistent with the observation that its evolutionary rate is slower than those of both human and zebrafish (49, 50). Relative rate tests performed for protein sequences showed a systematic retardation in evolutionary rate in all four clusters relative to both human and zebrafish (Fig. 5 A and B). For the HOXA cluster, in which sequence data for two suitable outgroups (shark and bichir) were available, it was also possible to test evolutionary rates of conserved noncoding regions. The tests remain significant under the assumption that both outgroups and the alternative ingroup evolve at the same constant rate (Fig. 5C), supporting the interpretation that the evolution of Latimeria HOX is indeed retarded relative to the ingroups assayed.
In this article we report the procurement and analysis of the complete sequences of the four HOX clusters in the Indonesian coelacanth L. menadoensis. We show that its HOX clusters exhibit a high level of conservation and slow evolutionary rate, observations that are in keeping with findings from our previous study on the protocadherin gene clusters in the coelacanth (49). In addition, the Latimeria genome has been shown to be evolving slowly with regard to the turnover of interspersed repeats (SINE-type retroposons) (51 –53). Whereas most retroposon families undergo expansion and rapid turnover during evolution, at least two SINE families that predate the coelacanth–tetrapod divergence show a differential retention pattern in coelacanth. These SINEs are propagated and maintained in the coelacanth genome as typical SINE-like families, but have undergone substantial turnover in the tetrapod genomes, even adopting new functions in both coding and noncoding regions (i.e., exaptation) (51 –53). In toto, these characteristics of the coelacanth genome are highly favorable for its use as a viable outgroup to better inform the genome biology and evolution of tetrapod species, including humans. Moreover, the coelacanth genome will also help to decipher, from the inside out, the unique biology of this fascinating creature.
Materials and Methods
Library Construction, Screening, and Sequencing.
BAC library construction, screening, and sequencing of HOX contigs are described in detail in SI Materials and Methods.
Annotation.
DNA sequences were first analyzed using the Informax Vector NTI software package. Hox coding sequences were identified in part using the GenomeScan (54) (http://genes.mit.edu/genomescan.html) with known vertebrate Hox sequences as training set. Initial annotations were then refined using ProSplign (for coding sequences) and Splign (for UTRs) (55). Putative start codons were evaluated based on the position-specific weight matrix reported previously (56). A few intron positions (in the 5′ part of lnp and in HoxB10) were corrected manually to use common splice donor motifs.
MicroRNA precursors were identified by a blast comparison with MirBase (version 10) (57), and with GotohScan (58) based on the HOX cluster associated microRNAs described previously (35). Furthermore, tRNAs and tRNA pseudogenes were detected with tRNAscan-SE (59). tRNA pseudogenes for which the ancestral tRNA remained undetermined by tRNAscan-SE were aligned with the complete set of human nuclear tRNAs (60) with ClustalW (61). A neighbor-joining tree was used to determine their relationship to functional tRNAs.
The sequences of the four clusters and their annotation are deposited in GenBank with accession numbers FJ497005 through FJ497008.
Repetitive Elements.
Repetitive elements were annotated using RepeatMasker (http://www.repeatmasker.org/) in vertebrate mode. The density of interspersed repetitive elements was determined by counting the number of intergenic nucleotides that were annotated as interspersed elements (i.e., excluding simple and low-complexity repeats). To visualize the repeat content of the HOX cluster regions, we computed dot-plots comparing the nucleic acid sequence of a cluster against itself with BlastN, as described previously (36).
Analysis of Noncoding Sequences.
Long-range sequence comparisons of HOX clusters from Latimeria and other vertebrates were performed using the VistaPlot Web server (62) (Fig. S3 A–D). A systematic quantitative analysis of conserved noncoding sequence elements was performed in comparison with the following collection of species (HOX clusters): Hf, horn shark (Heterodontus francisci) A, B, D; Ps, bichir (Polypterus senegalus) A; Xt, frog (Xenopus tropicalis) A, B, C, D; Gg, chicken (Gallus gallis) A; Md, opossum (Monodelphis domestica) A, B, C, D; Cf, dog (Canis familiaris) A, B, C, D; Hs, human (Homo sapiens) A, B, C, D; Mm, mouse (Mus musculus) A, B, C, D; and Rn, rat (Rattus norvegicus) A, B, C, D. These sequences and their annotations can be found online (http://www.bioinf.uni-leipzig.de/Publications/SUPPLEMENTS/09-002/). For each of the four paralogous clusters, we used Tracker (39), a phylogenetic footprinting program based on BLAST, to determine an initial set of footprints. The complete lists of Tracker footprints and the positions of the Hox genes were then used as weighted anchors for dialign-2 (63). This software produces global “segment-based” alignments that emphasize local conservation. By construction, these alignments contained a maximal consistent set of tracker footprints together with additional local alignments detected by dialign-2 only. As a consequence, this procedure increased the sensitivity relative to tracker alone. For these alignments, only short flanking regions outside the HOX cluster were used to reduce computational efforts.
The global dialign-2 alignments were then further processed by a perl script (available at http://www.bioinf.uni-leipzig.de/Publications/SUPPLEMENTS/09-002/) that distinguishes conserved blocks from intervening variable regions in a multiple sequence alignment: Let pα, α ∈ {A, T, G, C} be the frequency of nucleotide α in the entire alignment. For each alignment column, let fα, α ∈ {A, T, G, C, _} be the frequency of characters. In evaluating fα we ignore all rows in which α = ′_′ is part of a deletion longer than 9 nt. We assign the following score to each column:
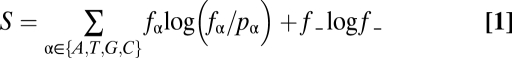 |
The first term measures the information content of the column, which is positive for well conserved columns and approaches 0 when the column reflects the background nucleotide distribution. The second term is an entropy-like penalty for gaps, which is always nonpositive. Alignment column k is considered as conserved if the running average of S over the interval [k – L, k + L] reaches a threshold value S*. Here we used the parameters L = 4, i.e., averages over windows of length 9 and a threshold value S* = 0.75. A conserved block is defined as at least 6 consecutive conserved columns. Lists of all conserved blocks (excluding the sequence located between start and stop codon of the same protein) for the four HOX clusters can be found online (http://www.bioinf.uni-leipzig.de/Publications/SUPPLEMENTS/09-002/). These blocks were then used for statistical analysis.
RRTs.
Protein coding sequences.
The Tajima RRT (64) as implemented in the MEGA package (65) was applied to all exon-1 sequences of coelacanth, human, and zebrafish Hox proteins, using horn shark (i.e., HOXA, HOXB, HOXD) or elephant shark (i.e., HOXC) sequences as the outgroup. Multiple RRTs can be combined to form a partial order encoding the relative evolutionary speeds of several species. Such data can be represented by the so-called Hasse diagram of the poset, in which faster-evolving genes are placed above the slower ones. A subset of significant tests are drawn as edges, so that all significant tests correspond to pairs of genes that are connected by a directed path (66).
Noncoding conserved nucleotides.
Relative rates of evolution of CNCNs were evaluated following the procedure described previously (44). This test measures the differential loss of conservation in two ingroups of alignment positions that are conserved in two outgroups. As two suitable outgroups, namely shark and bichir, were available for HOXA only, this analysis was confined to this cluster.
In extension of earlier work (44), we also implemented a bootstrapping procedure for this test to evaluate the stability of the data. As observed previously (44), CNCNs typically contain short blocks of consecutive nucleotides that are conserved between the two outgroups. The average length of these blocks roughly matches the expected size of individual footprints (b ≈ 6) Conservatively, one assumes that these blocks evolve in a correlated fashion as a result of selective constraints. This is reflected in the testing procedure as an effective reduction of the variance. A bootstrapping approach has to incorporate this fact. The resampling of the alignment therefore proceeds by randomly picking N/(2b) blocks of length 2b to obtain a new alignment of length N.
Cellular Localization of HoxA14.
A synthetic HoxA14 cDNA was generated using primers 791 through 796 (Table S1) and overlap PCR. This cDNA was directionally cloned upstream and in-frame into the GFP gene of pEGFP-C3 (67). Purified DNA was transfected into adherent GM0637 cells (i.e., human fibroblasts) using FuGene 6 cationic lipid transfection reagent (Roche) following the manufacturer's recommendations. Control transfections included a construct containing mouse HoxA11 (i.e., positive control), as well as a mouse HoxA11 construct that lacked the nuclear localization site (67) and empty vector (i.e., negative controls). Images were taken with a confocal microscope (MRC-1024; Bio-Rad).
Supplementary Material
Acknowledgments
We thank Mandy Ranisch for help with checking the final annotation of the HOX cluster sequences, Karen Cerosaletti for help with transfection experiments and confocal microscopy, and Chi-hua Chiu for help with the first-generation coelacanth BAC library. This work was funded in part by National Science Foundation Grants IOS-0321461 and MCB-0719558 (to C.T.A.) and IOS-0321470 (to F.H.R.), United States Department of Energy Grants DE-FG03-01ER63273 (to C.T.A.), DE-FG03-01ER63272 (to R.M.), and DE-F602-01ER63274 (to F.H.R.), and Deutsche Forschungsgemeinschaft Bioinformatics Initiative Grant BIZ-6/1-2 (to P.F.S.); and by the Sixth Framework Programme of the European Union projects 043312 “SYNLET” and 043251 “EDEN”.
Footnotes
The authors declare no conflict of interest.
Data deposition: The sequences reported in this paper have been deposited in the GenBank database (accession nos. FJ497005, FJ497006, FJ497007, and FJ497008).
This article contains supporting information online at www.pnas.org/cgi/content/full/0914312107/DCSupplemental.
References
- 1.Balon EK, Bruton MN, Fricke H. A fiftieth anniversary reflection on the living coelacanth, Latimeria chalumnae: some new interpretations of its natural history and conservation status. Environ Biol Fishes. 1988;23:241–280. [Google Scholar]
- 2.Danke J, et al. Genome resource for the indonesian coelacanth, Latimeria menadoensis . J Exp Zoolog A Comp Exp Biol. 2004;301:228–234. doi: 10.1002/jez.a.20024. [DOI] [PubMed] [Google Scholar]
- 3.Shashikant C, Bolanowski SA, Danke J, Amemiya CT. Hoxc8 early enhancer of the indonesian coelacanth, Latimeria menadoensis . J Exp Zoolog B Mol Dev Evol. 2004;302:557–563. doi: 10.1002/jez.b.21018. [DOI] [PubMed] [Google Scholar]
- 4.Carroll RL. Vertebrate paleontology and evolution. New York: H. Freeman and Co.; 1988. [Google Scholar]
- 5.Takezaki N, Figueroa F, Zaleska-Rutczynska Z, Takahata N, Klein J. The phylogenetic relationship of tetrapod, coelacanth, and lungfish revealed by the sequences of forty-four nuclear genes. Mol Biol Evol. 2004;21:1512–1524. doi: 10.1093/molbev/msh150. [DOI] [PubMed] [Google Scholar]
- 6.Zardoya R, Cao Y, Hasegawa M, Meyer A. Searching for the closest living relative(s) of tetrapods through evolutionary analyses of mitochondrial and nuclear data. Mol Biol Evol. 1998;15:506–517. doi: 10.1093/oxfordjournals.molbev.a025950. [DOI] [PubMed] [Google Scholar]
- 7.Rock J, Eldridge M, Champion A, Johnston P, Joss J. Karyotype and nuclear DNA content of the Australian lungfish, Neoceratodus forsteri (Ceratodidae: Dipnoi) Cytogenet Cell Genet. 1996;73:187–189. doi: 10.1159/000134336. [DOI] [PubMed] [Google Scholar]
- 8.Lewis EB. A gene complex controlling segmentation in Drosophila . Nature. 1978;276:565–570. doi: 10.1038/276565a0. [DOI] [PubMed] [Google Scholar]
- 9.Gehring WJ. Master Control genes in development and evolution: the Homeobox story (Terry Lecture Series) New Haven, CT: Yale University Press; 1998. [Google Scholar]
- 10.McGinnis W, Krumlauf R. Homeobox genes and axial patterning. Cell. 1992;68:283–302. doi: 10.1016/0092-8674(92)90471-n. [DOI] [PubMed] [Google Scholar]
- 11.Schubert FR, Nieselt-Struwe K, Gruss P. The Antennapedia-type homeobox genes have evolved from three precursors separated early in metazoan evolution. Proc Natl Acad Sci USA. 1993;90:143–147. doi: 10.1073/pnas.90.1.143. [DOI] [PMC free article] [PubMed] [Google Scholar]
- 12.Hunt P, Krumlauf R. Deciphering the Hox code: clues to patterning branchial regions of the head. Cell. 1991;66:1075–1078. doi: 10.1016/0092-8674(91)90029-x. [DOI] [PubMed] [Google Scholar]
- 13.Holland PW, Garcia-Fernández J, Williams NA, Sidow A. Gene duplications and the origins of vertebrate development. Dev Suppl 1994. 1994:125–133. [PubMed] [Google Scholar]
- 14.Holland PW, Garcia-Fernàndez J. Hox genes and chordate evolution. Dev Biol. 1996;173:382–395. doi: 10.1006/dbio.1996.0034. [DOI] [PubMed] [Google Scholar]
- 15.Amores A, et al. Zebrafish hox clusters and vertebrate genome evolution. Science. 1998;282:1711–1714. doi: 10.1126/science.282.5394.1711. [DOI] [PubMed] [Google Scholar]
- 16.Taylor JS, Braasch I, Frickey T, Meyer A, Van de Peer Y. Genome duplication, a trait shared by 22000 species of ray-finned fish. Genome Res. 2003;13:382–390. doi: 10.1101/gr.640303. [DOI] [PMC free article] [PubMed] [Google Scholar]
- 17.Prohaska SJ, et al. The shark HoxN cluster is homologous to the human HoxD cluster. J Mol Evol. 2004;58:212–217. doi: 10.1007/s00239-003-2545-z. [DOI] [PubMed] [Google Scholar]
- 18.Meyer A, Málaga-Trillo E. Vertebrate genomics: More fishy tales about Hox genes. Curr Biol. 1999;9:R210–R213. doi: 10.1016/s0960-9822(99)80131-6. [DOI] [PubMed] [Google Scholar]
- 19.Prince VE. The Hox Paradox: More complex(es) than imagined. Dev Biol. 2002;249:1–15. doi: 10.1006/dbio.2002.0745. [DOI] [PubMed] [Google Scholar]
- 20.Amores A, et al. Developmental roles of pufferfish Hox clusters and genome evolution in ray-fin fish. Genome Res. 2004;14:1–10. doi: 10.1101/gr.1717804. [DOI] [PMC free article] [PubMed] [Google Scholar]
- 21.Woltering JM, Durston AJ. The zebrafish hoxDb cluster has been reduced to a single microRNA. Nat Genet. 2006;38:601–602. doi: 10.1038/ng0606-601. [DOI] [PubMed] [Google Scholar]
- 22.Chambers KE, et al. Hox cluster duplication in a basal teleost fish, the goldeye (Hiodon alosoides) Theory Biosci. 2009;128:109–120. doi: 10.1007/s12064-009-0056-1. [DOI] [PMC free article] [PubMed] [Google Scholar]
- 23.Moghadam HK, Ferguson MM, Danzmann RG. Evolution of Hox clusters in Salmonidae: a comparative analysis between Atlantic salmon (Salmo salar) and rainbow trout (Oncorhynchus mykiss) J Mol Evol. 2005;61:636–649. doi: 10.1007/s00239-004-0338-7. [DOI] [PubMed] [Google Scholar]
- 24.Chiu CH, et al. Bichir HoxA cluster sequence reveals surprising trends in ray-finned fish genomic evolution. Genome Res. 2004;14:11–17. doi: 10.1101/gr.1712904. [DOI] [PMC free article] [PubMed] [Google Scholar]
- 25.Hoegg S, Brinkmann H, Taylor JS, Meyer A. Phylogenetic timing of the fish-specific genome duplication correlates with the diversification of teleost fish. J Mol Evol. 2004;59:190–203. doi: 10.1007/s00239-004-2613-z. [DOI] [PubMed] [Google Scholar]
- 26.Crow KD, Stadler PF, Lynch VJ, Amemiya C, Wagner GP. The “fish-specific” Hox cluster duplication is coincident with the origin of teleosts. Mol Biol Evol. 2006;23:121–136. doi: 10.1093/molbev/msj020. [DOI] [PubMed] [Google Scholar]
- 27.Taylor JS, Van de Peer Y, Meyer A. Genome duplication, divergent resolution and speciation. Trends Genet. 2001;17:299–301. doi: 10.1016/s0168-9525(01)02318-6. [DOI] [PubMed] [Google Scholar]
- 28.Wagner GP, Amemiya C, Ruddle F. Hox cluster duplications and the opportunity for evolutionary novelties. Proc Natl Acad Sci USA. 2003;100:14603–14606. doi: 10.1073/pnas.2536656100. [DOI] [PMC free article] [PubMed] [Google Scholar]
- 29.Koh EGL, et al. Hox gene clusters in the Indonesian coelacanth, Latimeria menadoensis . Proc Natl Acad Sci USA. 2003;100:1084–1088. doi: 10.1073/pnas.0237317100. [DOI] [PMC free article] [PubMed] [Google Scholar]
- 30.Hoegg S, Meyer A. Hox clusters as models for vertebrate genome evolution. Trends Genet. 2005;21:421–424. doi: 10.1016/j.tig.2005.06.004. [DOI] [PubMed] [Google Scholar]
- 31.Prohaska SJ, Stadler PF, Wagner GP. Evolutionary genomics of Hox gene clusters. In: Papageorgiou S, editor. HOX Gene Expression. New York: Springer; 2006. pp. 68–90. [Google Scholar]
- 32.Di-Poï N, Montoya-Burgos JI, Duboule D. Atypical relaxation of structural constraints in Hox gene clusters of the green anole lizard. Genome Res. 2009;19:602–610. doi: 10.1101/gr.087932.108. [DOI] [PMC free article] [PubMed] [Google Scholar]
- 33.Ravi V, et al. Elephant shark (Callorhinchus milii) provides insights into the evolution of Hox gene clusters in gnathostomes. Proc Natl Acad Sci USA. 2009;106:16327–16332. doi: 10.1073/pnas.0907914106. [DOI] [PMC free article] [PubMed] [Google Scholar]
- 34.Raincrow JD, et al. Leipzig: Univ Leipzig; 2009. Hox clusters of the bichir (Polypterus senegalus) Tech. Rep. BIOINF 09-040. Available at http://www.bioinf.uni-leipzig.de/Publications/PREPRINTS/09-040.pdf. Last accessed January 15, 2010. [Google Scholar]
- 35.Tanzer A, Amemiya CT, Kim CB, Stadler PF. Evolution of microRNAs located within Hox gene clusters. J Exp Zool Mol Dev Evol. 2005;304B:75–85. doi: 10.1002/jez.b.21021. [DOI] [PubMed] [Google Scholar]
- 36.Amemiya CT, et al. The amphioxus Hox cluster: characterization, comparative genomics, and evolution. J Exp Zoolog B Mol Dev Evol. 2008;310B:465–477. doi: 10.1002/jez.b.21213. [DOI] [PubMed] [Google Scholar]
- 37.Stark A, et al. Systematic discovery and characterization of fly microRNAs using 12 Drosophila genomes. Genome Res. 2007;17:1865–1879. doi: 10.1101/gr.6593807. [DOI] [PMC free article] [PubMed] [Google Scholar]
- 38.Suster ML, et al. A novel conserved evx1 enhancer links spinal interneuron morphology and cis-regulation from fish to mammals. Dev Biol. 2009;325:422–433. doi: 10.1016/j.ydbio.2008.10.004. [DOI] [PubMed] [Google Scholar]
- 39.Prohaska S, Fried C, Flamm C, Wagner G, Stadler PF. Surveying phylogenetic footprints in large gene clusters: applications to Hox cluster duplications. Mol Phyl Evol. 2004;31:581–604. doi: 10.1016/j.ympev.2003.08.009. [DOI] [PubMed] [Google Scholar]
- 40.Chiu CH, et al. Molecular evolution of the HoxA cluster in the three major gnathostome lineages. Proc Natl Acad Sci USA. 2002;99:5492–5497. doi: 10.1073/pnas.052709899. [DOI] [PMC free article] [PubMed] [Google Scholar]
- 41.Lee AP, Koh EGL, Tay A, Brenner S, Venkatesh B. Highly conserved syntenic blocks at the vertebrate Hox loci and conserved regulatory elements within and outside Hox gene clusters. Proc Natl Acad Sci USA. 2006;103:6994–6999. doi: 10.1073/pnas.0601492103. [DOI] [PMC free article] [PubMed] [Google Scholar]
- 42.Hoegg S, Boore JL, Kuehl JV, Meyer A. Comparative phylogenomic analyses of teleost fish Hox gene clusters: lessons from the cichlid fish Astatotilapia burtoni . BMC Genomics. 2007;8:317. doi: 10.1186/1471-2164-8-317. [DOI] [PMC free article] [PubMed] [Google Scholar]
- 43.Fried C, Prohaska SJ, Stadler PF. Exclusion of repetitive dna elements from gnathostome Hox clusters. J Exp Zool . Mol Dev Evol. 2004;302B:165–173. doi: 10.1002/jez.b.20007. [DOI] [PubMed] [Google Scholar]
- 44.Wagner GP, Fried C, Prohaska SJ, Stadler PF. Divergence of conserved non-coding sequences: rate estimates and relative rate tests. Mol Biol Evol. 2004;21:2116–2121. doi: 10.1093/molbev/msh221. [DOI] [PubMed] [Google Scholar]
- 45.Kuraku S, Meyer A. The evolution and maintenance of Hox gene clusters in vertebrates and the teleost-specific genome duplication. Int J Dev Biol. 2009;53:765–773. doi: 10.1387/ijdb.072533km. [DOI] [PubMed] [Google Scholar]
- 46.Duboule D. The rise and fall of Hox gene clusters. Development. 2007;134:2549–2560. doi: 10.1242/dev.001065. [DOI] [PubMed] [Google Scholar]
- 47.Powers TP, Amemiya CT. Evidence for a Hox14 paralog group in vertebrates. Curr Biol. 2004;14:R183–R184. doi: 10.1016/j.cub.2004.02.015. [DOI] [PubMed] [Google Scholar]
- 48.Kuraku S, et al. Noncanonical role of Hox14 revealed by its expression patterns in lamprey and shark. Proc Natl Acad Sci USA. 2008;105:6679–6683. doi: 10.1073/pnas.0710947105. [DOI] [PMC free article] [PubMed] [Google Scholar]
- 49.Noonan JP, et al. Coelacanth genome sequence reveals the evolutionary history of vertebrate genes. Genome Res. 2004;14:2397–2405. doi: 10.1101/gr.2972804. [DOI] [PMC free article] [PubMed] [Google Scholar]
- 50.Brinkmann H, Venkatesh B, Brenner S, Meyer A. Nuclear protein-coding genes support lungfish and not the coelacanth as the closest living relatives of land vertebrates. Proc Natl Acad Sci USA. 2004;101:4900–4905. doi: 10.1073/pnas.0400609101. [DOI] [PMC free article] [PubMed] [Google Scholar]
- 51.Bejerano G, et al. A distal enhancer and an ultraconserved exon are derived from a novel retroposon. Nature. 2006;441:87–90. doi: 10.1038/nature04696. [DOI] [PubMed] [Google Scholar]
- 52.Nishihara H, Smit AF, Okada N. Functional noncoding sequences derived from SINEs in the mammalian genome. Genome Res. 2006;16:864–874. doi: 10.1101/gr.5255506. [DOI] [PMC free article] [PubMed] [Google Scholar]
- 53.Xie X, Kamal M, Lander ES. A family of conserved noncoding elements derived from an ancient transposable element. Proc Natl Acad Sci USA. 2006;103:11659–11664. doi: 10.1073/pnas.0604768103. [DOI] [PMC free article] [PubMed] [Google Scholar]
- 54.Yeh RF, Lim LP, Burge CB. Computational inference of homologous gene structures in the human genome. Genome Res. 2001;11:803–816. doi: 10.1101/gr.175701. [DOI] [PMC free article] [PubMed] [Google Scholar]
- 55.Kapustin Y, Souvorov A, Tatusova T, Lipman D. Splign: algorithms for computing spliced alignments with identification of paralogs. Biol Direct. 2008;3:20. doi: 10.1186/1745-6150-3-20. [DOI] [PMC free article] [PubMed] [Google Scholar]
- 56.Peri S, Pandey A. A reassessment of the translation initiation codon in vertebrates. Trends Genet. 2001;17:685–687. doi: 10.1016/s0168-9525(01)02493-3. [DOI] [PubMed] [Google Scholar]
- 57.Griffiths-Jones S, Saini HK, van Dongen S, Enright AJ. Tools for microRNA genomics. Nucleic Acids Res. 2008;36:D154–D158. doi: 10.1093/nar/gkm952. [DOI] [PMC free article] [PubMed] [Google Scholar]
- 58.Hertel J, et al. Non-coding RNA annotation of the genome of Trichoplax adhaerens . Nucleic Acids Res. 2009;37:1602–1615. doi: 10.1093/nar/gkn1084. [DOI] [PMC free article] [PubMed] [Google Scholar]
- 59.Lowe TM, Eddy SR. tRNAscan-SE: a program for improved detection of transfer RNA genes in genomic sequence. Nucleic Acids Res. 1997;25:955–964. doi: 10.1093/nar/25.5.955. [DOI] [PMC free article] [PubMed] [Google Scholar]
- 60.Jühling F, et al. tRNAdb 2009: compilation of tRNA sequences and tRNA genes. Nucleic Acids Res. 2009;37(database issue):D159–D162. doi: 10.1093/nar/gkn772. [DOI] [PMC free article] [PubMed] [Google Scholar]
- 61.Thompson JD, Higgins DG, Gibson TJ. CLUSTAL W: improving the sensitivity of progressive multiple sequence alignment through sequence weighting, position-specific gap penalties and weight matrix choice. Nucleic Acids Res. 1994;22:4673–4680. doi: 10.1093/nar/22.22.4673. [DOI] [PMC free article] [PubMed] [Google Scholar]
- 62.Frazer KA, Pachter L, Poliakov A, Rubin EM, Dubchak I. VISTA: computational tools for comparative genomics. Nucleic Acids Res. 2004;32:W273–W279. doi: 10.1093/nar/gkh458. [DOI] [PMC free article] [PubMed] [Google Scholar]
- 63.Morgenstern B, et al. Multiple sequence alignment with user-defined constraints. Bioinformatics. 2004;7:1271–1273. doi: 10.1093/bioinformatics/bti142. [DOI] [PubMed] [Google Scholar]
- 64.Tajima F. Simple methods for testing the molecular evolutionary clock hypothesis. Genetics. 1993;135:599–607. doi: 10.1093/genetics/135.2.599. [DOI] [PMC free article] [PubMed] [Google Scholar]
- 65.Kumar S, Nei M, Dudley J, Tamura K. MEGA: a biologist-centric software for evolutionary analysis of DNA and protein sequences. Brief Bioinform. 2008;9:299–306. doi: 10.1093/bib/bbn017. [DOI] [PMC free article] [PubMed] [Google Scholar]
- 66.Prohaska SJ, Fritzsch G, Stadler PF. Rate variations, phylogenetics, and partial orders. In: Ahdesmäki M, et al., editors. Fifth International Workshop on Computational Systems Biology. Tampere, Finland: WCSB; 2008. pp. 133–136. [Google Scholar]
- 67.Roth JJ, Breitenbach M, Wagner GP. Repressor domain and nuclear localization signal of the murine Hoxa-11 protein are located in the homeodomain: no evidence for role of poly-alanine stretches in transcriptional repression. J Exp Zool B Mol Dev Evol. 2005;304:468–475. doi: 10.1002/jez.b.21061. [DOI] [PubMed] [Google Scholar]
Associated Data
This section collects any data citations, data availability statements, or supplementary materials included in this article.