

Abstract
Forests and their soils contain the majority of the earth’s terrestrial carbon stocks. Changes in patterns of tree growth can have a huge impact on atmospheric cycles, biogeochemical cycles, climate change, and biodiversity. Recent studies have shown increases in biomass across many forest types. This increase has been attributed to climate change. However, without knowing the disturbance history of a forest, growth could also be caused by normal recovery from unknown disturbances. Using a unique dataset of tree biomass collected over the past 22 years from 55 temperate forest plots with known land-use histories and stand ages ranging from 5 to 250 years, we found that recent biomass accumulation greatly exceeded the expected growth caused by natural recovery. We have also collected over 100 years of local weather measurements and 17 years of on-site atmospheric CO2 measurements that show consistent increases in line with globally observed climate-change patterns. Combined, these observations show that changes in temperature and CO2 that have been observed worldwide can fundamentally alter the rate of critical natural processes, which is predicted by biogeochemical models. Identifying this rate change is important to research on the current state of carbon stocks and the fluxes that influence how carbon moves between storage and the atmosphere. These results signal a pressing need to better understand the changes in growth rates in forest systems, which influence current and future states of the atmosphere and biosphere.
Keywords: biomass change, carbon cycle, carbon fertilization, climate change, forest stand dynamics
The movement of carbon in our atmosphere, oceans, and terrestrial ecosystems is critical to predicting how climate change may influence the natural systems on which humans rely (1 –4). Changes in ecosystems can, in turn, feed back into global atmospheric cycles through evapotranspiration, net ecosystem CO2 exchange, and surface albedo and roughness, which complicates predictions about future climate states (1, 5 –7). Key evidence that global changes may affect the functioning of forests is shown in changes in forest biomass over time, which can have important implications for whether or not forests accumulate biomass at a rate that would alter current trends of atmospheric carbon cycling (8).
In densely forested regions across the globe, forests can recover rapidly from agricultural fields, logged stands, or areas cleared because of natural disturbances as long as remnant patches or seed banks remain. Across forest types, the period of recovery consists of a rapid rise in above-ground biomass (AGB) followed by a leveling off as the canopy fills in and biomass shifts from the sum of many small stems to fewer, larger canopy trees. The rate and asymptote of this pattern of biomass recovery can differ across stands because of nutrient availability and species composition or can differ between regions because of climate and disturbance regimens; however, the functional form of this response remains similar across forest types and regions (9, 10).
There are indications that forest biomass accumulation may be accelerating where nutrients and water are not limiting (11 –17). Distinguishing changes in forest dynamics caused by climate change from those changes caused by long-term stand recovery from disturbance, soil variables, species composition, and climate history is difficult (12, 18 –20). We were able to use a unique dataset that combines census data and stand-age data, from which we estimated biomass change, while controlling for stand regeneration. Our biomass estimates were gathered over varying census intervals for 55 plots in a temperate deciduous forest in and near the Smithsonian Environmental Research Center (SERC) in Edgewater, MD (38°53′18″N, 76°33′15″W). Plot sizes ranged from 75 to 15,625 m2 (median = 1,000 m2). Stand age was estimated from tree-core measurements and land-use history. From these data, we compared the expected rate of biomass accumulation caused by the ensemble response of stands to disturbance with recent growth rates derived from the census data. These stands contain similar species compositions (Materials and Methods) and differ only slightly in soils and topography. All plots have documented histories of agricultural use.
The Monod function effectively describes the increase in biomass of forests during recovery and thus, is appropriate to model patterns of resource use and limitation (10). The function for stand biomass in megagrams per hectare (Mg ha-1) for stand i is (Eq. 1):
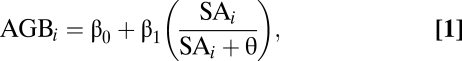 |
where β0 + β1 is the asymptote for the maximum biomass that a stand can achieve, SAi is the age of the stand, and θ is the age at half-saturation of the function.
We estimated the parameters β0, β1, and θ across the plots using hierarchical Bayesian methods (modified from ref. 21). We estimated biomass using species-specific algorithms relating diameter at breast height (DBH) to total AGB. Stand age was estimated from tree-ring counts of cores of the 10 largest trees immediately outside of the stand-plot boundary (see ref. 22 for detailed methods) and historical photographs of the stand sites (Materials and Methods). Fig. 1 shows the fit of Eq. 1 for 55 sites in red and 50 sampled curves from the posterior distributions of the estimated parameters in light blue. The blue lines highlight variation in parameter fits and not process error, which is larger and encompasses all plots. This is intended to show uncertainty in expectation of growth rates, which are defined as the tangent of these lines, but not intended to show if some sites have overall different biomass estimates than the mean. For sites that had multiple censuses, we used mean biomass at the mean stand age of those censuses to estimate function parameters.
Fig. 1.

Plot biomass increases with plot age in a predictable pattern. The Monod function (Eq. 1) describes the minimum and asymptotic biomass and the half-saturation point of the system. The red line shows the median curve from parameter estimates, whereas the blue lines indicate curves fit from 50 draws from the posterior distributions of the β and θ parameters. Points indicate site biomass and age at the means of censuses, where multiple measurements were taken (n = 55).
Results and Discussion
The Monod function in Eq. 1 gives the expected ensemble-growth trajectory. The derivative of Eq. 1 [β1 × θ/(SAi + θ)2], then provides a point estimate of expected annual biomass change given the age of a stand and the values of β1 and θ; 37 of 55 sites had more than one measurement taken between 1987 and 2005. To get annual biomass changes for a stand age, we divided the difference in biomass between census dates by the interval length. Using the mean stand age of each census interval from the β1 and θ parameters estimated from the ensemble data, we calculated the expected annual biomass change with error from posterior draws of the parameter estimates. Fig. 2A shows the census changes overlaid on the median ensemble estimate (red curve). Logged axes are used for clarity. Fig. 2B compares the observed biomass changes with those expected from the ensemble curve.
Fig. 2.

Accelerated growth of multiple-censused plots can be seen in A where plot censuses show increased biomass gain. Plot censuses (diamonds) are linked by lines. Plots that had only one census were used to estimate the ensemble curve and are plotted here in gray. The plotted curve is the same as in Fig. 1 but on a log scale with axes adjusted to show site biomass change more clearly. (B) The observed versus expected annual biomass change (Mg ha-1 yr-1) with 95% confidence limits (lines) from posterior parameter values of the estimated Monod function. Across all plot ages, consistently higher than expected annual biomass growth can be seen. Even plots that have a below or expected level of biomass increase show other years with higher than average biomass increase. Census intervals with negative growth (14 of 166 intervals) reflect biomass change because of tree death; they were not included in this figure but were included in analyses.
In 78% of the annual growth estimates, the observed AGB change between censuses exceeded the higher confidence bound of the estimated rate (in a binomial test, P < 0.0001). Tree death is the only way biomass can decrease in a plot, and therefore, a negative rate cannot be used to assess changes in growth. When census intervals were only considered if there was positive growth (growth without deaths of large trees), 90% of intervals showed greater than expected growth (Fig. 2B). Plots with positive growth show an average annual rate increase of 4.15 Mg ha-1 (confidence bounds of 3.55 and 4.74) above their expected increase given stand age. This increase was independent of stand age (P > 0.1) and the year of the census (P > 0.1).
These high biomass-rate increases across stand age must be a recent phenomenon. Extrapolating observed annual growth rates backward would lead either to dramatically lower than estimated stand ages or unrealistic biomass gain functions. Many potential mechanisms can influence the rate of biomass change. Table 1 lists six hypotheses that might explain the difference between the observed and expected values that we found. Increases in temperature, growing season, and atmospheric CO2 have documented influences on tree physiology, metabolism, and growth, and likely, they are critical to changing the rate of stand growth observed across stands.
Table 1.
Hypotheses to explain accelerated recent growth of forest stands
| Hypothesis | Description |
| Increased temperature | Higher temperatures over the growing season (or growing degree day sums) can increase metabolic rates and therefore, lead to more rapid carbon sequestration. |
| Increased growing season | Longer growing seasons (especially earlier springs) has been observed in many systems. A longer growing season would allow stands earlier leaf-flush and therefore, increased carbon sequestration. |
| Increased CO2 | Higher atmospheric CO2 can increase photosynthesis and lead to higher biomass accumulation. |
| Nutrient fertilization | Nitrogen and phosphorus fertilization from agricultural and urban runoff can increase tree growth. Atmospheric deposition of nitrogen has increased in urban and industrial regions in the United States in recent decades and could lead to soil fertilization as well. |
| Community composition | Some pioneer species tend to grow faster than others, especially sweet gum (Liriodendron styraciflua) and tulip poplar (Liquidambar tulipifera). An influx of these species into a plot or a preponderance of fast-growing species recently becoming dominant could lead to an increase in biomass accumulation. |
| Demographic stochasticity | Although a stand may follow the ensemble biomass-accumulation pattern, random deaths of large trees can lower the stand biomass, and rapid regeneration will quickly increase the biomass as if the plot were, through a death, moved to a younger state. |
Increased Temperature.
Temperature is critical to all metabolic processes involved in uptake, release, and storage of carbon. Rising temperatures, especially when coinciding with adequate precipitation and without resource limitation, can increase tree metabolic processes that, in turn, lead to higher biomass accumulation (6, 23). Temperate forest trees have shown a broader range of temperatures for optimal photosynthesis than have tropical forests, and they can likely respond quickly to increased temperatures (24). Observational studies correlating temperature to diameter growth across forest types have shown both increases (15, 25) and decreases (26, 27) in response to higher temperatures. Decreases are likely caused by water limitation of photosynthesis, which is not the case at the SERC stands. Mean and maximum temperatures near SERC have shown consistent long-term increases (Fig. 3A).
Fig. 3.

Environmental measurements that address hypotheses for accelerated recent growth. (A) Temperature measurements (maximum, mean, and minimum) for Baltimore Washington International Airport are shown. Maximum and mean temperature showed significant increases (P < 0.0001). Minimum temperature showed no trend. (B) Data from Annapolis, MD (15 km north of Edgewater) showed that first frosts arrive later and last frosts arrive sooner, increasing the length of the frost-free growing season (growing season shown as days, first and last frosts as day of the year). (C) Maximum annual CO2 levels (ppm) at SERC (black dots) and measurements from Mauna Loa (red line; data from ref. 50) are shown.
Increased Growing Season.
Higher temperatures are also correlated with longer growing seasons (Fig. 3B). A steady lengthening of the growing season has been documented worldwide (7), and even a shift in the seasonal phase of surface temperatures has been detected (28). Growing degree days correlate with the speed of forest recovery from pasture in the Amazon (9, 29) and increased plant growth in boreal forests (11, 25). Fig. 3B shows that last frosts of winter have come earlier and first frosts of fall have come later in the SERC region over the last century, significantly increasing the length of the growing season.
Increased CO2.
Atmospheric CO2 can increase tree growth through carbon fertilization (30). Trees have shown species-specific increases in growth under elevated CO2, but nutrient and water limitation can mitigate growth (31). Measurements of CO2 from SERC match the increases observed from annual averages on Mauna Loa (Fig. 3C). Higher atmospheric CO2 levels can also cause higher temperatures and longer growing seasons (1, 5, 8). Interactions and feedbacks are expected to drive growth when nutrients, such as N or P, and water are not limiting.
Nutrient Fertilization.
Phosphorous fertilization is primarily thought to be possible in the tropics, where P and N are not limited. In temperate forests, increases in soil nitrogen caused by agricultural and expanding urban areas have lead to increased N in runoff. Magnani et al. (32) estimate that N is responsible for significant temperate forest growth above background response to disturbance (33). In our forest stands, however, systematic increases in soil nutrients (e.g., available N and P) caused by atmospheric deposition or groundwater enrichment have not occurred recently. On the western shore of the Chesapeake Bay, data on atmospheric deposition of NO- 3 and NH+ 4 show that although this region has higher levels of nutrient deposition than the national average, measured deposition has declined since 1983 (34). Nutrient fertilization through groundwater can also be ruled out, because the agricultural history of these sites is well-documented; additionally, no increase in nearby farming occurred (fields have actually consistently been removed from agricultural use in the region).
Community Composition.
Different species can correlate with different stages of recovery from disturbance. Differential species growth rates, therefore, could potentially influence biomass-accumulation rates (35, 36). In our forest stands, the most prevalent pioneer species that could influence stand growth rates were sweet gum (Liquidambar styraciflua) and tulip poplar (Liriodendron tulipifera). Neither species showed a positive relationship with the difference between observed and expected biomass growth (Fig. 2B).
Demographic Stochasticity.
Forest stands can respond to gaps created by the death of large trees with rapid regrowth. If our censuses consistently sampled forest growth directly after a large mortality event, then we could have recorded the accelerated growth response to gap formation. However, this explanation does not hold, because we witnessed few gap events (only 8% of all interval estimates showed biomass losses), far fewer than would be expected if death and recovery explained the observed growth rates. Furthermore, our growth rates were observed in stands of many different ages, the younger of which (<60 years old) would not be expected to have large mortality events.
Overall, we found that the recent accelerated growth in our forest stands cannot be explained by random sampling after mortality events. Changes in community species composition also failed to explain changing growth rates. Most likely, a combination of long-term temperature increases, longer growing seasons, and CO2 fertilization have combined to increase the recent rate of biomass gain in these forest stands above their long-term trend.
State and Rate of Terrestrial Carbon Stocks.
Forests form a critical component of the terrestrial carbon cycle. Trees absorb carbon, store carbon, and release carbon through abscission and decomposition. Calculating the amount of carbon stored in forests (37, 38) guides predictions of how much potential carbon could move from storage (sinks) into the atmosphere (6). Just as deforestation constitutes an important cause of carbon leaving terrestrial stocks, regrowth of forests after land-use change has been recognized as critical to the removal of carbon from the atmosphere (39, 40). This sequestration of carbon from the atmosphere into recovering forests can continue even for forests over 800 years old (41).
The long-term pattern of biomass accumulation after stand-initiation events allows one to distinguish recovery caused by disturbance from other factors, such as changes in climate (13, 42). Our direct test of observed biomass gains given known stand histories shows that forest systems can change long-term patterns because of widely recorded climate changes. Furthermore, our study quantifies this rate change. This finding casts estimates of carbon flux in a new light, as it indicates that in this forest, carbon is being absorbed at a new, higher rate than it was in the past. Additionally, although our evidence suggests no change in these rates over the past 20 years, we expect them to decline when nutrients or water become limiting factors (2, 6). Our study also supports the growing understanding that climate change is not just changing features of the environment but changing the systems that drive feedback to the atmosphere.
We found that the recent increase in growth was unrelated to stand age (t = −1.08; P = 0.28), averaging 3.4 Mg ha−1yr−1 (2.8–4.2) across all measurement intervals, even those with catastrophic tree death. The proportion of total biomass accumulation represented by the increased growth we describe depends on stand age. In stands younger than about 50 years, the observed rate increase can be as little as one-third of total growth, but in older stands, it can be the majority of growth; under the expectation of the ensemble function, old forests should grow very little as they approach equilibrium.
The accelerated growth we have documented raises two key questions. First, how widespread is the accelerated growth that we have measured? Although our plot censuses have offered a rare replication of biomass trends across centuries of stand regeneration, there are likely other sources of similar data. Forest stands at SERC are not very different in composition or climate from the secondary forests that cover the eastern United States, making broad comparisons with similar datasets relevant. Dendrochronological analyses of historical growth, forest stands with known land-use history, and forests exposed to periodic storms could help determine the scope of current forest biomass response to climate change. We encourage forest ecologists to match recent census data against long-term trends in regeneration.
Second, which specific mechanisms are driving the observed change in growth rate of the SERC forest sites? It is possible that temperature, CO2 fertilization, and growing-season length interactively contributed to recent growth-rate increases, but a finer understanding of these processes is important. When in the growing season does the response occur? Which are the essential nutrients that allow growth increases? When are these rate increases likely to level off? With the advent of more aggressive and fine-scale monitoring of forest–atmosphere boundaries (e.g., the National Ecological Observatory Network), we should soon gain important new data relevant to these questions. Continuing to monitor and analyze how forests behave in the context of changing climate is important to better understand and predict long-term ecosystem dynamics.
Materials and Methods
Site and Census Methods.
Biomass was estimated from DBH measurements of trees over 2 cm DBH at or near the Smithsonian Environmental Research Center, which is about approximately 15 km south of Annapolis, MD (38°53′N, 76°33′W) on the western shore of the Chesapeake Bay. The stands are all of the tulip-poplar association (43) or yellow-poplar cover type (44), and we chose them as representative of the stages in a successive sequence. The tulip-poplar association is a common upland forest type in the mid-Atlantic coastal plain and piedmont (43, 45). For several decades after timbering or abandonment from agriculture, this forest type was dominated by dense populations of sweet gum (Liquidambar styraciflua L) or tulip poplar (Liriodendron tulipifera L). Understory species like ironwood (Carpinus caroliniana Walter) and dogwood (Cornus florida L) then appear in these areas, as do additional overstory species, such as oaks (Quercus spp.) and hickories (Carya spp.). In the mature stages, the canopy is composed of oaks, hickories, beech (Fagus grandifolia Ehrhart), and some tulip poplar with a diverse complement of mid- and subcanopy species. L. tulipifera, although not always dominant, occurs at most stages (46). All of the stands were on level (slope = 0–7.5°), upland, well-drained sites of the Marr–Westphalia–Sassafras soil association (47) within 5 km of each other. It should be noted that dogwood anthracnose, the fungal disease Discula destructiva, killed many of the understory dogwoods at these sites over the past decade, and although they do not contribute high proportions of biomass to these sites, these deaths, if anything, would lower our observed growth rates.
We defined the successive age of a stand as the number of years since it was cut over or abandoned from agriculture. We determined this interval from two sources. Aerial photographs covering most of the study sites were available for the years 1938, 1951, 1952, 1957, 1960, 1963, 1970, 1980, 1981, and 1988. These provided a finite possible range of ages and a finite possible error for each of the younger plots. We adjusted some of the age estimates up or down (within the possible range) after some further, somewhat more subjective, examination of the photographs. We also took wood cores from the 10 largest individuals outside of the plots and determined their age, adding 5 years to account for pre-ring growth to estimate the age of the original cohort. In older stands, where the oldest trees may have already died, this method underestimates stand age. In these cases, the older stands would further support a biomass asymptote at younger ages and lead to an expectation of even lower growth that we estimate here.
To estimate biomass, all woody plants with 2 cm and greater DBH were identified in every stand, measured, and assessed for condition. Species-specific allometric equations from the tabulation of Jenkins et al. (48) were used to estimate AGB from live tree-stem DBH. For species where equations were unavailable, we used the general equations of Jenkins et al. (49).
Bayes Monod Model.
The Monod function in Eq. 1 was estimated by taking advantage of the linear transformation of the alternate parameterization (Eq. 2)
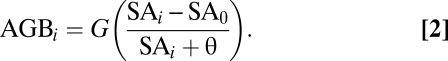 |
Here, the asymptote G = β0 + β1 in Eq. 1 and SA0 = −β0θ/G are the minimum stand ages that register positive stand biomass. When made linear as in Eq. 1, we model biomass with error, such as E(biomassi) = AGBi + εi where εI ∼ N(0, σ2). In the Bayesian model, we used uniform priors in logical ranges on β0, β1, and θ to facilitate convergence. σ2 was estimated with a scaling factor for age to account for increasing variance with increasing stand age. This absorbed uncertainty in stand differences that would otherwise be wrongly attributed to parameter estimates. Ten chains beginning from random draws of the parameters were run for 50,000 iterations each in the hybrid Gibbs, Metropolis–Hastings sampling algorithm. The chains were highly similar (mixed), and therefore, they were thinned and combined to provide the posterior distributions shown in Table 2.
Table 2.
Posterior estimates of the Monod parameters
| β0 | β1 | θ | σ | |
| Median | −34.9 | 737.2 | 77.8 | 99.1 |
| 2.5% | −99.3 | 581.9 | 38.2 | 68.2 |
| 97.5% | 2.3 | 952.7 | 135.7 | 151.5 |
Acknowledgments
The authors would like to thank Stuart Davies, Jessica Metcalf, John Parker, Patrick Baker, Nancy Khan, and two anonymous reviewers for helpful comments on the manuscript. We thank Bert Drake for providing the SERC CO2 data. George Rasberry, Donna Tibbs, Michelle Berger, and many volunteers helped to establish and maintain the SERC chronosequence. Funding sources included the HSBC Bank’s Climate Partnership and the Smithsonian Tropical Research Institute’s Center for Tropical Forest Science.
Footnotes
The authors declare no conflict of interest.
This article is a PNAS Direct Submission.
References
- 1.Barford CC, et al. Factors controlling long-and short-term sequestration of atmospheric CO2 in a mid-latitude forest. Science. 2001;294:1688–1691. doi: 10.1126/science.1062962. [DOI] [PubMed] [Google Scholar]
- 2.Schimel DS, et al. Recent patterns and mechanisms of carbon exchange by terrestrial ecosystems. Nature. 2001;414:169–172. doi: 10.1038/35102500. [DOI] [PubMed] [Google Scholar]
- 3.Wright SJ. Tropical forests in a changing environment. Trends Ecol Evol. 2005;20:553–560. doi: 10.1016/j.tree.2005.07.009. [DOI] [PubMed] [Google Scholar]
- 4.Solomon S, Qin D, Manning M, Chen Z, Marquis M, Averyt KB, Tignor M, Miller HL, editors. Climate Change 2007: The Physical Science Basis. Contribution of Working Group I to the Fourth Assessment Report of the Intergovernmental Panel on Climate Change. Cambridge University Press, Cambridge, United Kingdom and New York, NY, USA. [Google Scholar]
- 5.Cao M, Woodward F. Dynamic responses of terrestrial ecosystem carbon cycling to global climate change. Nature. 1998;393:249–252. [Google Scholar]
- 6.Luo Y. Terrestrial carbon–cycle feedback to climate warming. Annu Rev Ecol Syst. 2007;38:683–712. [Google Scholar]
- 7.Penuelas J, Rutishauser T, Filella I. Ecology. Phenology feedbacks on climate change. Science. 2009;324:887–888. doi: 10.1126/science.1173004. [DOI] [PubMed] [Google Scholar]
- 8.Schimel D. Carbon cycle conundrums. Proc Natl Acad Sci USA. 2007;104:18353–18354. doi: 10.1073/pnas.0709331104. [DOI] [PMC free article] [PubMed] [Google Scholar]
- 9.Johnson C, Zarin D, Johnson A. Post-disturbance aboveground biomass accumulation in global secondary forests. Ecology. 2000;81:1395–1401. [Google Scholar]
- 10.Clark D, et al. Application of 1-m and 4-m resolution satellite data to ecological studies of tropical rain forests. Ecol Appl. 2004;14:61–74. [Google Scholar]
- 11.Myneni R, Keeling C, Tucker C, Asrar G, Nemani R. Increased plant growth in the northern high latitudes from 1981 to 1991. Nature. 1997;386:698–702. [Google Scholar]
- 12.Lewis SL, et al. Concerted changes in tropical forest structure and dynamics: Evidence from 50 South American long-term plots. Philos Trans R Soc Lond B Biol Sci. 2004;359:421–436. doi: 10.1098/rstb.2003.1431. [DOI] [PMC free article] [PubMed] [Google Scholar]
- 13.Lewis SL, et al. Increasing carbon storage in intact African tropical forests. Nature. 2009;457:1003–1006. doi: 10.1038/nature07771. [DOI] [PubMed] [Google Scholar]
- 14.Boisvenue C, Running S. Impacts of climate change on natural forest productivity—evidence since the middle of the 20th century. Glob Change Biol. 2006;12:862–882. [Google Scholar]
- 15.Delpierre N, et al. Exceptional carbon uptake in European forests during the warm spring of 2007: A data-model analysis. Glob Change Biol. 2009;15:1455–1474. [Google Scholar]
- 16.Salzer M, Hughes M, Bunn A, Kipfmueller K. Recent unprecedented tree-ring growth in bristlecone pine at the highest elevations and possible causes. Proc Natl Acad Sci USA. 2009;106:20348–20353. doi: 10.1073/pnas.0903029106. [DOI] [PMC free article] [PubMed] [Google Scholar]
- 17.Chave J, et al. Assessing evidence for a pervasive alteration in tropical tree communities. PLoS Biol. 2008;6:e45. doi: 10.1371/journal.pbio.0060045. [DOI] [PMC free article] [PubMed] [Google Scholar]
- 18.Clark D. Are tropical forests an important carbon sink? Reanalysis of the long-term plot data. Ecol Appl. 2002;12:3–7. [Google Scholar]
- 19.Baker P, Bunyavejchewin S, Oliver C. Disturbance history and historical stand dynamics of a seasonal tropical forest in western Thailand. Ecol Monogr. 2005;75:317–343. [Google Scholar]
- 20.Gloor M, et al. Does the disturbance hypothesis explain the biomass increase in basin-wide Amazon forest plot data? Glob Change Biol. 2009;15:2418–2430. [Google Scholar]
- 21.Clark J, Mohan J, Dietze M, Ibanez I. Coexistence: How to identify trophic trade-offs. Ecology. 2003;84:17–31. [Google Scholar]
- 22.Brown M, Parker G. Canopy light transmittance in a chronosequence of mixed-species deciduous forests. Can J For Res. 1994;24:1694–1703. [Google Scholar]
- 23.Anderson KJ, Allen AP, Gillooly JF, Brown JH. Temperature-dependence of biomass accumulation rates during secondary succession. Ecol Lett. 2006;9:673–682. doi: 10.1111/j.1461-0248.2006.00914.x. [DOI] [PubMed] [Google Scholar]
- 24.Cunningham S, Read J. Do temperate rainforest trees have a greater ability to acclimate to changing temperatures than tropical rainforest trees? New Phytol. 2003;157:55–64. doi: 10.1046/j.1469-8137.2003.00652.x. [DOI] [PubMed] [Google Scholar]
- 25.Dunn AL, Barford C, Wofsy S, Goulden M, Daube B. A long-term record of carbon exchange in a boreal black spruce forest: Means, responses to interannual variability, and decadal trends. Glob Change Biol. 2007;13:577–590. [Google Scholar]
- 26.Clark DA, Piper SC, Keeling CD, Clark DB. Tropical rain forest tree growth and atmospheric carbon dynamics linked to interannual temperature variation during 1984–2000. Proc Natl Acad Sci USA. 2003;100:5852–5857. doi: 10.1073/pnas.0935903100. [DOI] [PMC free article] [PubMed] [Google Scholar]
- 27.Feeley KJ, Wright SJ, Nur Supardi MN, Kassim AR, Davies SJ. Decelerating growth in tropical forest trees. Ecol Lett. 2007;10:461–469. doi: 10.1111/j.1461-0248.2007.01033.x. [DOI] [PubMed] [Google Scholar]
- 28.Stine AR, Huybers P, Fung IY. Changes in the phase of the annual cycle of surface temperature. Nature. 2008;457:435–440. doi: 10.1038/nature07675. [DOI] [PubMed] [Google Scholar]
- 29.Zarin D, Ducey M, Tucker J, Salas W. Potential biomass accumulation in Amazonian regrowth forests. Ecosystems (NY) 2001;4:658–668. [Google Scholar]
- 30.Pataki D, et al. Urban ecosystems and the North American carbon cycle. Glob Change Biol. 2006;12:2092–2102. [Google Scholar]
- 31.Oren R, et al. Soil fertility limits carbon sequestration by forest ecosystems in a CO2-enriched atmosphere. Nature. 2001;411:469–472. doi: 10.1038/35078064. [DOI] [PubMed] [Google Scholar]
- 32.Magnani F, et al. The human footprint in the carbon cycle of temperate and boreal forests. Nature. 2007;447:848–850. doi: 10.1038/nature05847. [DOI] [PubMed] [Google Scholar]
- 33.DeSchrijver A, et al. Nitrogen saturation and net ecosystem production. Nature. 2008;451:1. doi: 10.1038/nature06578. [DOI] [PubMed] [Google Scholar]
- 34.National Atmospheric Deposition Program (NRSP-3)/National Trends Network. 2004. NADP Program Office, Illinois State Water Survey. Available at http://nadp.sws.uiuc.edu/. Accessed Oct 2009.
- 35.Marín-Spiotta E, Ostertag R, Silver WL. Long-term patterns in tropical refor-estation: Plant community composition and aboveground biomass accumulation. Ecol Appl. 2007;17:828–839. doi: 10.1890/06-1268. [DOI] [PubMed] [Google Scholar]
- 36.Pare D, Bergeron Y. Above-ground biomass accumulation along a 230-year chronosequence in the southern portion of the Canadian boreal forest. J Ecol. 1995;83:1001–1007. [Google Scholar]
- 37.Pacala S, et al. Consistent land- and atmosphere-based U.S. carbon sink estimates. Science. 2001;292:2316–2320. doi: 10.1126/science.1057320. [DOI] [PubMed] [Google Scholar]
- 38.Houghton R. Aboveground forest biomass and the global carbon balance. Glob Change Biol. 2005;11:945–958. [Google Scholar]
- 39.Rhemtulla J, Mladenoff D, Clayton M. Historical forest baselines reveal potential for continued carbon sequestration. Proc Natl Acad Sci USA. 2009;106:6082–6087. doi: 10.1073/pnas.0810076106. [DOI] [PMC free article] [PubMed] [Google Scholar]
- 40.Shevliakova E, et al. Carbon cycling under 300 years of land use change: Importance of the secondary vegetation sink. Global Biogeochem Cycles. 2009;23:GB2022. [Google Scholar]
- 41.Luyssaert S, et al. Old-growth forests as global carbon sinks. Nature. 2008;455:213–215. doi: 10.1038/nature07276. [DOI] [PubMed] [Google Scholar]
- 42.Stephens BB, et al. Weak northern and strong tropical land carbon uptake from vertical profiles of atmospheric CO2 . Science. 2007;316:1732–1735. doi: 10.1126/science.1137004. [DOI] [PubMed] [Google Scholar]
- 43.Brush G, Lenk C, Smith J. The natural forests of Maryland: An explanation of the vegetation map of Maryland. Ecol Monogr. 1980;50:77–92. [Google Scholar]
- 44.Eyre F. In: Forest Cover Types of the United States and Canada. Eyre F, editor. Washington, DC: Society of American Foresters; 1980. [Google Scholar]
- 45.Monette R, Ware S. Early forest succession in the Virginia coastal plain. Bull Torrey Bot Club. 1983;110:80–86. [Google Scholar]
- 46.Buckner E, McCracken W. Yellow-poplar: A component of climax forests? J For. 1978;76:421–423. [Google Scholar]
- 47.Kirby RM, Matthews ED. Soil Survey of Anne Arundel County, Maryland, U.S. Washington, DC: U.S. Government Printing Office; 1973. [Google Scholar]
- 48.Jenkins J, Chojnacky D, Heath L, Birdsey RA. Comprehensive Database of Diameter-Based Biomass Regressions for North American Tree Species. General Technical Report NE-319. Washington, DC: USDA Forest Service; 2004. [Google Scholar]
- 49.Jenkins J, Chojnacky D, Heath L, Birdsey RA. National-scale biomass estimators for United States tree species. For Sci. 2003;49:12–35. [Google Scholar]
- 50.Keeling R, Piper S, Bollenbacher A, Walker J. Trends: A Compendium of Data on Global Change. Oak Ridge, TN: U.S. Department of Energy; 2009. [Google Scholar]