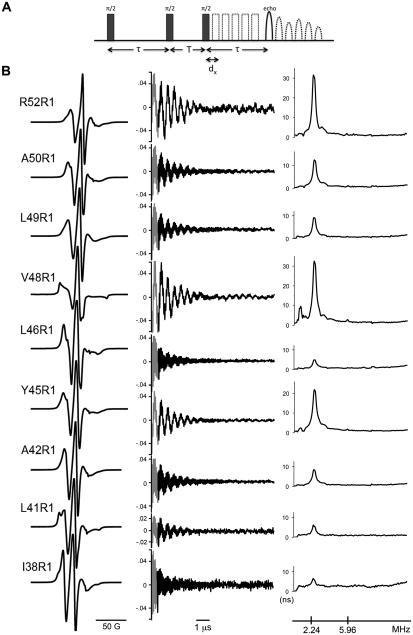
Figure 2.
Lineshape and 2H ESEEM data of R1 constructs reconstituted in POPC:POPG vesicles. (A) Schematic of the three-pulse ESEEM experimental design. Three π/2 pulses are separated by the time constants τ and T, with T sequentially delayed by dx increments, resulting in the modulation of the observed spin echo. The time constant τ is adjusted to tune the system for optimal detection of a frequency of interest. (B) Left: X-band first-derivative absorption spectra acquired at room temperature over a scan width of 200 G. Middle: ESEEM data obtained with τ = 224 ns (to optimize detection of 2H) in the presence of D2O. The black trace is the normalized time domain data. The grey segment is the back-calculated dead-time signal (see Methods). Right: frequency domain ESEEM signal. The deuteron (2.24) and phosphorous (5.95) frequencies are indicated in MHz units.

