Figure 5.
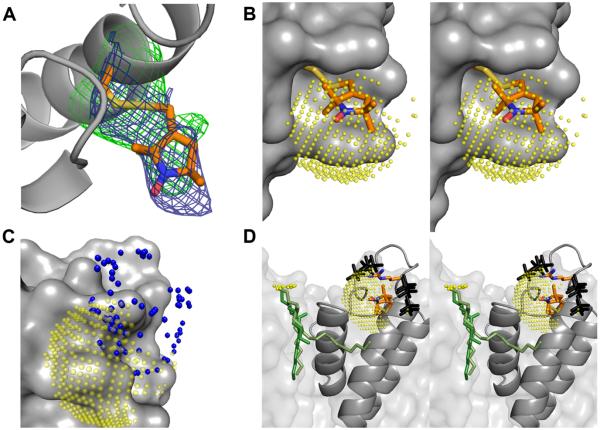
The structure of V48R1 and the phosphate interaction surface. (A) KcsA is shown as a grey ribbon and the V48R1 side chain is shown in stick representation with carbon, nitrogen, oxygen, and sulphur atoms colored orange, blue, red, and yellow, respectively. The 2Fo-Fc map is contoured at 1σ (blue) and the Fo-Fc map is contoured at 2.7σ (green). (B) Stereo view of V48R1 with a 5 Å 31P ESEEM interaction surface (translucent yellow spheres) centered on the nitroxide nitrogen. The sphere is sampled at ~0.5 Å and only sterically feasible areas of the sphere are shown. KcsA is shown as a grey van der Waals surface. (C) Possible positions of the R52R1 nitroxide nitrogen based on preferred nitroxide dihedral angles (39) are shown as blue spheres together with the KcsA channel as a grey van der Waals surface and the yellow V48R1 interaction surface. (D) Stereo view of sterically feasible phosphate positions (black) assuming the presence of a R52-phosphate interaction located on the V48R1 interaction surface (yellow), i.e. both V48R1 and R52R1 couple to the same phospholipid. The side chains of R52 and V48R1 as well as a crystallographically observed lipid (two alternative green models, see PDB entries 1K4C and 1R3J) are shown in stick representation. The position of the phosphate head group of the lipid is not resolved. Possible positions of the phosphorous are shown as small yellow spheres.

