

Abstract
Human colorectal cancer (CRC) is one of the better-understood systems for studying the genetics of cancer initiation and progression. To develop a cross-species comparison strategy for identifying CRC causative gene or genomic alterations, we performed array comparative genomic hybridization (aCGH) to investigate copy number abnormalities (CNAs), one of the most prominent lesion types reported for human CRCs, in 10 spontaneously occurring canine CRCs. The results revealed for the first time a strong degree of genetic homology between sporadic canine and human CRCs. First, we saw that between 5% and 22% of the canine genome was amplified/deleted in these tumors, and that, reminiscent of human CRCs, the total altered sequences directly correlated to the tumor's progression stage, origin, and likely microsatellite instability status. Second, when mapping the identified CNAs onto syntenic regions of the human genome, we noted that the canine orthologs of genes participating in known human CRC pathways were recurrently disrupted, indicating that these pathways might be altered in the canine CRCs as well. Last, we observed a significant overlapping of CNAs between human and canine tumors, and tumors from the two species were clustered according to the tumor subtypes but not the species. Significantly, compared with the shared CNAs, we found that species-specific (especially human-specific) CNAs localize to evolutionarily unstable regions that harbor more segmental duplications and interspecies genomic rearrangement breakpoints. These findings indicate that CNAs recurrent between human and dog CRCs may have a higher probability of being cancer-causative, compared with CNAs found in one species only.
Cancer is a disease of the genome, and genomic instability is a hallmark of cancer (Hanahan and Weinberg 2000). As cancer progresses, more extensive genomic instability develops, and more abnormal changes accumulate on the genome (e.g., copy number abnormalities or CNAs, translocations, and inversions) (Albertson et al. 2003). While some of these aberrations disrupt normal cellular processes and indeed contribute to cancer development and progression, others emerge simply as passenger alterations of cancer genomic instability and play no role in disease etiology. Clearly, finding genomic abnormalities is important, but identifying those that are cancer-causative is even more meaningful.
A central aim of cancer research has been to identify causative (or driver) alterations. This has become both increasingly challenging and urgent in recent years with the launch of high-throughput cancer genome projects, such as the Cancer Genome Atlas (http://cancergenome.nih.gov/), the International Cancer Genome Consortium (http://www.icgc.org/), and others (e.g., Greenman et al. 2007; Jones et al. 2008). Researchers have been tackling this challenge by improving experimental conditions (e.g., high-resolution microarray to refine the boundaries of amplicons to narrow down the “driver” genes; see Haverty et al. 2008) and by developing more sophisticated statistical models and functional analysis strategies to systematically (Aebersold et al. 2009) identify significant abnormalities (e.g., Beroukhim et al. 2007; Greenman et al. 2007; Jones et al. 2008).
We are developing a cross-species comparison strategy that differs fundamentally from the current published approaches described above (which study humans only). We hypothesize that causative alteration candidates can be distinguished from consequent candidates by examining orthologous genes or genomic loci with tumors from multiple species having the same type of cancer. Provided these species share similar molecular and genetic pathways of cancer development and progression, abnormalities that are recurrent among different species will be deemed causative, whereas those that are found in only one species and are located in evolutionarily unstable sites will be considered consequent (bystanders or passengers) (Fig. 1). In our study, evolutionarily unstable sites are defined as regions enriched with interspecies genomic rearrangement breakpoints (ISGRBPs) (Pevzner and Tesler 2003; Zhao et al. 2004) and segmental duplications (SDs) (Bailey et al. 2002, 2004; Turner et al. 2007; Kidd et al. 2008).
Figure 1.

(A) Cross-species comparison for causative (or driver) aberration identification. Once we demonstrate that the same types of cancer from the human and the dog share similar molecular and genetic pathways of cancer development and progression, we will consider abnormalities recurrent between the two species as driver candidates (solid gray area), and those found in only one species and falling in evolutionarily unstable sites (EIN sites) as passenger candidates (small squared areas). Those in the parallel-lined areas need further studies. (B) The advantage of the human–dog comparison strategy over the human-only strategy for cancer driver gene identification. The cross-species comparison strategy can make use of the difference in the genomic location of orthologous genes between the human and the dog, a result of evolutionary genomic rearrangements that occurred since the two species diverged more than 75 million years ago. This shows that two genes, which are nearby in the human genome but distant in the dog genome, are both disrupted in the human cancer (boxed with broken lines). However, in the dog cancer, only one gene is disrupted, which will be considered as driver, and the other is intact (boxed with unbroken lines), which will be deemed as passenger.
Our hypothesis rests on the same rationale that cancer researchers have been using for years: abnormalities recurrent among different cases are more likely to be causative, compared with nonrecurrent events. The difference is we are searching for events that are recurrent not only among different cases within the same species, but also among different species. Compared with single-species approaches, this multispecies comparison strategy can better distinguish causative events from passenger alterations of cancer genomic instability, by taking account of the difference in the genomic location of orthologous genes and loci caused by interspecies genomic rearrangements that occurred during evolution (Fig. 1). For instance, chromosome region 18q is often found to be deleted in human colorectal cancer (CRC). Except for SMAD4, which is clearly demonstrated to be a CRC driver gene (Kinzler and Vogelstein 1996), the roles of many 18q genes in CRC development and progression remain unclear, and it is possible that some of these genes are deleted in human CRC simply because they are near SMAD4. We have found that interspecies genomic rearrangements have dispatched many such genes far away from SMAD4 via translocations or inversions in the dog genome. Studying dog CRCs could shed light on whether these genes are drivers or passengers, provided we can first show that dog and human CRCs share similar molecular and genetic pathways of cancer development and progression.
To test this cross-species strategy, we have been conducting a comparative study between sporadic human and canine CRCs. Human CRC is one of the better-understood systems for studying the genetics of cancer initiation and progression. The proposed stepwise model of human colorectal carcinogenesis (Kinzler and Vogelstein 1996; Rajagopalan et al. 2003) highlights the key role of genomic instability, which occurs in the form of either chromosomal instability (CIN) (Lengauer et al. 1997) or microsatellite instability (MSI) (Toft and Arends 1998). MSI, which is characterized by a high level of single- or oligo-base mutations, due to defective DNA mismatch repair (MMR) (Grady 2004), and recognized by indel mutations in microsatellite loci (Boland et al. 1998), occurs in ∼13% of human sporadic CRCs. CIN, characterized by CNAs of relatively narrow genomic regions ranging from single loci to entire chromosomes, occurs in 87% of human sporadic CRCs. Although the role that CIN plays in causing cancer is unclear, the occurrence of CNAs could result in inactivation of tumor suppressors (e.g., APC, SMAD4, and TP53), as well as overactivation of oncogenes, such as KRAS. This could, in turn, disrupt key signaling pathways of Wnt, TGF-beta, p53, and others that play fundamental roles in CRC development and progression (Kinzler and Vogelstein 1996; Gallahan and Callahan 1997; Rajagopalan et al. 2003; Grady 2004; Sancho et al. 2004; Kaiser et al. 2007).
Because of its importance in human CRCs, we investigated genomic instability in 10 spontaneously occurring dog CRCs and reported the results here. This study yielded, for the first time, several pieces of evidence in support of dog CRCs possibly following similar molecular pathways of cancer development and progression as human CRCs. First, via array comparative genome hybridization (aCGH) analyses, we found that reminiscent of human CRCs, between 5% to 22% of the canine genome was either amplified or deleted in these canine tumors, and that the total amount of altered genomic sequences directly correlated to the tumor's progression stage, origin, and likely MSI status. Second, mapping of the identified dog CNAs to the better-annotated human genome revealed that the canine orthologs of many genes involved in known human CRC development and progression pathways were disrupted, indicating that these pathways might also be altered in these canine CRCs. Third, we observed a significant overlapping of CNAs between human and canine tumors, and tumors from the two species were clustered according to the tumor subtypes, but not according to the species. Besides these genetic similarities between the two species, our analyses revealed that the CNAs found in only one species (especially the human) localize to evolutionarily unstable genomic regions that harbor more SDs and ISGRBPs compared with CNAs found in both species. This indicates that shared CNAs might be more significant in CRC etiology compared with species-specific (especially human-specific) CNAs.
Results
CNA identification of dog colorectal tumors
We performed aCGH analyses on a total of 10 sporadic dog colorectal tumors, which covered tumors at early (adenomas) and late (adenocarcinomas) cancer progression stages (Fig. 2), as well as tumors of epithelial origin (adenomas and adenocarcinomas) and nonepithelial origin (a mast cell tumor; a leiomyosarcoma that arose from muscle cells). As summarized in Table 1, we identified between 2000 and 10,000 CNAs per canine tumor genome, with sizes ranging from 17 kb to 1.7 Mb with an average of 40–60 kb (varied with the tumors; see Fig. 3 for the identified CNAs for one tumor). These CNAs have a total probe number of between 5 and 208, with log2-ratio means ranging from 0.15 to 2.36. To validate our aCGH analyses, we performed quantitative polymerase chain reaction (qPCR) analyses on a small fraction of CNAs identified, including regions within a number of genes (e.g., GSK3B, APC, SMAD3, SMAD2, SMAD4, TGFB2, TGFBR2, PTEN, and TP53), as well as two deleted regions on chromosomes 5 and 9. Through t-tests (see Methods), we confirmed deletions in APC, PTEN, SMAD3, SMAD2, SMAD4, TP53, and the regions on chromosomes 5 and 9, as well as amplifications in TGFB2 and GSK3B (P-values ranged from 0.001 to <0.1), indicating the accuracy of our aCGH analyses.
Figure 2.

Cryosectioning and H&E staining of dog colon tumor and normal tissue samples. The images represent a normal colon tissue (top), an adenoma (middle), and an adenocarcinoma (bottom).
Table 1.
CNAs identified in 10 dog colorectal tumors

Chromosomes X, Y, M, and UN were not included.
aAdenomas (T1, T4, and T6) are early-stage tumors, with T1 being more advanced than T4 and T6 and exhibiting a weak MSI phenotype. Adenocarcinomas (T3 and T8–T11) are late-stage tumors. Both adenomas and adenocarcinomas originated from colon epithelial cells. A metastatic mast cell tumor (T5) is a late-stage tumor originated from mast cells, and leiomyosarcoma (T7) is a late-stage tumor originated from smooth muscle cells.
Figure 3.

(A) CNAs identified in the genome of a dog adenocarcinoma (T11). The identified CNAs (3396 gains and 5711 losses) amount to 551 Mb (22% of the dog genome) (Table 1). Each line represents a dog chromosome with its chromosome number indicated on the right. Vertical lines shown above/below the chromosomes represent gains/losses, respectively, with their length calculated based on  , where l and m are the total probe number and the mean log2 ratio of the CNA. Except for CNAs that are larger than 1 Mb in size, the width of the vertical lines is not drawn to scale with the chromosome length. (B) Mapping dog CNAs onto the human genome. A total of 9107 CNAs and 541.6 Mb (98.2% of the total) of the same dog tumor shown above were mapped onto the human genome, amounting to 609 Mb on the human genome.
The amount of CNAs directly correlated with the tumor's progression stage, origin, and MSI status
As shown in Table 1, the total amount of CNAs identified varied significantly among the 10 tumor genomes; as a result, the amplified/deleted regions ranged between 5% and 22% of the genome. Reminiscent of human CRCs, we found that this variation correlated well with the progression stage, the origin, and likely the MSI status of the tumors. First, tumors with fewer CNAs are at early stages (∼146–285 Mb for adenomas), whereas tumors with a greater number of CNAs are at late stages (∼350–550 Mb for adenocarcinomas) (Table 1). Second, our study revealed that, for tumors of similar stages, those with an epithelial origin harbor more CNAs than those arising from smooth muscle cells (138 Mb) and mast cells (197 Mb). Finally, our analyses indicate that the presence of MSI is associated with fewer CNAs. As shown in Figure 4, one of the eight microsatellite loci was found altered in an adenoma, which therefore should be classified as MSI-low. Even though this adenoma is more advanced than the other two adenomas (which are MSI-none) based on the histopathological properties, it has the fewest CNAs (146 Mb vs. 285 and 253 Mb).
Figure 4.

MSI assay of the dog tumors. A total of eight dog microsatellite loci were analyzed as described in the text, with the top five being homologs of frequently used human MSI markers (Boland et al. 1998) and the bottom three being dinucleotide markers used by McNiel et al. (2007) to determine MSI status in canine mammary gland neoplasia. The extra band that the tumor displayed for the locus CPA5 was indicated by an arrow. T, tumor; N, its matching normal.
The correlation described above was more quantitatively measured with a multiple linear regression model yi = β0 + β1xi1 + β2xi2+ β3xi3 + ɛi, where ɛi is the random error, and yi, xi1, xi2, and xi3 represent the total CNA amount, stage, cellular origin, and MSI status of the ith tumor (i = 1, 2, 3…, 10), respectively, with their values indicated in Supplemental Table s1. We found that the tumor T3 (Table 1) is an outlier in this analysis; if excluding T3, the observed data in Supplemental Table s1 were predicted by  , with a coefficient of determination R2 = 0.99 (the adjusted R2 = 0.98) and P < 0.0001. The analysis also confirmed that the amount of CNAs was indeed significantly related to the tumor stage (P < 0.0001), the cellular origin (P < 0.0001), and the MSI status (P = 0.0001). We understand that we had a small sample size here (only nine tumors). According to Knofczynski (2008), the sample size requirement of multiple linear regressions varies with R2 and, for R2 > 0.9, a good predication with three variables requires at least nine samples. Hence, our analysis satisfied this minimal sample size requirement.
Tumor clustering
We also performed clustering analyses using pairwise overlapping CNAs. Both the minimum spanning tree (MST) (Kruskal 1956; Prim 1957; Cormen et al. 2001) and top-down clustering strategies (Liu et al. 2006) (see Methods), as well as hierarchical clustering (Hastie et al. 2009), yielded the same structures as shown in Figure 5. Reminiscent of human CRCs, the dog tumors of similar subtypes were clustered together. For instance, the late-stage tumors were grouped together, splitting from early-stage tumors in the tree. In addition, tumors with nonepithelial origins or those that are likely to be MSI-low are separate from those that arose from colon epithelial cells and were MSI-none. We found that grouping of subtypes in the cluster was mostly caused by the differences in the total CNA size among the subtypes (Supplemental Fig. s1), consistent with the multiple linear regression results described above. However, within the same subtype of adenocarcinomas, tumors clustered based on not only the total CNA size, but also the CNA pattern (Supplemental Fig. s1).
Figure 5.

(A) Clustering of the dog tumors. The tree was constructed by MST or top-down clustering as described in the text (both strategies yielded the same tree), with the sample information for each tumor shown on the right. The number for each branch represents the distance d(X, Y) between the two clusters X and Y involved, calculated by  , where dij is the distance between a tumor Ti of cluster X and a tumor Tj of cluster Y calculated as described in the text, and |X| and |Y| are the total number of tumors inside clusters X and Y, respectively. (B) Clustering of tumors from both humans and dogs. The tree was constructed as described above, using the overlapping information of CNAs either identified on (for the human tumors T2551 and T3912) or mapped onto (for the dog tumors, see Fig. 3) the human genome. MSI-L: MSI-low; MSI-H: MSI-high.
Genes and pathways disrupted in the dog colorectal tumors
Mapping of dog CNAs onto the human genome
The human genome is better annotated than the dog genome. Consequently, to more accurately determine which genes are affected by the CNAs identified above, we mapped the dog CNAs onto the orthologous sites of the human genome. This was done by converting the dog genomic sequence coordinate of each CNA to the corresponding human coordinate, using a high-resolution human–dog genomic synteny map anchored by bacterial artificial chromosome (BAC) clones that we previously built (Zhao et al. 2004; Ji and Zhao 2008). Depending on the tumors, between 97.3% and 98.2% of the CNAs were successfully placed onto the human genome (Table 1; for one example, see Fig. 3). The remaining unmapped CNAs were either found to fall in the rearrangement breakpoint regions (74%–88%) or were within or near the telomeric regions where the dog–human synteny is not yet resolved (12%–26%; see Supplemental Table s2 for more information). This precluded their accurate localization on the human genome. Importantly, the unmapped CNAs do not encode genes, and thus they will not affect the analysis results described below.
Known human CRC pathways were likely to be disrupted recurrently in dog tumors
Using the mapping information described above, we found about 2000-4000 genes for early-stage/nonepithelial/probable MSI-low tumors and 5000–7500 genes for the late stage epithelial tumors (or adenocarcinomas) (Table 1). For 73%–86% of these genes, we were able to annotate their functions and classify them using the Gene Ontology (GO) system at the biological process level. This analysis assigned signal transduction, transcription, cell differentiation, cell death or proliferation, and/or other biological functions to these genes (see Supplemental Fig s2).
Importantly, we asked if any of these genes participate in pathways known to be involved in human CRC development and progression (Kinzler and Vogelstein 1996; Gallahan and Callahan 1997; Rajagopalan et al. 2003; Grady 2004; Sancho et al. 2004; Kaiser et al. 2007). These included well-characterized signaling pathways of Wnt, TGF-beta, TP53, and MAPK, as well as pathways controlling cell growth and apoptosis, and cell cycle (see http://www.genome.jp/kegg/pathway/hsa/hsa05210.html). Among the 647 total genes included in these pathways, we found that significantly more genes were disrupted in the dog tumors than predicted by the random model (P = 0.0004), which assumed that overlaps between disrupted genes and the pathway members were totally random (Table 2A). Table 2B lists those genes that were recurrently disrupted among the dog tumors, identified following a strategy described by Beroukhim et al. (2007) (see Methods). These results indicate that the human CRC pathways were also likely to be disrupted in dog CRCs, demonstrating the genetic and molecular similarities of CRCs between these two species.
Table 2A.
Observed and predicted numbers of disrupted genes that participate in known human CRC pathways

The one-tail t-test indicates that observed gene numbers are significantly more than predicted values (P = 0.0004).
aT1–T11 are dog tumors (see Table 1 for more detailed description), whereas T2551 is a human MSI-none adenocarcinoma, and T3912 is a human MSI-high adenocarcinoma.
bThe predicted gene numbers were calculated by assuming that overlap between disrupted genes of each tumor and the human CRC pathway gene members (647 total) is completely random.
Table 2B.
Recurrently disrupted dog homologs of genes participating in known human CRC pathways

aShown here are significantly disrupted genes with the desired FDR setting to 0.2 (the cutoff P-value was 0.013), following a strategy for recurrent event identification described by Beroukhim et al. (2007) (see Supplemental materials).
Comparing dog CNAs to human CNAs
Human and dog tumors of similar subtypes were clustered together
Using Roche NimbleGen's 2.1-million human oligo arrays, we performed aCGH analyses on a human adenocarcinoma (a Dukes B tumor) that is MSI-none, as well as another adenocarcinoma (also a Dukes B tumor) that is MSI-high (at least two MSI loci disrupted). Consistent with the literature reports, we found significantly more CNAs in the MSI-none tumor than the MSI-high tumor (312 vs. 20.5 Mb). In addition, for the MSI-none tumor, we identified amplifications in the 5p, 8q, 13q, and 20q regions, as well as deletions in the 8p, 11q, 14q, 15q, 17p, 18q, and 21q regions. Those are consistent with previous aCGH studies (e.g., Douglas et al. 2004; Nakao et al. 2004; Camps et al. 2006). Like the dog analyses described before, these results also demonstrate the accuracy of our aCGH analyses.
Importantly, we found that ∼12%–33% of CNAs of the human MSI-none tumor colocalized with the dog CNAs on the human genome, which are significantly higher than those predicted (3%–8%) by assuming that the human tumors and the dog tumors are completely unrelated and their CNA overlap is totally random (P < 10−4; see Supplemental Table s3). This close relationship was also demonstrated by the clustering analyses. As shown in Figure 5B, the human MSI-none adenocarcinoma was near the canine MSI-none adenocarcinomas, whereas the human MSI-high tumor was near the canine MSI-low tumor (although this grouping was mostly caused by the difference in the total CNA size, similar to the dog tumors described previously). Thus, the tumors were clustered according to the tumor subtype, but not according to the species (Fig. 5B). These results provide another piece of evidence demonstrating the molecular and genetic similarity between human and canine CRCs.
Human-specific CNAs locate in evolutionarily more unstable regions compared with the shared CNAs
To better differentiate the CNAs shared between the two species from species-specific CNAs, we investigated the evolutionary genomic instability of these regions by determining the amount of ISGRBPs (mouse, rat, and dog genomic rearrangement breakpoints on the human genome) and SDs in them. We found that the shared CNAs contain two to three times fewer ISGRBPs and up to three times fewer SDs compared with the human-specific CNVs (Supplemental Table s4). To ensure that this enrichment was not caused by mapping failures, we mapped the human CNAs onto the dog genome using the same synteny file described previously. We found that human-specific CNAs were mapped with the same efficiency as the total CNAs (Supplemental Table s5), indicating that the enrichment was unlikely an artifact caused by mapping issues.
To further expand this analysis by including more human tumors, we searched literature and databases for findings reported by other groups. We found that such studies were mostly performed with BAC arrays (e.g., Camps et al. 2008), but not with high-density oligo arrays such as we applied here. We thus focused on the BAC data and extracted the CNA information from 53 human CRC tissue samples reported in the NCBI's SKY/M-FISH and CGH database (Knutsen et al. 2005), selecting those CNAs that were recurrent among ≥11 tumors (≥20% of the total sample size). Unfortunately, the human CNAs were reported in chromosomal cytogenetic bands only. Consequently, we converted the corresponding human sequence coordinates of the dog CNAs that had been successfully mapped onto the human genome (see above) into the smallest possible cytogenetic bands. Then, we identified those cytogenetic bands where ≥20% of their genomic sequences were amplified or deleted in at least two dog tumors (≥20% of the total sample size) to compare with the selected human CNAs.
As summarized in Table 3, we found that ∼64% of the human CNAs and 56% of the dog CNAs colocalize in the genome. These included well-known aberration sites in human CRCs, such as those in 7p, 7q, 17p, 17q, and 18q. In addition, we found that the ISGRBP density was 3.66 × 10⁻⁷ per base for the shared CNAs, 5.16 × 10⁻⁷ per base for the human-specific CNVs, and 4.58 × 10⁻⁷ per base for the dog-specific CNVs. Similarly, the shared CNVs were found to harbor fewer SDs (2%) compared with those that are human-specific (5.4%) or dog-specific (2.9%). Thus, consistent with the results of the oligo arrays described above, species-specific CNAs locate in evolutionarily more unstable regions compared with shared CNAs.
Table 3.
Comparison of CNAs between human and dog CRCs

Discussion
Animal cancer models (rodents, zebrafishes, dogs, cats, and others) have been used extensively in human cancer research (e.g., Moser et al. 1993; Vail and MacEwen 2000; Rosol et al. 2003; Hansen and Khanna 2004; Hinoi et al. 2007; Maser et al. 2007). Sporadic canine cancers should make excellent models for studying the corresponding human cancers for a number of reasons. First, they are naturally occurring and heterogeneous, unlike most genetically modified or xenograft rodent cancer models. Second, there are numerous anatomic and clinical similarities between humans and dogs with the same type of cancer (Vail and MacEwen 2000; Michell 2004; Argyle 2005, 2009; Khanna et al. 2006; Paoloni and Khanna 2007, 2008; LeRoy and Northrup 2009). Third, the dog genome has been sequenced, and an accurate version of the dog genomic sequence assemblies is available (Lindblad-Toh et al. 2005), facilitating many experimental and bioinformatics analyses. For these reasons, we have focused on using sporadic dog CRCs to develop a novel cross-species comparative genomics and oncology strategy to identify causative CRC alteration candidates (Fig. 1).
Consistent with the reported anatomic and clinical similarities, our initial characterization of genomic instability in 10 spontaneously occurring dog tumors revealed for the first time the genetic and molecular similarities between sporadic human and dog CRCs. All 10 canine tumors investigated exhibited CIN, with the extent of CIN correlating with the tumor's progression stage, origin, and likely MSI status reminiscent of human CRCs. However, the MSI phenotype was found in only one canine tumor. This is consistent with human sporadic CRCs, where the majority (87%) display CIN and the minority (13%) display MSI. In addition, our analyses indicate the corresponding human CRC pathways may also be altered in the dog cancers and that tumors from the two species were clustered according to the tumor subtypes, but not according to the species. These observations indicate that human and dog CRCs might share similar molecular and genetic pathways of cancer development and progression. This possibility is further supported by ongoing analyses that focus on investigating the expression alteration of bona fide CRC genes, such as APC, SMAD4, and TP53 in the dog tumors (their expression indeed altered by quantitative reverse transcription PCR analyses, P-values ranged from 0.001 to <0.1). Of course, more studies are needed. For instance, for the dog MSI study, the eight dog microsatellite loci (Fig. 4), of which five are homologs of standard human MSI markers (Boland et al. 1998) and three are dinucleotide markers used to characterize MSI in canine mammary gland neoplasia (McNiel et al. 2007), have not been extensively tested. Importantly, we do not know whether disruption of the dog locus shown in Figure 4, which belongs to one of three dinucleotide markers, is due to defective MMR or not. Hence, it would be revealing to examine the MMR system in the probable MSI+ dog tumor. It would also be informative to conduct expression microarray analyses to identify additional genes and pathways that are altered in dog CRCs, similar to those performed with mouse tumors by Kaiser et al. (2007). Of course, more dog tumors merit investigation.
We discovered that the species-specific CNAs localize to genomic regions that are evolutionarily more unstable (having more ISGRBPs and SDs) compared with the CNAs shared between the two species. For instance, although the human genomic region 8p23.1 (6.2–12.7 Mb) was found to be frequently disrupted in human CRCs (e.g., Camps et al. 2008), we did not find any changes in the corresponding region in the 10 dog tumors investigated (Table 3). Various studies have reported that 8p23.1 belongs to an evolutionarily hypervariable region, enriched with SDs and inversions that are specific to apes. For example, we recently identified nine complete/truncated copies of a 300-kb LTR-retrotransposon-like element clustered in this region; these copies have likely facilitated inversions observed among different primate species (Ji and Zhao 2008) and even among different normal human individuals (Deng et al. 2008). Interestingly, a recent sequencing effort reported that, in the genome of the breast cancer cell line MCF7, dispersed rearrangement breakpoint regions are significantly enriched with SDs (5.2×), whereas clustered breakpoint regions are not (Hampton et al. 2009). It would be interesting to know if clustered breakpoint regions harbor more cancer-driver alterations than dispersed rearrangement breakpoint regions.
Our finding raises the possibility that the human-specific CNAs may be a consequence of cancer development and progression, rather than a cause. This is because these genomic regions are intrinsically more unstable and are thus more prone to changes when the genome becomes increasingly more unstable as cancer progresses, compared with other genomic sites. Thus, these human-specific CNAs may be less significant than the shared CNAs in CRC etiology, especially if both species are clearly shown to follow similar molecular and genetic pathways of cancer development and progression. Certainly more dog CRCs should be investigated if we are to more accurately define the shared- and species-specific CNA sets. Although much more work still needs to be done, this study demonstrated the promise of using sporadic dog CRCs to identify bona fide CRC gene and other genomic abnormality candidates. However, to effectively achieve this goal, we must emphasize that significantly more dog and human tumors should be compared and the identified driver alteration candidates should be verified with further experimental studies such as those described by Yang et al. (2008).
Methods
Canine colorectal tissue samples
Frozen samples of canine colorectal tumors and normal colon tissues were obtained from the Veterinary Teaching Hospital of the University of Georgia College of Veterinary Medicine, the William R. Pritchard Veterinary Medical Teaching Hospital of the University of California-Davis School of Veterinary Medicine, as well as the Animal Cancer Tissue Repository at the Colorado State Universality. Tissue samples were obtained during surgery. After washing in phosphate-buffered saline, they were snap-frozen in liquid nitrogen for 10 min and then stored at −80°C until further analyses.
Tissue sample cryomicrodissection and DNA extraction
With a cryostat, we first cut a tissue sample into two or three pieces, depending upon its size; then from the fresh-cut side of the largest piece, we sectioned typically three 10-μm slices, which were stained with hematoxylin and eosin Y (Fig. 2). Based on the staining results, we used a surgical knife to dissect the sections from the tissues that are enriched with tumor cells to minimize normal cell contamination or normal colon epithelial cells to minimize other types of cells, such as cells of muscle, fat, and connective tissues. Finally, genomic DNA was extracted from the dissected tissues using a Qiagen Tissue DNeasy purification kit.
MSI assay
MSI analysis was performed with five dog microsatellite markers that share high sequence homology with corresponding human microsatellite markers used to test MSI in human CRCs (Boland et al. 1998): mononucleotides dBAT25 and dBAT26, and dinucleotides dD8S87, dD17S787, and dD20S100. Further, we included three additional dinucleotide markers (CPH14, CPH5, and AHTK209), based on a previous study of canine mammary gland neoplasia (McNiel et al. 2007). The primers used to amplify these markers were listed in Supplemental Table s6.
PCR reactions were carried out in a 10-μL reaction volume containing 25 ng of genomic DNA, 25 μM primers, and 5 μL of 2× iQ supermix (Bio-Rad). The reactions were performed under the following conditions: 95°C for 5 min, 30 cycles of 94°C for 30 sec, 55°C for 30 sec, and 72°C for 30 sec, and a final extension at 72°C for 10 min. The PCR products were resolved on a 10% polyacrylamide denaturing gel containing 5.7 M urea and visualized by silver staining using a Silver Staining Plus kit from Bio-Rad.
Human DNA samples purified from paired normal/tumor tissues and associated pathology information were provided by Dr. Timothy J. Yeatman from the H. Lee Moffitt Cancer Center and Research Institute in Florida. The MSI assay was performed with standard microsatellite loci described by Boland et al. (1998) following the procedure described above.
Dog array comparative genomic hybridization (aCGH)
The aCGH hybridization, as well as data collection and initial analysis, were conducted at Dr. Michael E. Zwick's laboratory at Emory University, following the standard protocol contained within the CGH “NimbleChip Arrays User's Guide.” A detailed description of the protocol is provided in the Supplemental materials. Test and reference samples were hybridized to standard 385 K canine CGH arrays manufactured by Roche NimbleGen Systems, Inc. Each array was fabricated from a single chip design containing ∼385,000 probes of ∼50-bp-long oligos selected from unique sequences in the canFam2 genome. This design provides an average resolution of one probe every 5–6 kb across the canine genome.
Human aCGH experiments were performed as described above, except that the Roche NimbleGen's human high density arrays were used. Each of these arrays contained ∼2.1 million oligo probes, providing a resolution of one probe every 1 kb across the human genome, on average.
CNAs were identified by analyzing the log2 ratios using a software program called SEG, which we recently developed in order to more effectively decipher high density oligo aCGH data for CNA finding. SEG consists of two major steps: Change-point identification at the chromosomal level and CNA identification at the whole genome level. For change-point finding, SEG first requires a user-input of the minimal probe numbers that a CNA should have (which we set to 5 for oligo aCGH data because we relied on signals from at least five continuous probes, but not individual probes to reduce false-positives). With this input, SEG determines the maximum change points for a chromosome and assigns these initial changes points. Then, SEG shifts these temporarily assigned change points to their correct position by recursively minimizing variations within each segment and removing insignificant change points by merging neighboring segments where the log2-ratio means are not significantly different (we set the significance level to 0.01). Once change points are identified for all chromosomes, SEG uses a false discovery rate (FDR)-controlled procedure (Benjamini and Hochberg 1995) to determine which segments are amplified or deleted at the whole genome level. For this study, we set the desired FDR to 0.05, the cutoff total probe number to 5, and the cutoff log2-ratio mean to 0.25 for CNA identification. The SEG program can be obtained from http://www.bmb.uga.edu/szhao.
Multiple linear regression analysis was performed using the statistic software JMP8 (http://www.jmp.com; SAS Institute). To perform the analysis, we assigned a value of either 0 or 1 to the tumor stage (0 for adenomas and 1 for adenocarcinomas), the cellular origin (0 for nonepithelial origin and 1 for epithelial origin), and the MSI status (0 for MSI+ and 1 for MSI−) of each tumor (see Supplemental Table s1).
qPCR analysis
qPCR reactions were performed in triplicate with each well containing 10 μL of iQ SYBER Green Supermix from Bio-Rad, 500 nM primers each, and 10 ng of genomic DNA in a total reaction volume of 20 μL, with an iCycler iQ Real-Time PCR machine. The amplification condition was: 95°C for 10 sec, 65°C for 45 sec, and 78°C for 20 sec, for a total of 40 cycles. The Ct value (the threshold cycles: the number of cycles at which the earliest measurable fluorescence signal can be detected in the qPCR assay; a higher Ct value means fewer templates) was collected for each reaction. Then, a t-test was conducted to determine if the Ct (normalized based on the total genomic DNA) difference between the tumors and normal samples was significant or not for each gene at a chosen significance level.
Tumor clustering
Tumors were clustered using the CNAs identified above as follows. For any two tumors Ti and Tj of the 10 tumors studied, Ci and Cj represented the total genomic size of CNAs in Ti an Tj, respectively, andCij represented the genomic size of the shared CNAs between Ti and Tj. We defined the similarity between Ti and Tj by
and the distance between Ti and Tj by
Minimum spanning tree (MST) tumor clustering
We constructed a weighted complete graph G of 10 vertices with each vertex representing a tumor and the distance connecting tumors Ti and Tj being dij calculated above. Then, we applied the Kruskal's algorithm (or the Prim's algorithm) to find the MST of G (Kruskal 1956; Prim 1957; Cormen et al. 2001). Last, we constructed the final tree T from the MST by first setting the root of T to represent the cluster harboring all the tumors. Then, starting from this cluster, we recursively divided each cluster into two subclusters using the longest distance between the two tumors within the MST of each cluster until each terminal cluster contained only one tumor.
Top-down clustering
We also clustered the tumors using the top-down clustering algorithm (Steinbach et al. 2000) developed by Liu et al. (2006). First, we performed bisection clustering by initially choosing the two tumors with the lowest similarity as the seeds of two initial clusters and next assigning the remaining tumors to one of these clusters whose seed has a higher similarity to the tumor. Then, we refined these two clusters by recursively moving each tumor from one cluster to another and also exchanging tumors between the clusters. Each movement was evaluated by the two criteria named internal compactness (IC) and internal separation (IS) as defined by
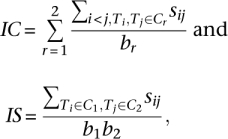 |
where C1, C2 represents the two clusters that, respectively, harbor a total number of b1, b2 tumors. Since both measures were computed with the pairwise similarity among the tumors, higher values of IC and lower values of IS would represent better clustering quality. Consequently, in our current implementation, if IC/IS was larger after the movement, we would keep the new clusters; otherwise, we would discard the movement and keep the original clusters. Similar to how the two initial clusters were established, we recursively applied these bisection clustering and cluster refinement processes to each cluster found in the previous round, until there was only one tumor left in each of the terminal clusters.
Data sources and data integration
The dog aCGH data analyses are based on the canFam version 2.0 and the human genome NCBI build 36.1. Canine CNAs were mapped to the human genome using the BAC clone-based human–dog synteny map that we previously constructed (Zhao et al. 2004; Ji and Zhao 2008). The genes inside the mapped dog CNAs were identified using the KnownGene database downloaded from the University of California Santa Cruz (UCSC) genome site (http://www.genome.ucsc.edu). Through database cross-linking, functions of the identified genes were annotated based on the GOA database, version 1.109 (http://www.ebi.ac.uk/GOA/). The subsequent GO slim and classification analysis at the biological process level was achieved by Blast2Go, version 2.35 (http://www.blast2go.de/). Information on known human CRC-related pathways was obtained from KEGG (Kyoto Encyclopedia of Genes and Genomes) release 50.0 (http://www.genome.jp/kegg). Genes recurrently disrupted in dog tumors (Table 2B) were identified by collectively considering the magnitude of a CNA (the value of the log2 ratios), as well as the percentage of the tumors having this CNA following a procedure described by Beroukhim et al. (2007) (see Supplemental material). Previously published CNAs of human CRCs from BAC aCGH studies were downloaded from the NCBI's SKY/M-FISH and CGH database at http://www.ncbi.nlm.nih.gov/sky. Human and dog SD data, as well as human cytogenetic band and genomic sequence coordinate conversion data, were obtained from the annotation data set at the UCSC genome sites. Dog, mouse, and rat genomic synteny breakpoint data on the human genome were obtained from previous studies (Zhao et al. 2004; Ji and Zhao 2008).
Acknowledgments
We thank Eric Jiang and Xueyang Li for the initial MSI work performed. We thank Carolyn J. Henry of University of Missouri Columbia and Susan E. Lana of Colorado State University for their help in collecting dog samples. The study was funded by the American Cancer Society.
Footnotes
[Supplemental material is available online at http://www.genome.org. The aCGH data have been submitted to the NCBI Gene Expression Omnibus (http://www.ncbi.nlm.nih.gov/geo/) under accession no. GSE19318.]
Article published online before print. Article and publication date are at http://www.genome.org/cgi/doi/10.1101/gr.092726.109.
References
- Aebersold R, Auffray C, Baney E, Barillot E, Brazma A, Brett C, Brunak S, Butte A, Califano A, Celis J, et al. Report on EU-USA workshop: How systems biology can advance cancer research (27 October 2008) Mol Oncol. 2009;3:9–17. doi: 10.1016/j.molonc.2008.11.003. [DOI] [PMC free article] [PubMed] [Google Scholar]
- Albertson DG, Collins C, McCormick F, Gray JW. Chromosome aberrations in solid tumors. Nat Genet. 2003;34:369–376. doi: 10.1038/ng1215. [DOI] [PubMed] [Google Scholar]
- Argyle DJ. The benefits of comparative medicine—a hundred years to come to our senses. Vet J. 2005;170:147–148. doi: 10.1016/j.tvjl.2004.08.003. [DOI] [PubMed] [Google Scholar]
- Argyle DJ. Prostate cancer in dogs and men: A unique opportunity to study the disease. Vet J. 2009;180:137–138. doi: 10.1016/j.tvjl.2008.08.012. [DOI] [PubMed] [Google Scholar]
- Bailey JA, Gu Z, Clark RA, Reinert K, Samonte RV, Schwartz S, Adams MD, Myers EW, Li PW, Eichler EE. Recent segmental duplications in the human genome. Science. 2002;297:1003–1007. doi: 10.1126/science.1072047. [DOI] [PubMed] [Google Scholar]
- Bailey JA, Baertsch R, Kent WJ, Haussler D, Eichler EE. Hotspots of mammalian chromosomal evolution. Genome Biol. 2004;5:R23. doi: 10.1186/gb-2004-5-4-r23. http://genomebiology.com/2004/5/4/R23. [DOI] [PMC free article] [PubMed] [Google Scholar]
- Benjamini Y, Hochberg Y. Controlling the false discovery rate: A practical and powerful approach to multiple-testing. JR Stat Soc. 1995;57:289–300. [Google Scholar]
- Beroukhim R, Getz G, Nghiemphu L, Barretina J, Hsueh T, Linhart D, Vivanco I, Lee JC, Huang JH, Alexander S, et al. Assessing the significance of chromosomal aberrations in cancer: Methodology and application to glioma. Proc Natl Acad Sci. 2007;104:20007–20012. doi: 10.1073/pnas.0710052104. [DOI] [PMC free article] [PubMed] [Google Scholar]
- Boland CR, Thibodeau SN, Hamilton SR, Sidransky D, Eshleman JR, Burt RW, Meltzer SJ, Rodriguez-Bigas MA, Fodde R, Ranzani GN, et al. A National Cancer Institute Workshop on Microsatellite Instability for cancer detection and familial predisposition: Development of international criteria for the determination of microsatellite instability in colorectal cancer. Cancer Res. 1998;58:5248–5257. [PubMed] [Google Scholar]
- Camps J, Armengol G, del Rey J, Lozano JJ, Vauhkonen H, Prat E, Egozcue J, Sumoy L, Knuutila S, Miró R. Genome-wide differences between microsatellite stable and unstable colorectal tumors. Carcinogenesis. 2006;27:419–428. doi: 10.1093/carcin/bgi244. [DOI] [PubMed] [Google Scholar]
- Camps J, Grade M, Nguyen QT, Hörmann P, Becker S, Hummon AB, Rodriguez V, Chandrasekharappa S, Chen Y, Difilippantonio MJ, et al. Chromosomal breakpoints in primary colon cancer cluster at sites of structural variants in the genome. Cancer Res. 2008;68:1284–1295. doi: 10.1158/0008-5472.CAN-07-2864. [DOI] [PMC free article] [PubMed] [Google Scholar]
- Cormen TH, Leiserson CE, Rivest RL, Stein C. Introduction to algorithms. 2nd ed. The MIT Press; Cambridge and McGraw-Hill, New York: 2001. [Google Scholar]
- Deng L, Zhang Y, Kang J, Liu T, Zhao H, Gao Y, Li C, Pan H, Tang X, Wang D, et al. An unusual haplotype structure on human chromosome 8p23 derived from the inversion polymorphism. Hum Mutat. 2008;29:1209–1216. doi: 10.1002/humu.20775. [DOI] [PubMed] [Google Scholar]
- Douglas EJ, Fiegler H, Rowan A, Halford S, Bicknell DC, Bodmer W, Tomlinson IP, Carter NP. Array comparative genomic hybridization analysis of colorectal cancer cell lines and primary carcinomas. Cancer Res. 2004;64:4817–4825. doi: 10.1158/0008-5472.CAN-04-0328. [DOI] [PubMed] [Google Scholar]
- Gallahan D, Callahan R. The mouse mammary tumor associated gene INT3 is a unique member of the NOTCH gene family (NOTCH4) Oncogene. 1997;14:1883–1890. doi: 10.1038/sj.onc.1201035. [DOI] [PubMed] [Google Scholar]
- Grady WM. Genomic instability and colon cancer. Cancer Metastasis Rev. 2004;23:11–27. doi: 10.1023/a:1025861527711. [DOI] [PubMed] [Google Scholar]
- Greenman C, Stephens P, Smith R, Dalgliesh GL, Hunter C, Bignell G, Davies H, Teague J, Butler A, Stevens C, et al. Patterns of somatic mutation in human cancer genomes. Nature. 2007;446:153–158. doi: 10.1038/nature05610. [DOI] [PMC free article] [PubMed] [Google Scholar]
- Hampton OA, Den Hollander P, Miller CA, Delgado DA, Li J, Coarfa C, Harris RA, Richards S, Scherer SE, Muzny DM, Gibbs RA, et al. A sequence-level map of chromosomal breakpoints in the MCF-7 breast cancer cell line yields insights into the evolution of a cancer genome. 2009;19:167–177. doi: 10.1101/gr.080259.108. [DOI] [PMC free article] [PubMed] [Google Scholar]
- Hanahan D, Weinberg RA. The hallmarks of cancer. Cell. 2000;100:57–70. doi: 10.1016/s0092-8674(00)81683-9. [DOI] [PubMed] [Google Scholar]
- Hansen K, Khanna C. Spontaneous and genetically engineered animal models: Use in preclinical cancer drug development. Eur J Cancer. 2004;40:858–880. doi: 10.1016/j.ejca.2003.11.031. [DOI] [PubMed] [Google Scholar]
- Hastie T, Tibshirani R, Friedman J. The elements of statistical learning. 2nd ed. Springer; New York: 2009. Hierarchical clustering; pp. 520–528. [Google Scholar]
- Haverty PM, Fridlyand J, Li L, Getz G, Beroukhim R, Lohr S, Wu TD, Cavet G, Zhang Z, Chant J. High-resolution genomic and expression analyses of copy number alterations in breast tumors. Genes Chromosomes Cancer. 2008;47:530–542. doi: 10.1002/gcc.20558. [DOI] [PubMed] [Google Scholar]
- Hinoi T, Akyol A, Theisen BK, Ferguson DO, Greenson JK, Williams BO, Cho KR, Fearon ER. Mouse model of colonic adenoma-carcinoma progression based on somatic Apc inactivation. Cancer Res. 2007;67:9721–9730. doi: 10.1158/0008-5472.CAN-07-2735. [DOI] [PubMed] [Google Scholar]
- Ji X, Zhao S. DA and Xiao—two composite and giant LTR-retrotransposon like structures identified on the human genome. Genomics. 2008;91:249–258. doi: 10.1016/j.ygeno.2007.10.014. [DOI] [PMC free article] [PubMed] [Google Scholar]
- Jones S, Zhang X, Parsons DW, Lin JC, Leary RJ, Angenendt P, Mankoo P, Carter H, Kamiyama H, Jimeno A, et al. Core signaling pathways in human pancreatic cancers revealed by global genomic analyses. Science. 2008;321:1801–1806. doi: 10.1126/science.1164368. [DOI] [PMC free article] [PubMed] [Google Scholar]
- Kaiser S, Park YK, Franklin JL, Halberg RB, Yu M, Jessen WJ, Freudenberg J, Chen X, Haigis K, Jegga AG, et al. Transcriptional recapitulation and subversion of embryonic colon development by mouse colon tumor models and human colon cancer. Genome Biol. 2007;8:R131. doi: 10.1186/gb-2007-8-7-r131. [DOI] [PMC free article] [PubMed] [Google Scholar]
- Khanna C, Lindblad-Toh K, Vail D, London C, Bergman P, Barber L, Breen M, Kitchell B, McNeil E, Modiano JF, et al. The dog as a cancer model. Nat Biotechnol. 2006;24:1065–1066. doi: 10.1038/nbt0906-1065b. [DOI] [PubMed] [Google Scholar]
- Kidd JM, Cooper GM, Donahue WF, Hayden HS, Sampas N, Graves T, Hansen N, Teague B, Alkan C, Antonacci F, et al. Mapping and sequencing of structural variation from eight human genomes. Nature. 2008;453:56–64. doi: 10.1038/nature06862. [DOI] [PMC free article] [PubMed] [Google Scholar]
- Kinzler KW, Vogelstein B. Lessons from hereditary colorectal cancer. Cell. 1996;87:159–170. doi: 10.1016/s0092-8674(00)81333-1. [DOI] [PubMed] [Google Scholar]
- Knofczynski GT. Sample sizes when using multiple linear regression for prediction. Educ Psychol Meas. 2008;68:431–442. [Google Scholar]
- Knutsen T, Gobu V, Knaus R, Padilla-Nash H, Augustus M, Strausberg RL, Kirsch IR, Sirotkin K, Ried T. The interactive online SKY/M-FISH & CGH database and the Entrez cancer chromosomes search database: Linkage of chromosomal aberrations with the genome sequence. Genes Chromosomes Cancer. 2005;44:52–64. doi: 10.1002/gcc.20224. [DOI] [PMC free article] [PubMed] [Google Scholar]
- Kruskal JB. On the shortest spanning subtree of a graph and the traveling salesman problem. Proc Am Math Soc. 1956;7:48–50. [Google Scholar]
- Lengauer C, Kinzler KW, Vogelstein B. Genetic instability in colorectal cancers. Nature. 1997;386:623–627. doi: 10.1038/386623a0. [DOI] [PubMed] [Google Scholar]
- Leroy BE, Northrup N. Prostate cancer in dogs: Comparative and clinical aspects. Vet J. 2009;180:149–162. doi: 10.1016/j.tvjl.2008.07.012. [DOI] [PubMed] [Google Scholar]
- Lindblad-Toh K, Wade CM, Mikkelsen TS, Karlsson EK, Jaffe DB, Kamal M, Clamp M, Chang JL, Kulbokas EJ, III, Zody MC, et al. Genome sequence, comparative analysis and haplotype structure of the domestic dog. Nature. 2005;438:803–819. doi: 10.1038/nature04338. [DOI] [PubMed] [Google Scholar]
- Liu J, Mohammed J, Carter J, Ranka S, Kahveci T, Baudis M. Distance-based clustering of CGH data. Bioinformatics. 2006;22:1971–1978. doi: 10.1093/bioinformatics/btl185. [DOI] [PubMed] [Google Scholar]
- Maser RS, Choudhury B, Campbell PJ, Feng B, Wong KK, Protopopov A, O'Neil J, Gutierrez A, Ivanova E, Perna I, et al. Chromosomally unstable mouse tumours have genomic alterations similar to diverse human cancers. Nature. 2007;447:966–971. doi: 10.1038/nature05886. [DOI] [PMC free article] [PubMed] [Google Scholar]
- McNiel EA, Griffin KL, Mellett AM, Madrill NJ, Mickelson JR. Microsatellite instability in canine mammary gland tumors. J Vet Intern Med. 2007;21:1034–1040. doi: 10.1892/0891-6640(2007)21[1034:miicmg]2.0.co;2. [DOI] [PubMed] [Google Scholar]
- Michell AR. Comparative clinical science: The medicine of the future. Vet J. 2004;170:153–162. doi: 10.1016/j.tvjl.2004.06.004. [DOI] [PubMed] [Google Scholar]
- Moser AR, Mattes EM, Dove WF, Lindstrom MJ, Haag JD, Gould MN. ApcMin, a mutation in the murine Apc gene, predisposes to mammary carcinomas and focal alveolar hyperplasias. Proc Natl Acad Sci. 1993;90:8977–8981. doi: 10.1073/pnas.90.19.8977. [DOI] [PMC free article] [PubMed] [Google Scholar]
- Nakao K, Mehta KR, Fridlyand J, Moore DH, Jain AN, Lafuente A, Wiencke JW, Terdiman JP, Waldman FM. High-resolution analysis of DNA copy number alterations in colorectal cancer by array-based comparative genomic hybridization. Carcinogenesis. 2004;25:1345–1357. doi: 10.1093/carcin/bgh134. [DOI] [PubMed] [Google Scholar]
- Paoloni MC, Khanna C. Comparative oncology today. Vet Clin North Am Small Anim Pract. 2007;37:1023–1032. doi: 10.1016/j.cvsm.2007.08.003. [DOI] [PMC free article] [PubMed] [Google Scholar]
- Paoloni M, Khanna C. Translation of new cancer treatments from pet dogs to humans. Nat Rev Cancer. 2008;8:147–156. doi: 10.1038/nrc2273. [DOI] [PubMed] [Google Scholar]
- Pevzner P, Tesler G. Human and mouse genomic sequences reveal extensive breakpoint reuse in mammalian evolution. Proc Natl Acad Sci. 2003;100:7672–7677. doi: 10.1073/pnas.1330369100. [DOI] [PMC free article] [PubMed] [Google Scholar]
- Prim RC. Shortest connection networks and some generalisations. Bell Syst Tech J. 1957;36:1389–1401. [Google Scholar]
- Rajagopalan H, Nowak MA, Vogelstein B, Lengauer C. The significance of unstable chromosomes in colorectal cancer. Nat Rev Cancer. 2003;3:695–701. doi: 10.1038/nrc1165. [DOI] [PubMed] [Google Scholar]
- Rosol TJ, Tannehill-Gregg SH, LeRoy BE, Mandl S, Contag CH. Animal models of bone metastasis. Cancer. 2003;97(Suppl 3):748–757. doi: 10.1002/cncr.11150. [DOI] [PubMed] [Google Scholar]
- Sancho E, Batlle E, Clevers H. Signaling pathways in intestinal development and cancer. Annu Rev Cell Dev Biol. 2004;20:695–723. doi: 10.1146/annurev.cellbio.20.010403.092805. [DOI] [PubMed] [Google Scholar]
- Steinbach M, Karypis G, Kumar V. Proceedings of KDD Workshop on Text Mining. ACM Press; New York: 2000. A comparison of document clustering techniques; pp. 109–110. [Google Scholar]
- Turner DJ, Miretti M, Rajan D, Fiegler H, Carter NP, Blayney ML, Beck S, Hurles ME. Germline rates of de novo meiotic deletions and duplications causing several genomic disorders. Nat Genet. 2007;40:90–95. doi: 10.1038/ng.2007.40. [DOI] [PMC free article] [PubMed] [Google Scholar]
- Toft NJ, Arends MJ. DNA mismatch repair and colorectal cancer. J Pathol. 1998;185:123–129. doi: 10.1002/(SICI)1096-9896(199806)185:2<123::AID-PATH62>3.0.CO;2-P. [DOI] [PubMed] [Google Scholar]
- Vail DM, MacEwen EG. Spontaneously occurring tumors of companion animals as models for human cancer. Cancer Invest. 2000;18:781–792. doi: 10.3109/07357900009012210. [DOI] [PubMed] [Google Scholar]
- Yang L, Hamilton SR, Sood A, Kuwai T, Ellis L, Sanguino A, Lopez-Berestein G, Boyd DD. The previously undescribed ZKSCAN3 (ZNF306) is a novel “driver” of colorectal cancer progression. Cancer Res. 2008;68:4321–4330. doi: 10.1158/0008-5472.CAN-08-0407. [DOI] [PubMed] [Google Scholar]
- Zhao S, Shetty J, Hou L, Delcher A, Zhu B, Osoegawa K, de Jong P, Nierman WC, Strausberg RL, Fraser CM. Human, mouse and rat genome large scale rearrangements: Stability versus speciation. Genome Res. 2004;14:1851–1860. doi: 10.1101/gr.2663304. [DOI] [PMC free article] [PubMed] [Google Scholar]