Abstract
Biological networks are highly complex systems, consisting largely of enzymes that act as molecular switches to activate/inhibit downstream targets via post-translational modification. Computational techniques have been developed to perform signaling network inference using some high-throughput data sources, such as those generated from transcriptional and proteomic studies, but comparable methods have not been developed to use high-content morphological data, which are emerging principally from large-scale RNAi screens, to these ends. Here, we describe a systematic computational framework based on a classification model for identifying genetic interactions using high-dimensional single-cell morphological data from genetic screens, apply it to RhoGAP/GTPase regulation in Drosophila, and evaluate its efficacy. Augmented by knowledge of the basic structure of RhoGAP/GTPase signaling, namely, that GAPs act directly upstream of GTPases, we apply our framework for identifying genetic interactions to predict signaling relationships between these proteins. We find that our method makes mediocre predictions using only RhoGAP single-knockdown morphological data, yet achieves vastly improved accuracy by including original data from a double-knockdown RhoGAP genetic screen, which likely reflects the redundant network structure of RhoGAP/GTPase signaling. We consider other possible methods for inference and show that our primary model outperforms the alternatives. This work demonstrates the fundamental fact that high-throughput morphological data can be used in a systematic, successful fashion to identify genetic interactions and, using additional elementary knowledge of network structure, to infer signaling relations.
Biological signaling networks regulate cellular response to environmental cues. These networks are highly complex, consisting largely of enzymes that act as molecular switches to activate/inhibit downstream targets via post-translational modification; these substrates are often themselves enzymes, acting in a similar fashion. Classical biochemical and genetic studies have provided some understanding of the mechanisms of protein interactions involved in signal transduction. Identification of proteins comprising these pathways has been carried out, in part, from forward genetic screens in conjunction with biochemical techniques (Hotta and Benzer 1972; Nusslein-Volhard and Wieschaus 1980). Genes in these screens yielding similar visible mutant phenotypes were identified for further biochemical experimentation and were found to be components of the same pathway (Hiesinger and Hassan 2005). In addition to classical screens, screening techniques based on overexpression, sensitized genetic backgrounds, and mosaic techniques have aided current knowledge of signaling. However, despite the power of classical biochemistry and genetics for interrogating signal transduction, there are few signaling networks for which a detailed, systems-level description is known (Friedman and Perrimon 2007).
Recent advances in genomics and proteomics have transformed the field of signal transduction, as large-scale approaches allow systematic interrogation of the genome using RNAi and mapping of PPIs using mass spectrometry. In turn, computational techniques have been developed to perform network inference using transcriptional and proteomic data arising from these high-throughput screens. The strategy underlying these techniques is to build correlations between perturbations on the basis of transcriptional or proteomic signatures. These methods typically use probabilistic graphical models (Friedman et al. 2000; Pe'er et al. 2001; Sachs et al. 2005; Bakal et al. 2008) or variations on parameterized modeling (Baym et al. 2008). High-throughput data sources, analyzed with appropriate computational methods, have provided new insights into cellular processes beyond classical techniques (Friedman 2004).
In addition to these more traditional high-throughput sources, morphological cellular signatures are emerging as another high-throughput data source that can be exploited to study signaling networks. With the advent of image-based automated technologies and acquisition of high-throughput quantitative imaging data (Ohya et al. 2005; Carpenter et al. 2006), methods have recently been developed that attempt to use these technologies to quantify shape (Bakal et al. 2007), DNA morphology (Moffat et al. 2006), and subcellular localization of organelles or proteins (Perlman et al. 2004; Glory and Murphy 2007) on a single-cell level. Initial analysis was commonly performed by averaging single-cell results to derive mean scores or by clustering such results (Gil et al. 2002; Piano et al. 2002; Neumann et al. 2006; Bakal et al. 2007). Recently, researchers have quantified morphological variability on the single-cell level in response to various stimuli, e.g., genetic or chemical perturbations (Levy and Siegal 2008; Slack et al. 2008). Classification of cells toward particular phenotypes of interest has been successfully accomplished in multiple cases (Boland et al. 1998; Boland and Murphy 2001; Tanaka et al. 2005; Adams et al. 2006; Chen and Murphy 2006; Loo et al. 2007; Wang et al. 2008; Young et al. 2008; Jones et al. 2009). However, no successful method, to our knowledge, has been developed for systematically identifying genetic interactions or predicting signaling relationships using image-based data from high-throughput screens.
Using morphological data for signaling network inference is significantly more challenging than using other high-throughput sources. For one thing, the range of detectable phenotypes with morphological data is less than with other high-throughput data sources: Even though dozens or hundreds of geometric morphological features can be defined and measured on the single-cell level, invariably these features are highly redundant, requiring substantial dimensionality reduction. More challenging still, morphological data provides a highly indirect readout of signaling state, unlike transcriptional or proteomic studies that measure signaling component activity more directly. Yet, morphological data has the potential to provide information that transcriptional data cannot, namely, cellular response to post-translational protein modification.
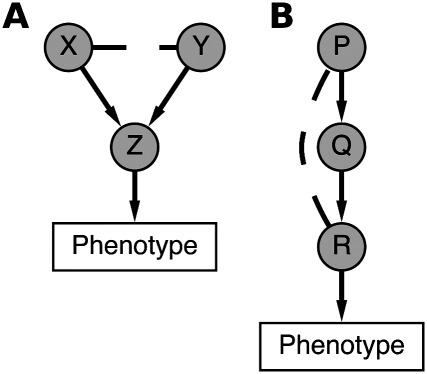
An additional challenge in inferring signaling interactions arises from the fact that signaling networks are highly redundant structures that are robust to inhibition of a single gene. Therefore, phenotypic signatures arising from single-gene knockdowns may not be indicative of gene function. Double-knockdowns, which have been performed in yeast SSL or growth-rate screens to uncover genetic interactions, are a powerful means by which to understand robust network structures (Tong et al. 2001; Han et al. 2004; Wong et al. 2004; Collins et al. 2007; Roguev et al. 2008; Fiedler et al. 2009). It is more subtle to define and determine genetic interactions in the context of high-dimensional morphological data, as compared with measuring growth rate or lethality; but we use the terminology of “within-pathway” and “between-pathway” genetic interactions (Kelley and Ideker 2005) in order to highlight the connection between our work and previous studies in yeast. Here, we consider a between-pathway interaction for two genes, X and Y, to occur when single-knockdown of either X or Y does not result in a mutant phenotype, but the double-knockdown X/Y does (Fig. 1A). For our data, the genes X and Y are RhoGAPs, the mutant phenotype has similarity to overexpression of a particular RhoGTPase (Z), and identification of between-pathway interactions allows for prediction of RhoGAP/GTPase regulatory relations. On the other hand, we consider a within-pathway interaction for genes P and R to occur when the double-knockdown P/R has similarity to single-knockdown of one of the genes but not the other (Fig. 1B). For our data, the genes P and R are RhoGAPs, and identification of within-pathway interactions allows for study of complex RhoGAP signaling. These definitions may be viewed as high-dimensional analogs of the usual definitions involving synthetic lethality.
Figure 1.
Model for between-pathway and within-pathway genetic interactions for high-dimensional morphological data. (A) A between-pathway genetic interaction for genes X and Y is said to occur when single-knockdown of either gene does not result in a mutant phenotype, but the double-knockdown X/Y does. For this study, X and Y are RhoGAPs, the gene Z is a RhoGTPase, and the mutant phenotype is morphological similarity at the single-cell level to overexpression of Z. In this way, identification of between-pathway genetic interactions in our combinatorial knockdown data set corresponds to prediction of RhoGAP/RhoGTPase-signaling interactions (see text). (B) A within-pathway genetic interaction between genes P and R is said to occur when the double-knockdown P/R bears significant morphological similarity to either the single-knockdown for P or R, but not both. In our study, P, Q, and R are RhoGAPs, and identification of within-pathway genetic interactions corresponds to complex hierarchical relations between RhoGAPs.
We describe a computational framework based on a voting scheme at the single-cell level for identifying these types of genetic interactions using high-dimensional morphological data. We demonstrate the efficacy of this approach by inferring components of the Rho-signaling network in Drosophila, namely, RhoGAP/GTPase interactions. This network regulates cell adhesion and motility, and perturbations in human orthologs have been implicated in cancer and other diseases (Tcherkezian and Lamarche-Vane 2007). Rho network structure, with many enzymes and few substrates, is a common network motif (Csete and Doyle 2004; Albert 2005), and our method makes use of the basic structure of GAP/GTPase signaling, namely, that GAPs directly deactivate GTPases. Furthermore, this signaling network exhibits robustness to single RNAi, making it an ideal target for double-knockdown analysis.
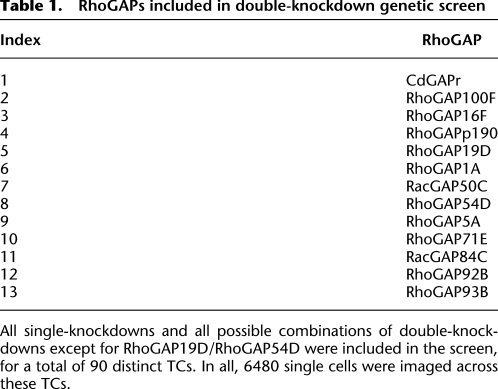
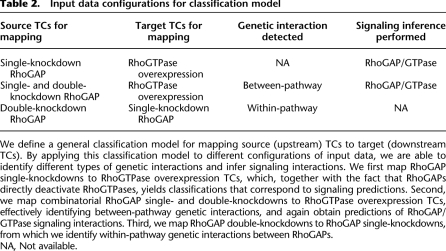
The core of our method is a classification model that maps putative upstream sources (e.g., RhoGAPs) to putative downstream targets (e.g., RhoGTPases) on the basis of morphological similarity on the single-cell level following genetic perturbation (RNAi or gene overexpression). We use a previous image-based screen in the Drosophila BG-2 cell line for RhoGTPase overexpression morphological data (Bakal et al. 2007) and original combinatorial RhoGAP RNAi morphological data (Table 1; Methods). By applying this classification model to different configurations of double-knockdown input data, we are able to identify between-pathway and within-pathway interactions; by applying it to single-RNAi data as well, we are able to compare the performance of our model for network inference using single- versus double-RNAi (Table 2). Thus, we first apply our method to map single-knockdown RhoGAP genetic perturbations (also called treatment conditions, or TCs) to RhoGTPase overexpression TCs, which together with the fact that GAPs directly deactivate GTPases, allow us to predict RhoGAP/GTPase signaling interactions; we find that single-knockdowns produce poor predictions of known interactions. Subsequently, by applying our method to map combinatorial single- and double-RNAi RhoGAP TCs to RhoGTPase overexpression TCs, effectively identifying between-pathway genetic interactions, we thereby obtain greatly improved predictions of RhoGAP/GTPase regulation. As an additional application of our methodology, we produce an alternative classification model that maps double RhoGAP RNAi to single RhoGAP RNAi TCs, thus providing a means for identifying within-pathway genetic interactions for RhoGAPs. Fundamentally, we show for the first time that high-throughput image-based data can be used with success to predict genetic interactions and, with additional elementary knowledge of network structure for RhoGAPs and RhoGTPases, to predict signaling interactions.
Table 1.
RhoGAPs included in double-knockdown genetic screen
All single-knockdowns and all possible combinations of double-knockdowns except for RhoGAP19D/RhoGAP54D were included in the screen, for a total of 90 distinct TCs. In all, 6480 single cells were imaged across these TCs.
Table 2.
Input data configurations for classification model
We define a general classification model for mapping source (upstream) TCs to target (downstream TCs). By applying this classification model to different configurations of input data, we are able to identify different types of genetic interactions and infer signaling interactions. We first map RhoGAP single-knockdowns to RhoGTPase overexpression TCs, which, together with the fact that RhoGAPs directly deactivate RhoGTPases, yields classifications that correspond to signaling predictions. Second, we map combinatorial RhoGAP single- and double-knockdowns to RhoGTPase overexpression TCs, effectively identifying between-pathway genetic interactions, and again obtain predictions of RhoGAP/GTPase signaling interactions. Third, we map RhoGAP double-knockdowns to RhoGAP single-knockdowns, from which we identify within-pathway genetic interactions between RhoGAPs.
NA, Not available.
Results
We first defined a general classification model (Fig. 2) for mapping a set of putative source (upstream) TCs (U) into a set of putative target (downstream) TCs (D). We then applied this model to (i) RhoGAP single-knockdown TCs (U) and RhoGTPase overexpression TCs (D), (ii) RhoGAP single- and double-knockdown TCs (U) and RhoGTPase overexpression TCs (D), and (iii) RhoGAP double-knockdown TCs (U) and RhoGAP single-knockdown TCs (D).
Figure 2.
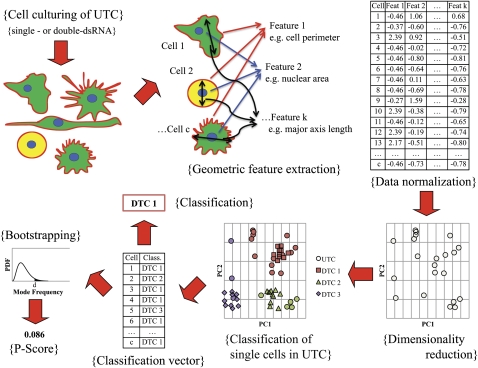
Workflow for classification of upstream TCs (UTC, e.g., RhoGAPs) to downstream TCs (DTC, e.g., RhoGTPases) using high-throughput morphological data. Cell culture was subjected to a variety of genetic perturbations, multiple single-cell images were acquired for each treatment condition, and raw geometric features were extracted for each single cell (upper left, upper middle). Raw data was subjected to normalization (upper right) and dimensionality reduction. The single cells comprising each downstream TC and upstream TC were represented as points in reduced feature space (bottom right, shown for UTC). Each cell of UTC was mapped to a DTC by computing a modified Euclidean distance to each DTC point-cluster and selecting the closest DTC; single-cell results were compiled in the classification vector (bottom middle). The classification for UTC, in turn, was defined to be the mode of the classification vector. Bootstrapping was performed to determine the distribution of the mode frequency, which, in turn, was used to calculate the P-score for the classification of UTC (bottom left).
Classification model for identification of genetic interactions and signaling relationships using morphological data
For the general model, let UTC denote an upstream TC consisting of c single cells. The data for UTC consists of a matrix with c rows and a column for each morphological feature (in reduced-dimensional feature space; see Methods). To map UTC to one of the elements of D, we first classified each single cell in UTC by computing its Mahalanobis distance to each element of D and assigning it to the closest DTC. The classification of all single cells in UTC may thus be represented by a vector of length c, termed the classification vector. The classification of the population, UTC, was defined to be the mode of the classification vector. We assigned a P-value for this classification by calculating the probability of observing a mode frequency no smaller than that observed for UTC, using bootstrapping (Methods).
We required that the classification model should map each DTC to itself with high confidence (intuitively, the DTCs must be distinguishable from one another); this was true for RhoGTPase overexpression TCs (Fig. 3), but not for RhoGAP single-knockdowns as the set of downstream TCs. Therefore, a clustering algorithm was developed and implemented as a preprocessing step for the classification model. Following clustering, the classification model successfully mapped each DTC to the cluster containing it (Methods).
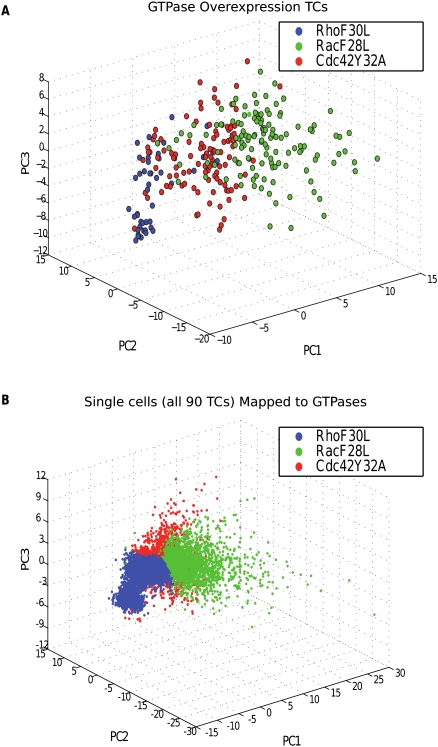
Figure 3.
Point sets for RhoGTPase overexpression TCs and corresponding phase space. Point sets for RhoGTPase overexpression TCs and classification of all single cells in the double-knockdown screen. (A) Point sets for RhoF30L (blue), RacF28L (green), and Cdc42Y32A (red) shown in reduced-dimensional feature space. (B) The mapping of all 6480 single cells from the double-knockdown RhoGAP screen to RhoGTPase overexpression TCs. In effect, the classification model defines a phase space for mapping single cells in the set of upstream TCs to the set of downstream TCs.
Double-knockdowns are essential for successful prediction of RhoGAP/GTPase-signaling relationships
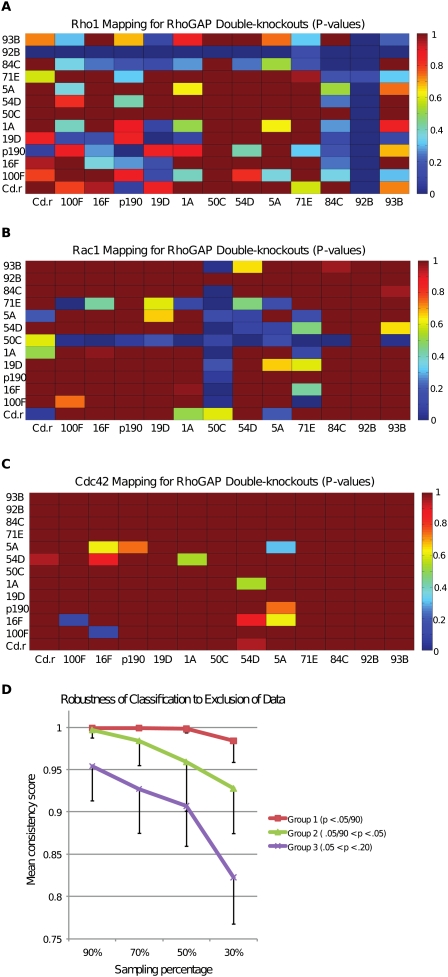
We applied the classification model to map single-knockdown RhoGAP TCs to RhoGTPase overexpression TCs (i) and single- and double-knockdown RhoGAP TCs to RhoGTPase overexpression TCs (ii). For each mapping of a single or double knockdown, we calculated the associated confidence score (Fig. 4A–C). We verified that this classification was robust to noise in input data, particularly for TCs that were classified with high confidence, by jackknife statistics (Fig. 4D). The results of this classification amounted to predictions of RhoGAP/GTPase signaling interactions using the basic fact that GAPs directly deactivate GTPases. The existence of a between-pathway interaction between two RhoGAPs—that is, a high-confidence mapping of a double-knockdown to a RhoGTPase overexpression TC, and the absence of a high-confidence mapping to this RhoGTPase for both the single knockdowns—was viewed as evidence that both RhoGAPs regulate this RhoGTPase (see Methods).
Figure 4.
Mapping of RhoGAP double-knockdown TCs to RhoGTPase overexpression TCs. (A–C) Significance score for mapping of all single- and double-knockdown RhoGAP TCs to the RhoF30L, RacF28L, and Cdc42Y32A TCs, respectively. The color scale ranges from blue (highly significant mapping) to red (low significance). For example, the RacGAP50C/RacGAP84C double-knockdown TC was mapped to RacF28L with high significance (see also Supplemental Table 3). (D) Robustness of classification to exclusion of data using jackknifing. For each single- and double-knockdown TC, 100 random samples consisting of X% (X = 30, 50, 70, 90) of the cells from that TC were selected and classified to the set of overexpression TCs. A consistency score was assigned based on the fraction of random samples correctly classified. Single- and double-knockdowns were binned into groups depending on the P-score of the true classification. Mean and standard deviations of consistency scores are shown here for the three groups defined by largest P-scores (see graph legend). Most importantly, high-confidence classifications are extremely robust to data exclusion (top line in graph). See Supplemental Table 8 for full jackknife results and Methods for discussion of further robustness testing.
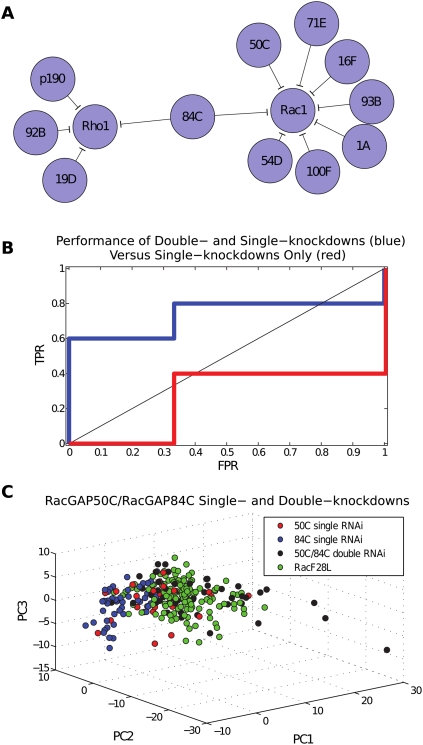
We tested the efficacy of our predictions using biologically validated RhoGAP/GTPase interactions from the genes in our data set (Supplemental Table 1A) (Sotillos and Campuzano 2000; Billuart et al. 2001; Raymond et al. 2001; Lundström et al. 2004; Grumbling et al. 2006; Stark et al. 2006) as well as biologically validated non-interactions (Supplemental Table 1B). Using single-knockdown RhoGAP TCs yielded poor predictions, achieving sensitivity of 2/5 (40%) and specificity of 2/3 (67%) with an optimal significance threshold (Fig. 5B; Supplemental Table 2). We next analyzed the results of mapping the full set of single- and double-knockdown RhoGAP TCs to RhoGTPase overexpression TCs (ii). Using the same validation set, we observed vast improvement: The model correctly predicted four out of five known interactions and two out of three known non-interactions for an overall sensitivity and specificity of 80% and 67%, respectively (Fig. 5A,B; Supplemental Table 3). The method made a total of 12 predictions (out of the 39 possible interactions); the probability of correctly predicting four out of five known interactions, as determined by hypergeometric statistics, is P < 0.025. This highlights the predictive power of our model as well as the importance of using double-knockdown morphological data (Fig. 5C).
Figure 5.
Inference using morphological data from single- versus double-knockdown RhoGAP treatment conditions. (A) Classification of both single- and double-knockdown RhoGAP TCs to RhoGTPase overexpression TCs. All pairs listed here are significant at optimal threshold, as determined by ROC analysis. The model correctly predicts four out of five biologically validated interactions and two out of three non-interactions. Overall, the model made 12 out of 39 possible predictions, yielding a P-score of P < 0.025 for identifying four out of five positive interactions. The model mapped several RhoGAPs to Cdc42, but none with sufficient significance (for complete results, see Supplemental Table 3). Network visualization was performed using Cytoscape (Shannon et al. 2003). (B) ROC curve showing single-knockdown (red) versus double-knockdown (blue) predictive models. For the single-knockdown model, the optimal threshold yields the only model that makes better predictions than random guessing. For the double-knockdown model, given that the set of validated interactions is likely incomplete, we err on the side of producing more false positives, and prefer (0.33, 0.80) to (0, 0.60). (C) RacGAP50C and RacGAP84C single- and double-knockdowns. The plot in PC-based coordinates shows single-cell point sets for RacF28L, RacGAP50C single-knockdown, RacGAP84C single-knockdown, and RacGAP50C/RacGAP84C double-knockdown. The classification model maps the RacGAP50C single-knockdown to RacF28L with low confidence and incorrectly maps the RacGAP84C single-knockdown to Rho1 with high confidence, but correctly maps the RacGAP50C/RacGAP84C double-knockdown to Rac1 with high confidence.
Systematic discovery of within-pathway genetic interactions
We produced an alternative classification model that mapped double RhoGAP RNAi (U) to single RhoGAP RNAi (D) (iii) in order to identify within-pathway genetic interactions between RhoGAPs. As noted above, it was a requirement of the model that each element of D be mapped to itself correctly under the model; however, this was not the case using the entire set of RhoGAP single-RNAi. To remedy this, we clustered the single-RNAi TCs using a variant of EM designed to guarantee that all single-RNAi TCs would be correctly classified to the cluster containing it (Supplemental Table 4; Methods). We then applied the classification model to map double-RNAi RhoGAP TCs to (clusters of) single RhoGAP RNAi TCs (Supplemental Table 5). Using the results of this classification, we identified within-pathway genetic interactions between pairs of RhoGAPs (Table 3). In particular, we identified cases of double-knockdowns A/B, which were mapped with high significance to single-knockdown of A (more precisely, to the cluster containing A), but not to single-knockdown of B. Our methods identified the previously validated interaction between RacGAP50C and RacGAP84C (see Discussion).
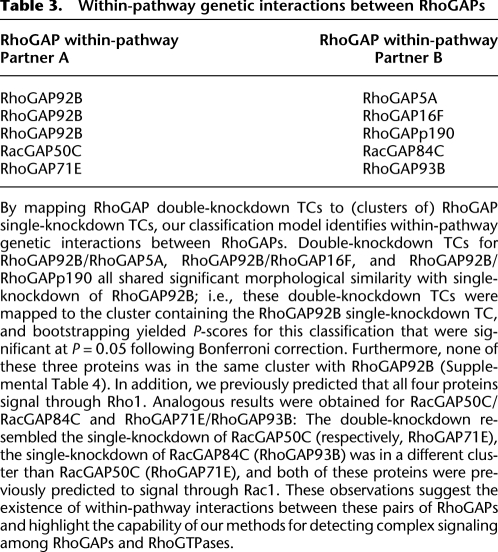
Table 3.
Within-pathway genetic interactions between RhoGAPs
By mapping RhoGAP double-knockdown TCs to (clusters of) RhoGAP single-knockdown TCs, our classification model identifies within-pathway genetic interactions between RhoGAPs. Double-knockdown TCs for RhoGAP92B/RhoGAP5A, RhoGAP92B/RhoGAP16F, and RhoGAP92B/RhoGAPp190 all shared significant morphological similarity with single-knockdown of RhoGAP92B; i.e., these double-knockdown TCs were mapped to the cluster containing the RhoGAP92B single-knockdown TC, and bootstrapping yielded P-scores for this classification that were significant at P = 0.05 following Bonferroni correction. Furthermore, none of these three proteins was in the same cluster with RhoGAP92B (Supplemental Table 4). In addition, we previously predicted that all four proteins signal through Rho1. Analogous results were obtained for RacGAP50C/RacGAP84C and RhoGAP71E/RhoGAP93B: The double-knockdown resembled the single-knockdown of RacGAP50C (respectively, RhoGAP71E), the single-knockdown of RacGAP84C (RhoGAP93B) was in a different cluster than RacGAP50C (RhoGAP71E), and both of these proteins were previously predicted to signal through Rac1. These observations suggest the existence of within-pathway interactions between these pairs of RhoGAPs and highlight the capability of our methods for detecting complex signaling among RhoGAPs and RhoGTPases.
Comparison with alternate methods
This work is the first report of successful signaling inference based on high-throughput morphological data from a genetic screen. Thus, we considered several alternate methods that might be used to perform inference of RhoGAP/GTPase interactions using morphological data, and compared these methods with the main classification model developed here.
Mean scores and clustering-based approaches
We first developed and tested a method that used mean scores for each TC (unlike single cells, as in the primary classification model) as the basis for classification. In particular, we calculated mean scores in PC-coordinates in three dimensions for each TC, and computed distances from each of the double-knockdown TCs to each of the RhoGTPase overexpression TCs. To determine a P-score for each upstream/downstream pair, we selected samples of equal size to the UTC from the entire set of single cells (for all double-knockdown TCs), and computed the distribution of the distance of their mean from the RhoGTPase mean. Applied to the double-knockdown RhoGAP data, the mean-score method made many more predictions than the primary classification model. Indeed, in order for the mean-score method to identify four out of five biologically validated interactions, it made a total of 23 predictions as compared with 12 for the main classification model, yielding a significance score of P = 0.30 (vs. P < 0.025). This highlights a caveat of average morphological data: significant variation at the single-cell level within individual TCs (Levy and Siegal 2008), making it possible that two TCs’ mean scores may resemble each other though their single-cell clusters do not, thus decreasing the predictive power of a mean-score approach. Interestingly, mean-scores correctly classify the three non-interactions, but because of its higher predictive power, the single-cell classification model was preferred (see also Supplemental Results).
Incorporating other classifiers
Neural network classifiers for RacF28L and RhoF30L were previously constructed to classify cells according to similarity with these TCs (Bakal et al. 2007). We used Z-scores for these two classifiers to represent morphology of each single cell, computed mean classifier scores for each double-knockdown TC, and ranked TCs accordingly. Using an extremely strict significance cutoff (Bonferroni-corrected P = 0.05), the RacF28L neural networks identified four targets (these were a subset of the RhoGAPs predicted by our classification model, namely, RacGAP50C, RacGAP84C, RhoGAP54D, and RhoGAP71E); however, the RhoF30L neural network provided poor specificity, predicting that all 13 RhoGAPs interact with Rho1. The concordance of our results with the predictions of the RacF28L neural network provides added confidence for our findings, but overall, this alternative method lacks necessary subtlety to discern genetic interactions more generally. Furthermore, the superiority of the main model over the univariate RacF28L classifier highlights the advantages of using high-dimensional data for improved inference (see also Supplemental Results).
Alternative outlier handling
While our classification model assigned each UTC single cell to a DTC, it may be argued that some cells should not be mapped to any DTC. We can define a cutoff for the Mahalanobis distance to each RhoGTPase cluster, such that a point mapped to this RhoGTPase by the main model, but exceeding this cutoff, would instead be deemed an outlier. A natural definition for the cutoff for a given DTC is the minimum distance (to that DTC cluster) of all the DTC's points not mapped to itself. Thus, a point exceeding the relevant cutoff for each RhoGTPase is not mapped to any of them. We may then, as before, map all single cells from each double-RNAi UTC to the set of DTCs, determine the mode of each UTC point set, and calculate a P-score for this classification based on the mode frequency. At optimal threshold, this model makes 21 (out of 39) predictions and correctly predicts all positive interactions (specificity, 67%), yielding a predictive power of P < 0.05. This is a promising result, suggesting that both the main classification model and the outlier-based model should be tried on future datasets.
Discussion
The contributions of this work are fourfold. The first contribution was to show that high-throughput morphological data can be used in a systematic fashion to identify genetic interactions. Second, we showed the fundamental fact that with additional prior knowledge of network structure, our framework can be used to identify signaling interactions successfully. Third, the computational framework presented here represents an initial approach to the problem that will serve as a basis for future enhancements. Fourth, we showed that for RhoGAP/GTPase signaling inference, our classification model demonstrates significantly improved performance using both single- and double-knockdown data versus only single-knockdown data.
We developed a general method to predict genetic interactions using high-throughput image-based data from a genetic screen, and applied it to the case of RhoGAP/GTPase regulation in Drosophila. Our work in identifying genetic interactions represents a generalization to high-dimensional morphological data of between-pathway and within-pathway genetic interactions that have been described for yeast (Kelley and Ideker 2005). In order to predict signaling relations, the method requires some prerequisite knowledge of the structure of RhoGAP/GTPase regulation (upstream vs. downstream TCs). Further development of an unbiased framework for predicting signaling interactions on the sole basis of image-based data is unlikely to succeed due to the high degree of noise in morphological data. Our work suggests that predictions can be successfully performed using image-based data when combined with additional knowledge, thus might be used to augment predictions using other data sources (e.g., transcriptional).
Why are predictions based on double-RNAi TCs better than those using single-RNAi TCs? Each RhoGAP likely regulates multiple RhoGTPases and each RhoGTPase is likely regulated by multiple RhoGAPs, meaning RNAi of a single RhoGAP may not robustly increase activity of a downstream RhoGTPase. However, RNAi of two RhoGAPs, each normally regulating the same RhoGTPase, more likely increases its activity. Because the regulatory structure is redundant, combinatorial RNAi is necessary for a sufficiently informative signal. Our findings for morphological data parallel those of phosphoproteomic data, for which the power of double RNAi has been demonstrated (Bakal et al. 2008). Future work could involve the application of our methods to image-based data for less redundant pathways, for example, VEGF (PVR) and MAPK pathways (Kiger et al. 2003; Sims et al. 2009).
As an additional application of our methodology, we developed a model that maps double RhoGAP knockdowns to single RhoGAP knockdowns. Viewed generally, this methodology represents a systematic way to identify within-pathway genetic interactions using quantitative morphological data. Applied to RhoGAP combinatorial RNAi, it provides a means for probing hierarchical relations between RhoGAPs. A dosage-response interaction has been described between RacGAP50C and RacGAP84C in fly wing (Sotillos and Campuzano 2000). We found that RacGAP50C−/RacGAP84C+ and RacGAP50C−/RacGAP84C− TCs share significant morphological similarity at the single-cell level, suggesting that RacGAP50C may be required for RacGAP84C activity. Within-pathway interactions between RhoGAPs may in some cases reflect complex spatiotemporal signaling rather than direct physical interactions.
A potential objection to our method of validation is the relatively small size of the validation set. However, the model's performance on positive controls was supported by a significance value of P < 0.025. Furthermore, the robustness of the model, both to method of dimensionality reduction and exclusion of data, increases our confidence in the validity of its predictions. We propose that our model's predictions for novel RhoGAP/GTPase interactions could serve as targets for further biological study. Human and yeast data suggest that many more RhoGAP/GTPase interactions likely occur in fly than have been validated (Yu et al. 2008), meaning that we should expect the model to generate false positives. However, an additional source of false positives is imprecision in RNAi; for instance, if there were incomplete knockdowns for two single-RNAi TCs, each might fail to display a GTPase phenotype, potentially causing incorrect identification of a between-pathway interaction. Collection of further data is required to increase confidence in the model's predictions against this source of false positives. Another potential objection is that the model does not classify any RhoGAP single- and double-knockdowns to the Cdc42Y32A TC with high confidence. One explanation for this is that the Cdc42 overexpression phenotype is, in a sense, intermediate to the RhoF30L and RacF28L phenotypes (Fig. 3). Consequently, the model is more successful at detecting similarity of RhoGAP TCs to RacF28L and RhoF30L as compared with Cdc42Y32A. However, the reason for the dearth of mappings to Cdc42 may reflect the RhoGAPs in the double-RNAi screen and the identity of their RhoGTPase partners.
Future work will involve acquisition of new double-RNAi morphological data for additional RhoGTPases, as well as for better simultaneous predictions of multiple RhoGTPase targets for each RhoGAP. For the latter task, one would obtain double-overexpression RhoGTPase data and augment the classification model with these TCs as targets. A RhoGAP TC mapped to a double-overexpression class (versus either of the single overexpression classes) would suggest multiple RhoGTPase targets. Additional optimizations to the classification model may be possible to improve performance and can be tested on larger data sets as they become available.
Methods
Morphological datasets
As previously described, TCs were prepared in the Drosophila DM-BG2 (referred to as BG-2) cell line using either dsRNA or overexpression constructs (Bakal et al. 2007). The screen consisted of 249 distinct genetic perturbations, with several replicates, for a total of 273 TCs, including two treatment conditions corresponding to constitutively active Rac1 (RacF28L) and Rho1 (RhoF30L) mutants, respectively, and a treatment condition corresponding to a fast-cycling Cdc42 mutant (Cdc42Y32A). For each single cell in each treatment condition, 145 geometric features and nine status features were extracted in a semiautomated fashion. In total, 12,601 single cells were imaged, for an average of 46 single cells for each TC. Each raw feature was normalized to have mean 0 and variance 1 across the full set of single cells. Following normalization, dimensionality reduction was performed by computing principal components (PCs) for all single-cell data and projecting onto the first three PCs.
Drosophila BG-2 cells were transfected with dsRNAs targeting 13 RhoGAPs (Table 1) in all possible combination components in combination with act-GAL4 and UAS-GFP plasmids. Live cells were imaged and the morphology of single cells was quantified using previously described methods. Cell segmentation was performed using the custom CellSegmenter Software (Bakal et al. 2007). For each single cell, the same 145 geometric and nine status features were extracted. All 13 single-RNAi TCs were constructed and all except one (RhoGAP19D/RhoGAP54D) of the  possible double-RNAi TCs were successfully constructed, for a total of 90 TCs. Overall, 6480 single cells were imaged, for an average of 72 cells per TC. The 90-TC data set was normalized and projected onto the first three PCs computed using the 273-TC data set. We conducted robustness testing by varying the number of dimensions of reduced feature space and rerunning the entire classification algorithm (Supplemental Methods).
The image datasets are available at http://groups.csail.mit.edu/cb/morphInference.
Classification model
The model maps the set, U, of upstream (e.g., RhoGAP knockdown) TCs into the set, D, of downstream (e.g., RhoGTPase overexpression) TCs. It was desirable that our model should (1) use single-cell data rather than mean scores for each TC, (2) assign meaningful confidence scores to each classification, and (3) correctly classify control (GTPase overexpression) TCs. More precisely, let U = {UTC1,UTC2,…,UTCn} and D = {DTC1,DTC2,…,DTCm}, where UTCi denotes the ith upstream TC and DTCj denotes the jth downstream TC. Let ci denote the number of single cells in UTCi. To classify UTCi into D, first each of its ci single cells is separately classified into D by calculating the Mahalanobis distance to each DTCj and selecting the closest DTCj. The classification of single cells in UTCi can be represented as a classification vector of length ci, and the classification of UTCi, denoted f (UTCi), was defined to be the mode of the classification vector. A confidence score was assigned using bootstrapping based on the frequency of the mode, denoted di. We selected 1000 random samples of ci cells from the full set of upstream TCs, classified these samples into D, and calculated the distribution of the mode frequency, d, of the classification vector. This distribution was used to determine the probability of observing a classification vector mode frequency no smaller than that observed for the classification of UTCi, i.e., the probability that d ≥ di.
Identifying RhoGAP/GTPase genetic and signaling interactions
We applied this general framework to classify the set of RhoGAP single- and double-RNAi TCs (U) into the set of RhoGTPase overexpression TCs (D). For single-RNAi data, results were not significantly altered by drawing samples from the set of cells comprising only single-RNAi TCs versus the entire set of single- and double-RNAi TCs (Supplemental Table 6). As required, the model correctly classifies each RhoGTPase overexpression experiment with high confidence (Supplemental Table 7). For double-knockdown RhoGAP TCs, e.g., knockdown of RhoGAPs A/B, we interpreted a positive classification to RhoGTPase C to suggest that both A and B signal through C, unless the single-knockdown TC for either A or B was classified to C at Bonferroni-corrected P = 0.05. We considered a high-confidence double-knockdown classification to be noninformative in case one of the single knockdown components was classified at high significance to the same RhoGTPase, as this was necessary to avoid false-positive predictions associated with single-knockdowns that dominate morphology (in practice, this excludes double-knockdowns with RhoGAP92B for the primary classification model). We incorporated this exclusion into all alternative algorithms under consideration, as well.
As an additional application of our classification model, we mapped the set of RhoGAP double-knockdowns (U) to RhoGAP single-knockdowns (D). Applying the model directly to the entire set, D, was not possible, because each element of D was not correctly mapped to itself. That is, some single-knockdown TCs were classified into different single-knockdown TCs, due to the fact that some of the 13 single-knockdown TCs were not morphologically distinguishable from one another. To remedy this, we clustered the single-knockdown TCs using a variant of EM designed to guarantee that, under the final clustering, all single-knockdown TCs would be correctly classified (Supplemental Methods; Supplemental Fig. 2).
Acknowledgments
O.N. was supported by the Department of Energy through the Computational Science Graduate Fellowship. C.B. was supported by the Leukemia and Lymphoma Society and is a Research Career Development Fellow of the Wellcome Trust. This work was partially supported by the National Institutes of Health grant 1R01GM081871-01A1 (B.B.). We thank John Aach for aid with image processing and Michael Baym and Uri Laserson for helpful input.
Author contributions: C.B. carried out the genetic screen and was responsible for the design of the study. O.N. designed the algorithms, conducted the bioinformatics analysis, and wrote the initial manuscript; B.B. contributed to the design of the study and algorithms; N.P., C.B., and B.B. helped prepare the manuscript.
Footnotes
[Supplemental material is available online at http://www.genome.org.]
Article published online before print. Article and publication date are at http://www.genome.org/cgi/doi/10.1101/gr.100248.109.
References
- Adams CL, Kutsyy V, Coleman DA, Cong G, Crompton AM, Elias KA, Oestreicher DR, Trautman JK, Vaisberg E. Compound classification using image-based cellular phenotypes. Methods Enzymol. 2006;2006:414440–414468. doi: 10.1016/S0076-6879(06)14024-0. [DOI] [PubMed] [Google Scholar]
- Albert R. Scale-free networks in cell biology. J Cell Sci. 2005;118:4947–4957. doi: 10.1242/jcs.02714. [DOI] [PubMed] [Google Scholar]
- Bakal C, Aach J, Church G, Perrimon N. Quantitative morphological signatures define local signaling networks regulating cell morphology. Science. 2007;316:1753–1756. doi: 10.1126/science.1140324. [DOI] [PubMed] [Google Scholar]
- Bakal C, Linding R, Llense F, Heffern E, Martin-Blanco E, Pawson T, Perrimon N. Phosphorylation networks regulating JNK activity in diverse genetic backgrounds. Science. 2008;322:453–456. doi: 10.1126/science.1158739. [DOI] [PMC free article] [PubMed] [Google Scholar]
- Baym M, Bakal C, Perrimon N, Berger B. High-resolution modeling of cellular signaling networks. Lect Notes Comput Sci. 2008;4955:257–271. [Google Scholar]
- Billuart P, Winter CG, Maresh A, Zhao X, Luo L. Regulating axon branch stability: The role of p190 RhoGAP in repressing a retraction signaling pathway. Cell. 2001;107:195–207. doi: 10.1016/s0092-8674(01)00522-0. [DOI] [PubMed] [Google Scholar]
- Boland MV, Murphy RF. A neural network classifier capable of recognizing the patterns of all major subcellular structures in fluorescence microscope images of HeLa cells. Bioinformatics. 2001;17:1213–1223. doi: 10.1093/bioinformatics/17.12.1213. [DOI] [PubMed] [Google Scholar]
- Boland MV, Markey MK, Murphy RF. Automated recognition of patterns characteristic of subcellular structures in fluorescence microscopy images. Cytometry. 1998;33:366–375. [PubMed] [Google Scholar]
- Carpenter AE, Jones TR, Lamprecht MR, Clarke C, Kang IH, Friman O, Guertin DA, Chang JH, Lindquist RA, Moffat J, et al. CellProfiler: Image analysis software for identifying and quantifying cell phenotypes. Genome Biol. 2006;7:R100. doi: 10.1186/1471-2105-9-482. [DOI] [PMC free article] [PubMed] [Google Scholar]
- Chen X, Murphy RF. Automated interpretation of protein subcellular location patterns. Int Rev Cytol. 2006;2006:249193–249227. doi: 10.1016/S0074-7696(06)49004-5. [DOI] [PubMed] [Google Scholar]
- Collins SR, Miller KM, Maas NL, Roguev A, Fillingham J, Chu CS, Schuldiner M, Gebbia M, Recht J, Shales M, et al. Functional dissection of protein complexes involved in yeast chromosome biology using a genetic interaction map. Nature. 2007;446:806–810. doi: 10.1038/nature05649. [DOI] [PubMed] [Google Scholar]
- Csete M, Doyle J. Bow ties, metabolism and disease. Trends Biotechnol. 2004;22:446–450. doi: 10.1016/j.tibtech.2004.07.007. [DOI] [PubMed] [Google Scholar]
- Fiedler D, Braberg H, Mehta M, Chechik G, Cagney G, Mukherjee P, Silva AC, Shales M, Collins SR, van Wageningen S, et al. Functional organization of the S. cerevisiae phosphorylation network. Cell. 2009;136:952–963. doi: 10.1016/j.cell.2008.12.039. [DOI] [PMC free article] [PubMed] [Google Scholar]
- Friedman N. Inferring cellular networks using probabilistic graphical models. Science. 2004;303:799–805. doi: 10.1126/science.1094068. [DOI] [PubMed] [Google Scholar]
- Friedman A, Perrimon N. Genetic screening for signal transduction in the era of network biology. Cell. 2007;128:225–231. doi: 10.1016/j.cell.2007.01.007. [DOI] [PubMed] [Google Scholar]
- Friedman N, Linial M, Nachman I, Pe'er D. Using Bayesian networks to analyze expression data. J Comput Biol. 2000;7:601–620. doi: 10.1089/106652700750050961. [DOI] [PubMed] [Google Scholar]
- Gil J, Wu H, Wang BY. Image analysis and morphometry in the diagnosis of breast cancer. Microsc Res Tech. 2002;59:109–118. doi: 10.1002/jemt.10182. [DOI] [PubMed] [Google Scholar]
- Glory E, Murphy RF. Automated subcellular location determination and high-throughput microscopy. Dev Cell. 2007;12:7–16. doi: 10.1016/j.devcel.2006.12.007. [DOI] [PubMed] [Google Scholar]
- Grumbling G, Strelets V The FlyBase Consortium. FlyBase: Anatomical data, images and queries. Nucleic Acids Res. 2006;34:D484–D488. doi: 10.1093/nar/gkj068. [DOI] [PMC free article] [PubMed] [Google Scholar]
- Han JD, Bertin N, Hao T, Goldberg DS, Berriz GF, Zhang LV, Dupuy D, Walhout AJM, Cusick ME, Roth FP, et al. Evidence for dynamically organized modularity in the yeast protein-protein interaction network. Nature. 2004;430:88–93. doi: 10.1038/nature02555. [DOI] [PubMed] [Google Scholar]
- Hiesinger PR, Hassan BA. Genetics in the age of systems biology. Cell. 2005;123:1173–1174. doi: 10.1016/j.cell.2005.12.006. [DOI] [PubMed] [Google Scholar]
- Hotta Y, Benzer S. Mapping of behaviour in Drosophila mosaics. Nature. 1972;240:527–535. doi: 10.1038/240527a0. [DOI] [PubMed] [Google Scholar]
- Jones TR, Carpenter AE, Lamprecht MR, Moffat J, Silver SJ, Grenier JK, Castoreno AB, Eggert US, Root DE, Golland P, et al. Scoring diverse cellular morphologies in image-based screens with iterative feedback and machine learning. Proc Natl Acad Sci. 2009;106:1826–1831. doi: 10.1073/pnas.0808843106. [DOI] [PMC free article] [PubMed] [Google Scholar]
- Kelley R, Ideker T. Systematic interpretation of genetic interactions using protein networks. Nat Biotechnol. 2005;23:561–566. doi: 10.1038/nbt1096. [DOI] [PMC free article] [PubMed] [Google Scholar]
- Kiger A, Baum B, Jones S, Jones M, Coulson A, Echeverri C, Perrimon N. A functional genomic analysis of cell morphology using RNA interference. J Biol. 2003;2:27. doi: 10.1186/1475-4924-2-27. [DOI] [PMC free article] [PubMed] [Google Scholar]
- Levy SF, Siegal ML. Network hubs buffer environmental variation in Saccharomyces cerevisiae. PLoS Biol. 2008;6:e264. doi: 10.1371/journal.pbio.0060264. [DOI] [PMC free article] [PubMed] [Google Scholar]
- Loo L, Wu LF, Altschuler SJ. Image-based multivariate profiling of drug responses from single cells. Nat Methods. 2007;4:445–453. doi: 10.1038/nmeth1032. [DOI] [PubMed] [Google Scholar]
- Lundström A, Gallio M, Englund C, Steneberg P, Hemphälä J, Aspenström P, Keleman K, Falileeva L, Dickson BJ, Samakovlis C. Vilse, a conserved Rac/Cdc42 GAP mediating Robo repulsion in tracheal cells and axons. Genes & Dev. 2004;18:2161–2171. doi: 10.1101/gad.310204. [DOI] [PMC free article] [PubMed] [Google Scholar]
- Moffat J, Grueneberg DA, Yang X, Kim SY, Kloepfer AM, Hinkle G, Piqani B, Eisenhaure TM, Luo B, Grenier JK, et al. A lentiviral RNAi library for human and mouse genes applied to an arrayed viral high-content screen. Cell. 2006;124:1283–1298. doi: 10.1016/j.cell.2006.01.040. [DOI] [PubMed] [Google Scholar]
- Neumann B, Held M, Liebel U, Erfle H, Rogers P, Pepperkok R, Ellenberg J. High-throughput RNAi screening by time-lapse imaging of live human cells. Nat Methods. 2006;3:385–390. doi: 10.1038/nmeth876. [DOI] [PubMed] [Google Scholar]
- Nusslein-Volhard C, Wieschaus E. Mutations affecting segment number and polarity in Drosophila. Nature. 1980;287:795–801. doi: 10.1038/287795a0. [DOI] [PubMed] [Google Scholar]
- Ohya Y, Sese J, Yukawa M, Sano F, Nakatani Y, Saito TL, Saka A, Fukuda T, Ishihara S, Oka S, et al. High-dimensional and large-scale phenotyping of yeast mutants. Proc Natl Acad Sci. 2005;102:19015–19020. doi: 10.1073/pnas.0509436102. [DOI] [PMC free article] [PubMed] [Google Scholar]
- Pe'er D, Regev A, Elidan G, Friedman N. Inferring subnetworks from perturbed expression profiles. Bioinformatics. 2001;17:S214–S224. doi: 10.1093/bioinformatics/17.suppl_1.s215. [DOI] [PubMed] [Google Scholar]
- Perlman ZE, Slack MD, Feng Y, Mitchison TJ, Wu LF, Altschuler SJ. Multidimensional drug profiling by automated microscopy. Science. 2004;306:1194–1198. doi: 10.1126/science.1100709. [DOI] [PubMed] [Google Scholar]
- Piano F, Schetter AJ, Morton DG, Gunsalus KC, Reinke V, Kim SK, Kemphues KJ. Gene clustering based on RNAi phenotypes of ovary-enriched genes in C. elegans. Curr Biol. 2002;12:1959–1964. doi: 10.1016/s0960-9822(02)01301-5. [DOI] [PubMed] [Google Scholar]
- Raymond K, Bergeret E, Dagher M, Breton R, Griffin-Shea R, Fauvarque M. The Rac GTPase-activating protein RotundRacGAP interferes with Drac1 and Dcdc42 signalling in Drosophila melanogaster. J Biol Chem. 2001;276:35909–35916. doi: 10.1074/jbc.M105779200. [DOI] [PubMed] [Google Scholar]
- Roguev A, Bandyopadhyay S, Zofall M, Zhang K, Fischer T, Collins SR, Qu H, Shales M, Park H, Hayles J, et al. Conservation and rewiring of functional modules revealed by an epistasis map in fission yeast. Science. 2008;322:405–410. doi: 10.1126/science.1162609. [DOI] [PMC free article] [PubMed] [Google Scholar]
- Sachs K, Perez O, Pe'er D, Lauffenburger DA, Nolan GP. Causal protein-signaling networks derived from multiparameter single-cell data. Science. 2005;308:523–529. doi: 10.1126/science.1105809. [DOI] [PubMed] [Google Scholar]
- Shannon P, Markiel A, Ozier O, Baliga NS, Wang JT, Ramage D, Amin N, Schwikowski B, Ideker T. Cytoscape: A software environment for integrated models of biomolecular interaction networks. Genome Res. 2003;13:2498–2504. doi: 10.1101/gr.1239303. [DOI] [PMC free article] [PubMed] [Google Scholar]
- Sims D, Duchek P, Baum B. PDGF/VEGF signaling controls cell size in Drosophila. Genome Biol. 2009;10:R20. doi: 10.1186/gb-2009-10-2-r20. [DOI] [PMC free article] [PubMed] [Google Scholar]
- Slack MD, Martinez ED, Wu LF, Altschuler SJ. Characterizing heterogeneous cellular responses to perturbations. Proc Natl Acad Sci. 2008;105:19306–19311. doi: 10.1073/pnas.0807038105. [DOI] [PMC free article] [PubMed] [Google Scholar]
- Sotillos S, Campuzano S. DRacGAP, a novel Drosophila gene, inhibits EGFR/Ras signalling in the developing imaginal wing disc. Development. 2000;127:5427–5438. doi: 10.1242/dev.127.24.5427. [DOI] [PubMed] [Google Scholar]
- Stark C, Breitkreutz B, Reguly T, Boucher L, Breitkreutz A, Tyers M. BioGRID: A general repository for interaction datasets. Nucleic Acids Res. 2006;34:D535–D539. doi: 10.1093/nar/gkj109. [DOI] [PMC free article] [PubMed] [Google Scholar]
- Tanaka M, Bateman R, Rauh D, Vaisberg E, Ramachandani S, Zhang C, Hansen KC, Burlingame AL, Trautman JK, Shokat KM, et al. An unbiased cell morphology-based screen for new, biologically active small molecules. PLoS Biol. 2005;3:e128. doi: 10.1371/journal.pbio.0030128. [DOI] [PMC free article] [PubMed] [Google Scholar]
- Tcherkezian J, Lamarche-Vane N. Current knowledge of the large RhoGAP family of proteins. Biol Cell. 2007;99:67–86. doi: 10.1042/BC20060086. [DOI] [PubMed] [Google Scholar]
- Tong AHY, Evangelista M, Parsons AB, Xu H, Bader GD, Page N, Robinson M, Raghibizadeh S, Hogue CWV, Bussey H, et al. systematic genetic analysis with ordered arrays of yeast deletion mutants. Science. 2001;294:2364–2368. doi: 10.1126/science.1065810. [DOI] [PubMed] [Google Scholar]
- Wang J, Zhou X, Bradley PL, Chang S, Perrimon N, Wong ST. Cellular phenotype recognition for high-content RNA interference genome-wide screening. J Biomol Screen. 2008;13:29–39. doi: 10.1177/1087057107311223. [DOI] [PubMed] [Google Scholar]
- Wong SL, Zhang LV, Tong AHY, Li Z, Goldberg DS, King OD, Lesage G, Vidal M, Andrews B, Bussey H, et al. Combining biological networks to predict genetic interactions. Proc Natl Acad Sci. 2004;101:15682–15687. doi: 10.1073/pnas.0406614101. [DOI] [PMC free article] [PubMed] [Google Scholar]
- Young DW, Bender A, Hoyt J, McWhinnie E, Chirn G, Tao CY, Tallarico JA, Labow M, Jenkins JL, Mitchison TJ, et al. Integrating high-content screening and ligand-target prediction to identify mechanism of action. Nat Chem Biol. 2008;1:59–68. doi: 10.1038/nchembio.2007.53. [DOI] [PubMed] [Google Scholar]
- Yu J, Pacifico S, Liu G, Finley RL. DroID: The Drosophila Interactions Database, a comprehensive resource for annotated gene and protein interactions. BMC Genomics. 2008;2008:9461. doi: 10.1186/1471-2164-9-461. [DOI] [PMC free article] [PubMed] [Google Scholar]


