Abstract
Cone beam CT systems are being deployed in large numbers for small animal imaging, dental imaging, and other specialty applications. A new high-precision method for cone beam CT system calibration is presented in this paper. It uses multiple projection images acquired from rotating point-like objects (metal ball bearings) and the angle information generated from the rotating gantry system is also used. It is assumed that the whole system has a mechanically stable rotation center and that the detector does not have severe out-of-plane rotation (< 2°). Simple geometrical relationships between the orbital paths of individual BBs and five system parameters were derived. Computer simulations were employed to validate the accuracy of this method in the presence of noise. Equal or higher accuracy was achieved compared with previous methods. This method was implemented for the geometrical calibration of both a micro CT scanner and a breast CT scanner. The reconstructed tomographic images demonstrated that the proposed method is robust and easy to implement with high precision.
Keywords: cone-beam, CT, geometric calibration
I. INTRODUCTION
Flat panel detector-based cone beam CT systems acquire projection images during the rotation of either the object itself, or the x-ray and detector systems around the object on a mechanically stable axis. The axis of rotation is referred to as the rotation center. A three-dimensional volume data set consisting of a number of tomographic images of the object is reconstructed from the projection data. Precise assessment of the CT system’s geometric parameters is crucial to achieve successful reconstruction with good spatial resolution and low artifact content in the reconstructed tomographic images. In this study, a method for estimating system geometric parameters necessary for cone beam reconstruction is discussed. An accurate determination of system geometric parameters results from the proposed method. The cone beam CT system calibration method utilizes a ball-bearing phantom (BB phantom) and angle information generated from the gantry encoder electronics. Because this method does not require precise information about the phantom (only a rough measurement of distance between two BBs is required), it is robust and easy to implement.
II. CONE BEAM GEOMETRY AND PREVIOUS CALIBRATION METHODS
A. Geometry definition and system parameters
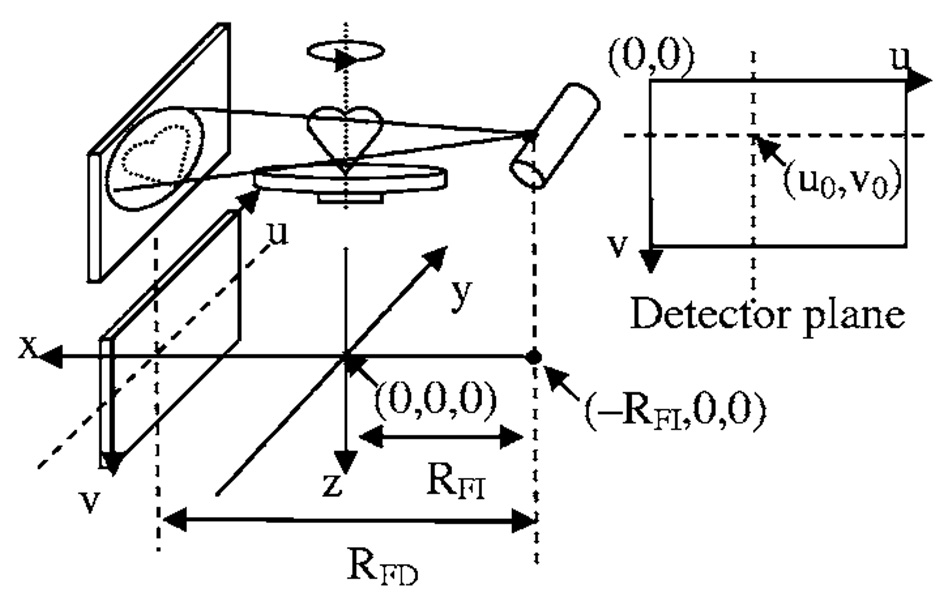
To describe the cone beam CT geometry, it is convenient to assume that the x-ray source and detector system are stationary and that the object rotates around the rotation center. As shown in Fig. 1, the rotation axis is defined as the z axis of the system. The axis which passes through the cone vertex (x-ray tube focal spot) and which is also perpendicular to the z axis is defined as the x axis. The axis perpendicular to the x-z plane which passes through the intersection of the x axis and z axis is defined as the y axis. In the detector plane, two more axes are defined along the detector, (u,υ) for horizontal and vertical, respectively. Thus, (u,υ)=(0,0) represents the top left (viewed from the x-ray source) detector pixel.
FIG 1.
Cone beam geometry.
If the detector is aligned such that the υ axis is parallel to z axis and the u axis is parallel to y axis, the system geometric parameters include:
Source to isocenter distance, RFI, distance from the cone vertex to the rotation center, and thus the coordinate of the cone vertex (x-ray tube focal spot) is (−RFI,0,0).
Source to detector distance, RFD, distance from the cone vertex to the detector plane, so the detector plane is located at x=RFD−RFI.
u0, horizontal location of the intersection of the x axis and detector plane.
-
υ0, vertical location of the intersection of the x axis and detector plane.
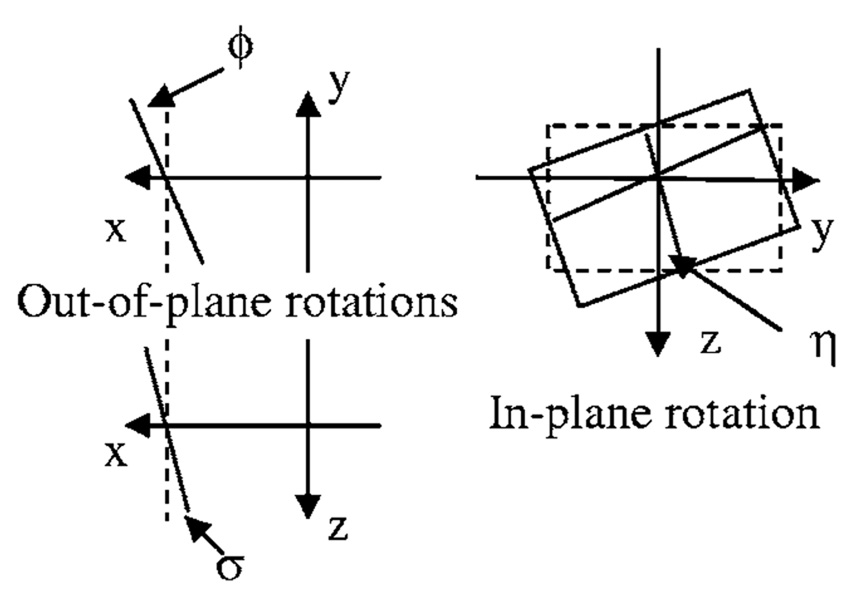
The detector rotation is defined in three parameters, as shown in Fig. 2. ϕ and σ are out-of-plane rotation angles and η is the in-plane rotation angle.
ϕ, the rotation angle of the detector plane along the axis of u=u0, which is also the axis determined by y=0 and x=RFD−RFI.
σ, the rotation angle of the detector plane along the axis of υ= υ0, which is also the axis determined by z=0 and x=RFD−RFI.
η, the rotation angle of the detector plane along the point of (u0,υ0), which is also the point of (RFD−RFI,0,0).
FIG 2.
Detector rotation.
For a position (xi,yi,zi) to be reconstructed in the volume data set which defines the object, the corresponding projection position on the ideally aligned detector plane (without any in-plane or out-of-plane rotation) is determined by
| (1) |
For a non-ideally aligned detector with three rotation angles known as (ϕ,σ,η), a transform matrix T can be used to define the ideally aligned detector position. We use (u′,υ′,w′) to represent a point on the nonideal detector plane, and (u,υ,w) to represent the corresponding position on the ideal detector plane. The origin of the rotation in (u,υ,w) system is located at position (u0·Δu,υ0·Δυ,RFD−RFI) under the (x,y,z) coordinate system, where Δu and Δυ are pixel dimensions in the units of mm/pixel in the horizontal and vertical directions, respectively.
Then we have
| (2) |
where
| (3) |
Thus, the seven geometric parameters RFD, RFI, u0, υ0, ϕ, σ, and η are required to completely describe the cone beam CT geometry, which means that with precise measurement of these seven parameters, the exact three-dimensional geometric structure of the object can be reconstructed from the projection data.
B. Literature report on previous methods
Many methods have been proposed for CT, PET, or SPECT system calibration, for both fan beam and cone beam geometries.1–8 Many of these methods used the coordinate information acquired from projections of “point-like” objects (small ball-bearings with higher or lower density compared to the background) to calculate the system geometric parameters.4,5,7,8 For early investigations, simultaneous nonlinear equations of these system parameters were constructed from the projection locations of point objects. To solve these equations, iterative methods, such as Levenberg-Marquard algorithm, were often applied.2 These methods required either precise knowledge of the point locations, using a special manufactured calibration phantom,8 or good initial values for the system parameters, which in some situations were difficult to assess. Problems involving parameter count restrictions, nonlinear optimization issues, algorithm convergence, and uniqueness of the solution, limited the effectiveness of these methods. To avoid those difficulties in solving the nonlinear equations, Noo et al.4 proposed a method by introducing intermediate parameters from fitting an ellipse to the projection-orbit data. This method only requires a small set of measurements of a simple phantom consisting of two BBs. This method assumes that one out-of-plane rotation angle σ=0. Also two BBs used in the calibration phantom need to be on the opposite side of the central plane, as an extra requirement for phantom placement. Recently, von Smekal et al.7 proposed an analytical method to solve six system parameters, except for the source to isocenter distance RFI, based on Fourier analysis of the projection-orbit data. This method can explicitly solve these six parameters by canceling out RFI in those nonlinear equations and it does not require any prior knowledge for the phantom. It has up to 50% error in the estimation of out-of-plane rotation angles ϕ and σ. The authors observed a minor distortion of the reconstructed image even with a 20° out-of-plane rotation of the detector. These authors also observed that these two out-of-plane rotation angles have a very small effect on the reconstructed images compared with the in-plane rotation angle.
Based upon the results of previously reported methods and our own investigation, the following observations can be made:
These two out-of-plane rotation angles, ϕ and σ, are quite difficult to determine with reasonable accuracy.
These two angles have only a small influence on the image quality compared with other parameters.
In practical implementation, these two angles can be kept small (less than 1°) by good mechanical design (CAD), high accuracy machining, and careful alignment of phantom.
In this paper, we present a simple method to estimate five system parameters with angle information from the rotation system. We assume that the two out-of-plane rotation angles, ϕ and σ, are zero, based on the observation of von Smekal et al.,7 the analytic validation in Sec. III A, and computer simulation results in Sec. IV. In addition, only linear regression techniques are used for data fitting, making the proposed method less sensitive to noise and relatively simple to implement.
III. THEORY
A. Validation of the assumption
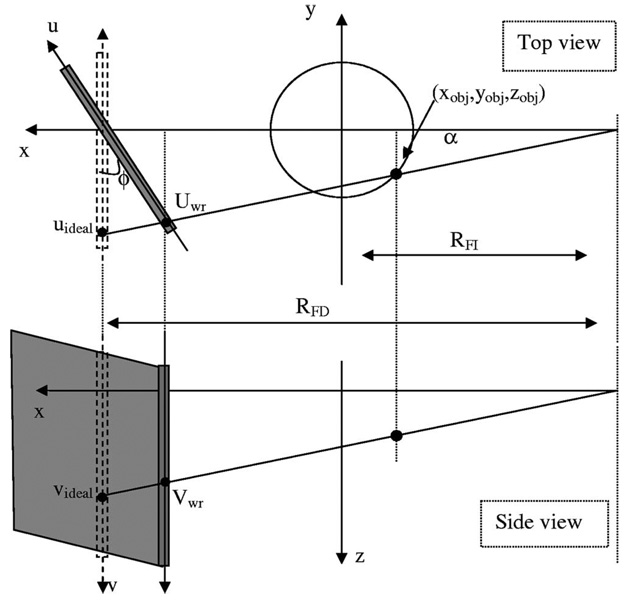
In this calibration method, we assume that ϕ=0 and σ=0. To validate this assumption, the introduced errors in the calculation of the projected coordinates of the point-like object in the detector plane were calculated. As shown in Fig. 3, for an ideal point object with coordinates of (xobj,yobj,zobj), if the detector is ideally aligned (i.e., ϕ=0 and σ=0), the point will be projected onto the detector plane at (uideal,υideal) and
| (4) |
FIG 3.
Out-of-plane rotation in one direction.
We first consider out-of-plane rotation in one direction only, e.g., ϕ≠0 and σ=0. We can also assume −90° < ϕ < 90°. Then the position of this object on the detector plane with out-of-plane rotation is (uwr,υwr), and
| (5) |
The relationship between the coordinates with and without rotation can be expressed as
| (6) |
If we define 2α as the fan angle, then
| (7) |
The percentage errors in υ and u (for uideal≠0,υideal≠0) will be a function of α and ϕ as
| (8) |
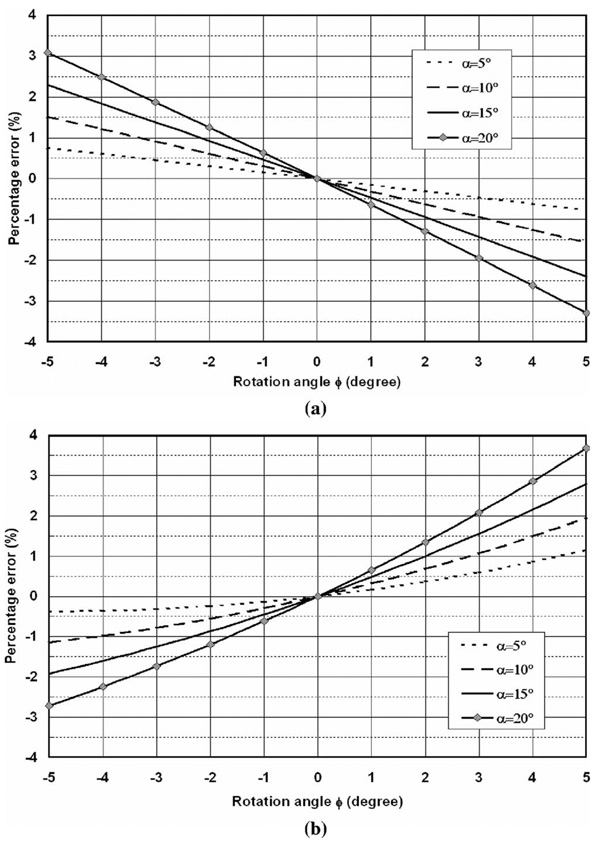
If we consider the effect of the other out-of-plane rotation angle σ, the results will be identical to those discussed earlier due to symmetry, which means the effect of ϕ on u will be exactly the same as the effect of σ on υ. Therefore, Fig. 4 only shows the results of ϕ.
FIG 4.
Percentage error in (a) u, (b) υ, as a function of out-of-plane rotation angle ϕ, and fan angle α. Fan angle α=5°, 10°, 15°, 20°, to avoid redundant curves, only positive fan angle curves are shown.
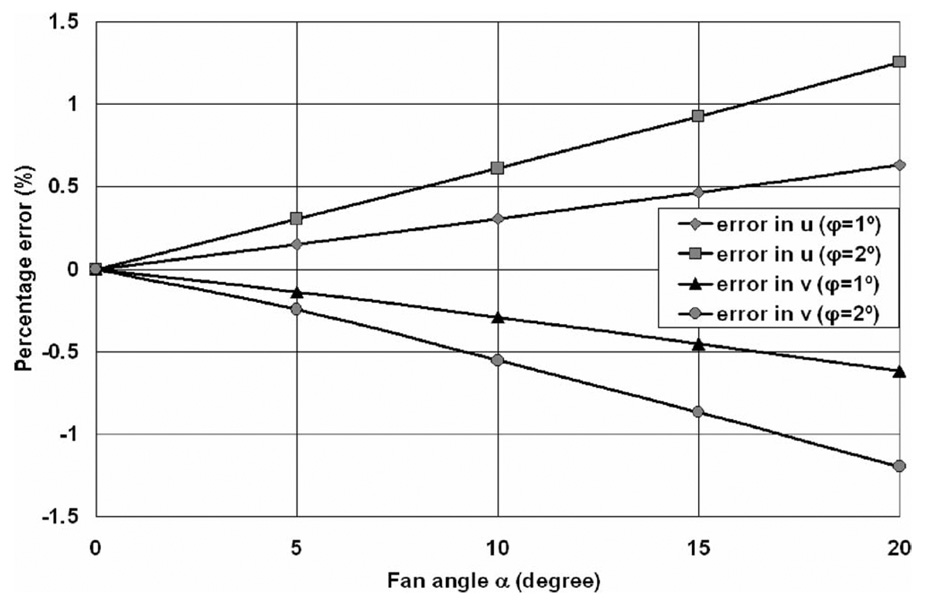
As shown in Fig. 4, errors increase with increasing fan angle and rotation angle. For α⩽ 15°, −2° ⩽ϕ⩽ 2°, the maximal errors in both υ and u are less than 1%, and this 1% error only occurs to the pixels at the edge of the detector with a 15° fan angle. Pixels corresponding to smaller fan angles have errors smaller than 1%. As shown in Fig. 5, the maximal percentage error in both u and υ drops to 0.68% for α=10° and 0.37% for α=5°, with ϕ=2°.
FIG 5.
Percentage error as a function of fan angle α.
From the above discussion, we can assume that these two out-of-plane rotation angles ϕ=0 and σ=0, because they only have minor (normally less than 1% for the worst case on the edge of the detector) effects on system calibration if the detector does not have severe out-of-plane rotations (<2°). Normally with the advantage of computer aided design (CAD), less than 1° out-of-plane rotations can be achieved, which means the maximal error in pixel position will be even smaller than 0.5% on the edge. For example, careful measurement of the detector rotation angle, ϕ, on the breast CT system in our laboratory demonstrated that ϕ < 0.5°. Therefore, with the assumptions that the detector can be physically mounted to yield negligible errors, coupled with the observation that small alignment errors have minimal effect on calibration performance, the system calibration is simplified to a problem of estimating the remaining five system parameters, RFD, RFI, u0, υ0, and η.
B. Projection orbit and benchmark points
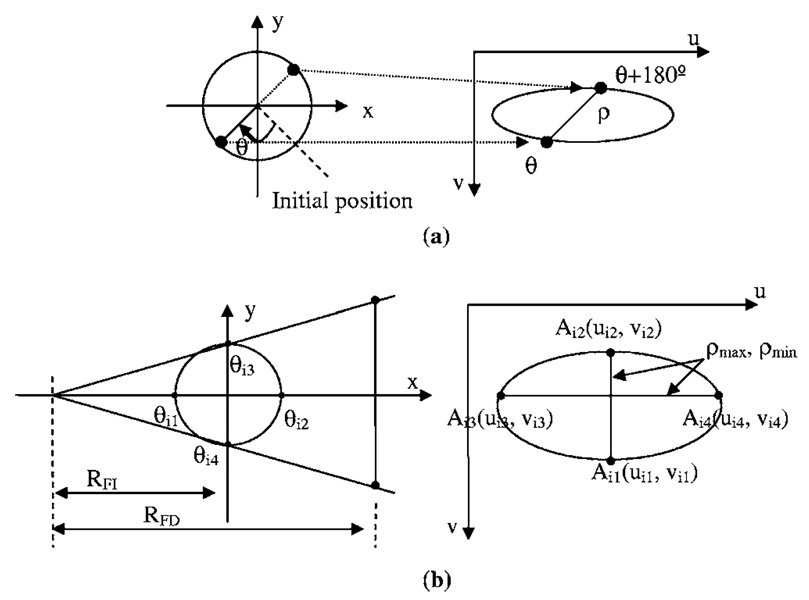
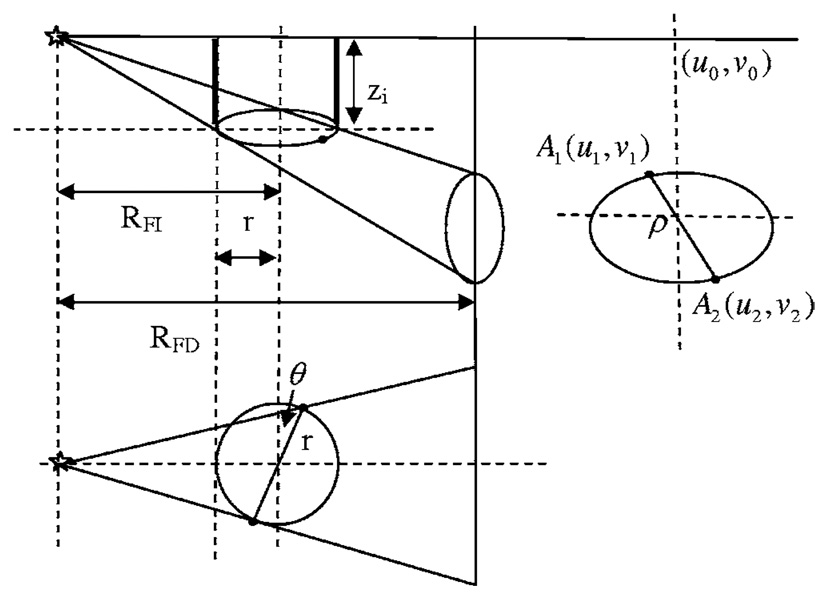
For a cone beam CT system, if we assume that only the object rotates and the x-ray tube and detector remain stationary, the orbit of a point in the object (such as a BB) during the scan is a circle in a plane parallel to x-y plane. The projection of this circle on the detector plane will be an ellipse. Individual points on this ellipse correspond to the BB’s angular position on the circle, relative to an initial reference position. We refer to two points on the circular orbit that are exactly 180° out of phase as a “radial pair,” as illustrated in Fig. 6(a). We can calculate ρ, the distance between a radial pair of points on the detector plane as described in Appendix A.
FIG 6.
(a) Projection orbit and radial pair. (b) Benchmark points.
In Appendix A, we prove that ρ will have its maximum and minimum values when the point object is on the x axis or y axis (respectively) for cone beam CT systems with a fan angle less than 60° and a cone angle less than 30°.
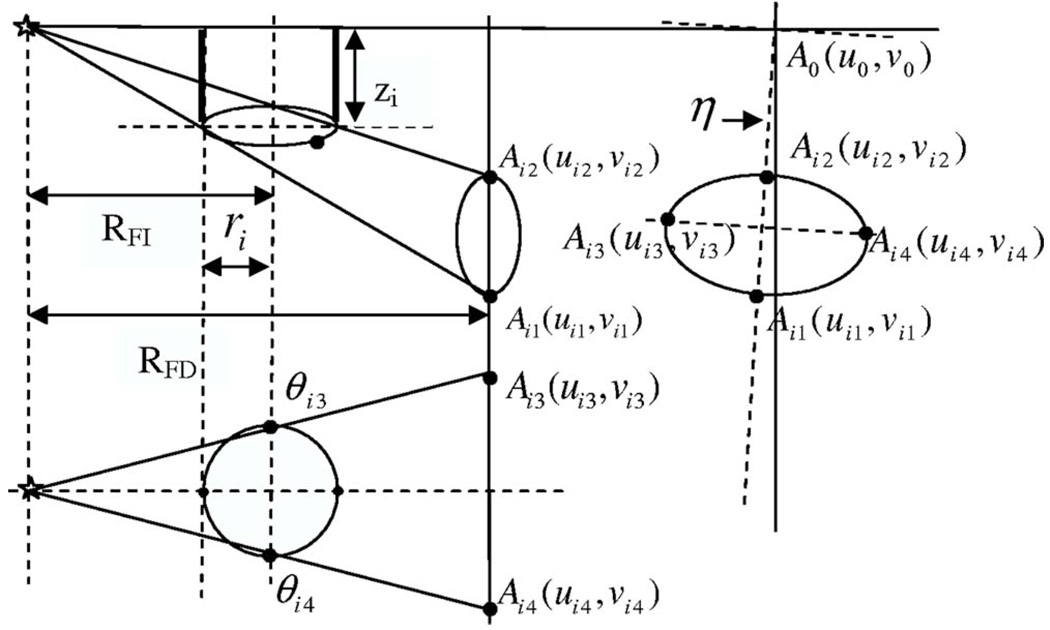
As illustrated in Fig. 6(b), after the maximum and minimum distances ρ between a radial pair are determined, four corresponding benchmark points can be defined on the detector plane as Aij(uij,υij), where i is the index number of individual BBs, and j is the index number for four benchmark points on each BB orbit, j=1,2,3,4. We will carry out the following calibration with the coordinates of these benchmark points.
C. Calculation of RFD and v0
For every individual BB indexed by i, we define
| (9) |
As proven in Appendix B, a linear function X=a1 + b1Y can fit all the (Yi,Xi) pairs, and the values of the parameters υ0 and RFD can be determined from two coefficients, a1 and b1, by
| (10) |
D. Calculation of η and u0
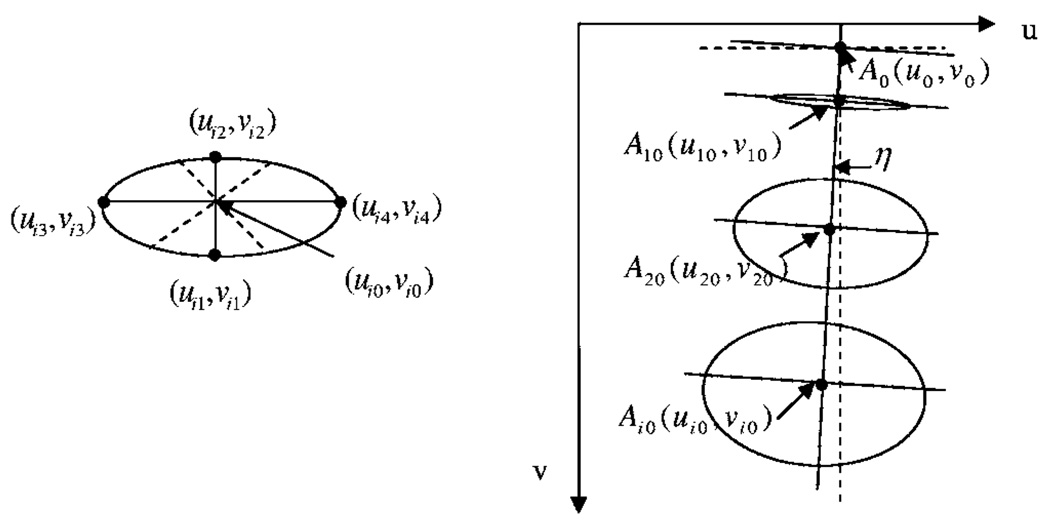
To locate the projection line of the rotation center, we first need to locate the projection center of each ellipse Ai0(ui0,υi0), which can be determined by four benchmark points and every other four points (positions) which are 90° apart from each other, as shown in Fig. 7. For any group of four points, we have
| (11) |
We can go through all the different four-point groups and average the results to get a more accurate estimation of the projection center of an individual ellipse. All these projection centers of the different BB trajectories will form the projection line of the rotation center, and we can use a linear function U=a2 + b2V to fit all the coordinates (ui0,υi0). Since we already have the value of υ0:
| (12) |
FIG 7.
Calculation of η and u0.
E. Calculation of RFI
To calculate the last parameter RFI, we need the distance between two BBs, l, which can be measured before the phantom scan. This requirement is equivalent to the assumption in Smekal’s paper7 where source to isocenter distance RFI should be known. For a normal CT system, it is physically difficult to locate the exact position of the x-ray focal spot because it is internal to the x-ray tube housing. It is also very difficult to find the location of the isocenter. Consequently, it is much more difficult to accurately measure the source to isocenter distance directly than to measure the distance between two BBs embedded on a phantom.
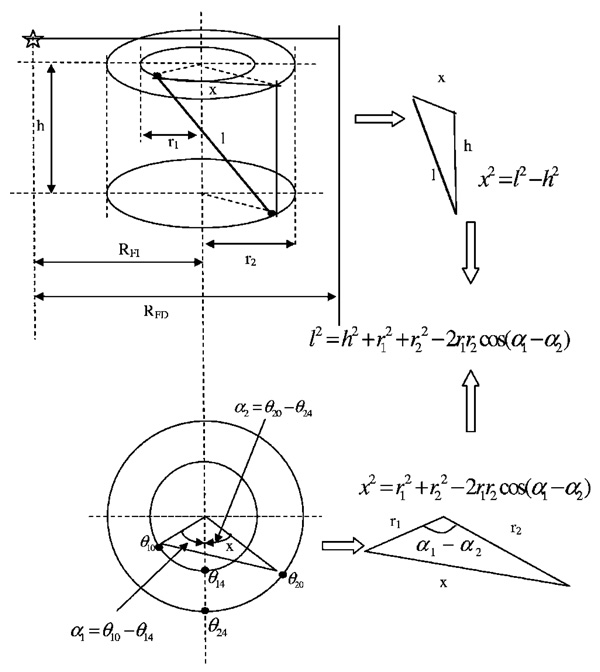
If we label these two BBs as i=1 and i=2, as shown in Fig. 8, h is defined as the vertical distance between two orbits, r1 and r2 are radius for each orbit, and we have
| (13) |
From previous steps, we already have
| (14) |
If we define the original angular positions (before the system starts rotating) of BBs 1 and 2 as θ10 and θ20, respectively, then
| (15) |
We thus solve RFI using
| (16) |
FIG 8.
Calculation of RFI.
IV. COMPUTER SIMULATION
To validate the accuracy of the calibration method described in Sec. III, the projection coordinates of BBs on the detector plane were simulated. The calibration method was then applied on the simulated data and the calculated system parameters were compared with their known values. Gaussian noise of different standard deviation was added to the projection coordinates to simulate the effect of noise in the practical measurement environment and to evaluate the consistency of this method in the presence of noise.
In this simulation, the detector matrix size was set to 2048 × 1024 with a pixel size of 48 µm × 48 µm, similar to the mouse CT scanner assembled in our laboratory. The five system parameters were set as: RFD=400.0000 mm, RFI=150.0000 mm, u0=1005.0000 pixel, υ0=480.0000 pixel, η=−1.0000°.
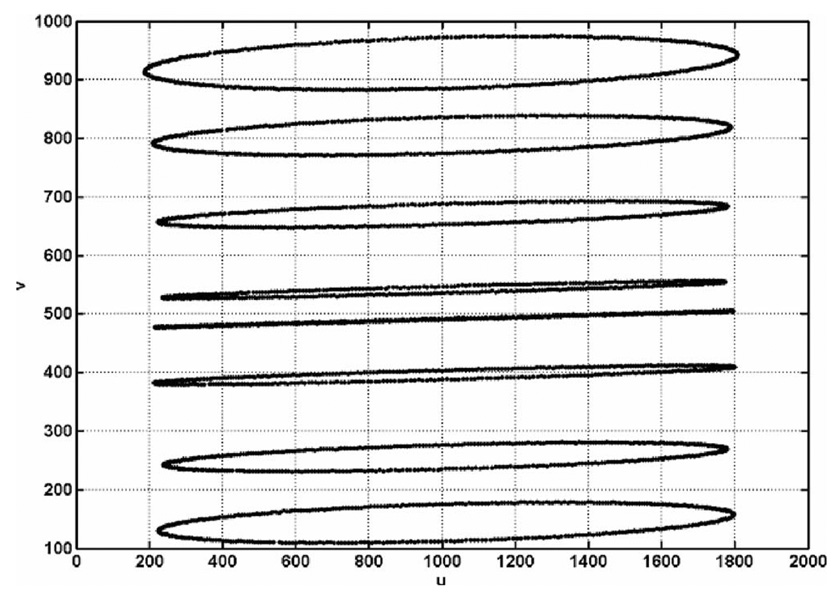
Eight BBs were simulated and the distance between the first and the last BB was l=14.39 mm. Five hundred points were simulated for each projection orbit, corresponding to a 500-view CT scan in 360°. One example of the simulation is shown in Fig. 9.
FIG 9.
Simulated projection orbits with Gaussian noise. RFD=400 mm, RFI=150 mm, u0=1005 pixel, v0=480 pixel, η=−1.0°, standard deviation of Gaussian noise=0.4 pixel.
Simulations were performed in three different groups:
No preset out-of-plane rotation, with different noise levels, results are shown in Table I and Table II;
With different out-of-plane rotation angles, without noise, results are shown in Table III;
With specific preset out-of-plane rotations (ϕ=1.5000°,σ=1.2000°), with different noise levels, results are shown in Table IV and Table V.
TABLE I.
R-square values for linear fitting.
| Standard deviation of Gaussian noise s (pixels) for s≠0, calculated from ten simulations |
|||||
|---|---|---|---|---|---|
| s=0.00 | s=0.01 | s=0.20 | s=0.40 | s=1.00 | |
|
R-square value in calculation of RFD and υ0 |
0.999 999 1 | 0.999 998 1±5 × 10⁻⁷ | 0.999 984±7 × 10⁻⁶ | 0.999 96±3 × 10⁻⁵ | 0.9997±1 × 10⁻⁴ |
|
R-square value in calculation of η and u0 |
0.999 999 8 | 0.999 991±5 × 10⁻⁶ | 0.997±0.002 | 0.99±0.01 | 0.92±0.05 |
TABLE II.
Calibration results from computer simulation.
| Standard deviation of Gaussian noise s (pixels) for s≠0, calculated from ten simulations |
||||||
|---|---|---|---|---|---|---|
| True value | s=0.00 | s=0.01 | s=0.20 | s=0.40 | s=1.00 | |
| u0(pixel) | 1005.0000 | 1004.9942 | 1004.996±0.006 | 1005.1±0.1 | 1005.1±0.4 | 1004±2 |
| υ0(pixel) | 480.0000 | 480.3769 | 480.3±0.1 | 480.5±0.6 | 480±1 | 479±2 |
| η(°) | −1.0000 | −0.9995 | −1.0000±0.0007 | −1.00±0.02 | −0.99±0.03 | −0.95±0.09 |
| RFI(mm) | 150.0000 | 150.2963 | 150.0±0.3 | 150.1±0.3 | 150±1 | 152±2 |
| RFD(mm) | 400.0000 | 400.3005 | 400.1±0.2 | 400.8±0.9 | 401±2 | 407±4 |
TABLE III.
Effects of out-of-plane rotations.
| Out-of-plane rotation angles (°) | ||||||
|---|---|---|---|---|---|---|
| True value | ϕ=0.00 σ=0.00 |
ϕ=0.00 σ=1.00 |
ϕ=1.00 σ=0.00 |
ϕ=1.50 σ=1.20 |
ϕ=2.00 σ=2.00 |
|
| u0(pixel) | 1005.0000 | 1004.9942 | 1005.0020 | 1005.6332 | 1005.9569 | 1006.2793 |
| υ0(pixel) | 480.0000 | 480.3769 | 479.9526 | 480.1998 | 479.9063 | 479.7111 |
| η(°) | −1.0000 | −0.9995 | −1.0001 | −0.9997 | −0.9996 | −0.9996 |
| RFI(mm) | 150.0000 | 150.2963 | 150.0243 | 150.1630 | 150.0416 | 149.9442 |
| RFD(mm) | 400.0000 | 400.3005 | 399.7043 | 399.9493 | 399.7949 | 399.7446 |
TABLE IV.
R-square values for linear fitting (ϕ=1.5000°,σ=1.2000°).
| Standard deviation of Gaussian noise s (pixels) for s≠0, calculated from ten simulations |
|||||
|---|---|---|---|---|---|
| s=0.00 | s=0.01 | s=0.20 | s=0.40 | s=1.00 | |
|
R-square value in calculation of RFD and υ0 |
0.999 997 1 | 0.999 997 4±6 × 10⁻⁷ | 0.999 988±6 × 10⁻⁶ | 0.999 96±2 × 10⁻⁵ | 0.9997±1 × 10⁻⁴ |
|
R-square value in calculation of ηand u0 |
0.999 981 0 | 0.999 98±1 × 10⁻⁵ | 0.997±0.003 | 0.99±0.01 | 0.92±0.05 |
TABLE V.
Calibration results from computer simulation (ϕ=1.5000°, σ=1.2000°).
| Standard deviation of Gaussian noise s (pixels) for s≠0, calculated from ten simulations. |
||||||
|---|---|---|---|---|---|---|
| True value | s=0.00 | s=0.01 | s=0.20 | s=0.40 | s=1.00 | |
| u0(pixel) | 1005.0000 | 1005.9569 | 1005.96±0.01 | 1005.9±0.1 | 1005.9±0.3 | 1005.6±0.9 |
| υ0(pixel) | 480.0000 | 479.9063 | 479.96±0.08 | 479.7±0.4 | 480±1 | 479±3 |
| η(°) | −1.0000 | −0.9996 | −0.9963±0.0005 | −0.99±0.02 | −0.99±0.03 | −0.99±0.08 |
| RFI(mm) | 150.0000 | 150.0416 | 150.0±0.2 | 149.9±0.5 | 150.2±0.5 | 151±2 |
| RFD(mm) | 400.0000 | 399.7949 | 399.9±0.2 | 400.3±0.9 | 401±1 | 404±3 |
Linear regression was used in two steps of the calibration method, and the R-square value or the coefficient of determination, which is the indicator of how well the fitting works, was shown in Table I and Table IV. Gaussian noise with standard deviations s of 1%, 20%, 40%, and 100% of the pixel size were independently added into the horizontal and vertical coordinates of every projection position. Most R-square values calculated were close to 1.0, corresponding to an ideal linear fitting. Especially in calculation of RFD and υ0, the R square value was very consistent even with a noise level of s=1.00 pixel.
The system parameters calibrated from computer simulation are listed in Table II, Table III, and Table V. Though the results degraded slightly with increasing noise, the calibrated values were nevertheless accurate in comparison with their true values.
From the results shown in Table III–Table V, when the out-of-plane rotation angles are relatively small (less than 2°), there will be minor effects caused by neglecting these angles compared with the effects caused by the noise in the measurement of BB positions. And normal engineering design and machinery can satisfy this loose requirement by limiting out-of-plane rotations to within 1°. These results demonstrate that good calibration accuracy can be achieved assuming ϕ=0 and σ=0.
Computer simulations were performed with various system parameters including the number of views, number of BBs used, and different combinations of system parameters. All the calibration results under various conditions validated the accuracy of this calibration method.
To compare with previous results, simulations with same rotation angles and noise level as in Smekal’s7 work were performed and calibration results are given in Table VI. In Table VI, relative errors were calculated by the ratio between uncertainties and mean values. The method presented here has equal or better accuracy as the results reported by Smekal et al.7
TABLE VI.
Comparison with Smekal’s method (ϕ=1.5000°, σ=1.2000°).
| Standard deviation of Gaussian noise s=0.4 pixels | ||
|---|---|---|
| System parameters | This method | Smekal’s et al. |
| u0(pixel) | 1005.9±0.3 | 0.005 367±2.2 × 10⁻⁶ |
| Relative error | 0.000 298 2 | 0.000 409 9 |
| υ0(pixel) | 480±1 | 0.004 564±0.000 655 |
| Relative error | 0.002 083 3 | 0.143 514 4 |
| η(°) | −0.99±0.03 | −1.005±0.017 |
| Relative error | 0.030 303 0 | 0.016 915 4 |
| RFD(mm) | 401±1 | 2.489±0.020 |
| Relative error | 0.002 493 8 | 0.008 035 4 |
V. IMPLEMENTATION
A. Mass center calculation and trajectory tracking
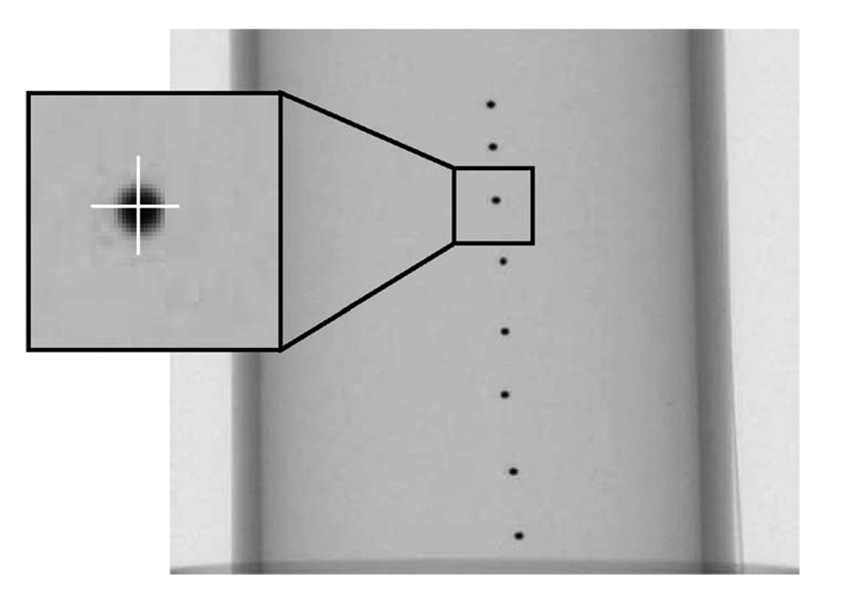
For practical implementation of the calibration method, small ball bearings (with diameters of 0.25 or 2.3 mm in our study for two different scanners) were used as point-like objects to provide projection coordinates. Because of its finite size and the cone beam system magnification, the projection of an individual BB covers more than one pixel in the detector plane, as shown in Fig. 10. The projection images were first processed to reverse the gray scale and thresholded to reduce the background noise. Then the projection coordinates were calculated as the mass center of the x-ray shadow area by
| (17) |
while Image(u,υ) is the gray scale value of detector pixel (u,υ) after processing. The mass center was calculated iteratively three times for each view (Please refer to Appendix C). Computer simulation was performed to demonstrate that the calculated mass center has the error of less than 0.05 pixel from the true projection center of the BB. A computer program was developed to automatically track BB positions along the trajectory continuously through all the views. Detailed simulation and tracking procedures are also provided in Appendix C.
FIG 10.
Projection image of BB phantom and mass center calculation.
B. A micro CT system
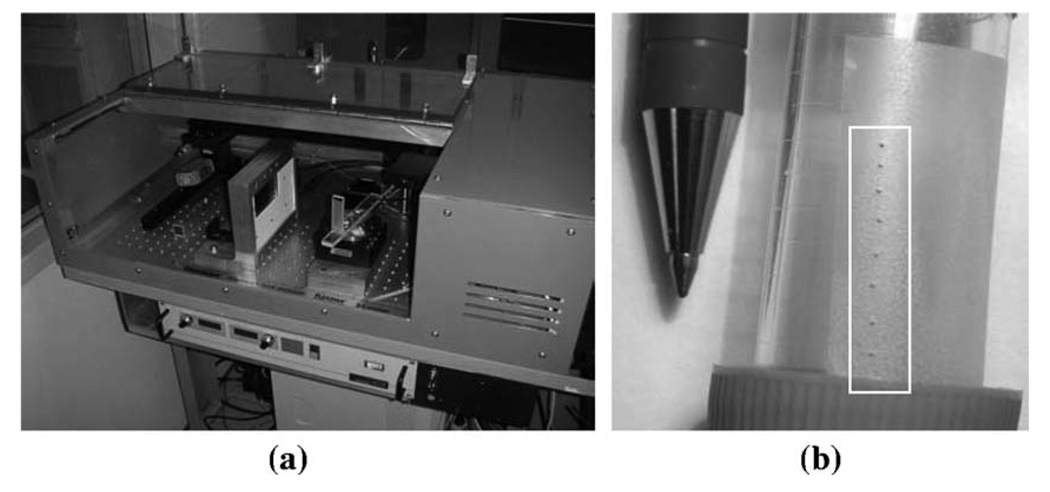
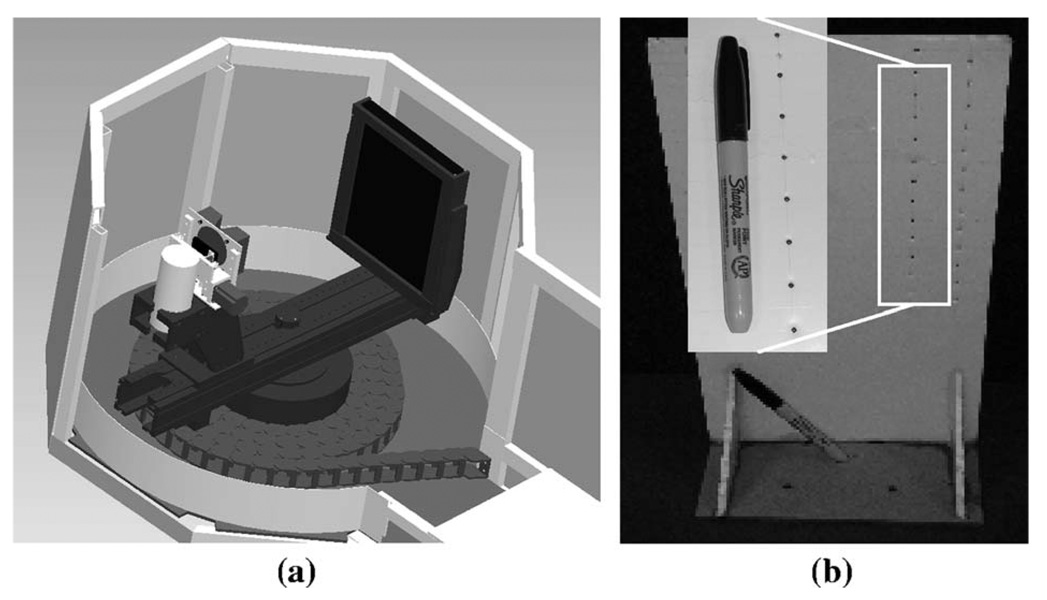
The calibration method was applied to a micro CT system developed in our lab. In this system, an x-ray tube (XTF5011, Oxford Instruments, Scotts Valley, CA) with a 70 µm focal spot was used as the x-ray source, and was capable of 4–50 kVp and 0–1.0 mA operation. The CMOS detector (Shad-o-Box 2048, Rad-icon Imaging Corp., Santa Clara, CA) used in this system has an active area of 50 × 100 mm2 and pixel size of 48 µm, and produces 1024 × 2048 projection images. A rotary stage driven by a stepping motor (MDrive 23, Intelligent Motion Systems, Inc., Marlborough, CT) was used to rotate the object. The whole system is shown in Fig. 11(a). Eight stainless steel ball bearings with a diameter of 254 µm were taped on the surface of a 19-mm-diameter test tube to make the BB phantom. The distance between BB 1 and BB 8 was measured as: l=17.2 mm (Fig. 11(b)). Every scan was performed with 30.0 kVp, 0.5 mA, and 500 views. The system parameters were measured 10 times under exactly the same conditions. The measured mean and standard deviation values were calculated and shown in Table VII.
FIG 11.
Micro CT system. (a) System overview; (b) Ball bearing phantom.
TABLE VII.
Micro-CT system calibration results.
| Mean | Standard deviation | Coefficient of variation | |
|---|---|---|---|
| u0(pixel) | 1014.93 | 0.02 | 0.0018% |
| υ0(pixel) | 529.7 | 0.1 | 0.0248% |
| η(°) | 0.190 | 0.009 | 4.5254% |
| RFI(mm) | 225.04 | 0.05 | 0.0209% |
| RFD(mm) | 401.52 | 0.08 | 0.0199% |
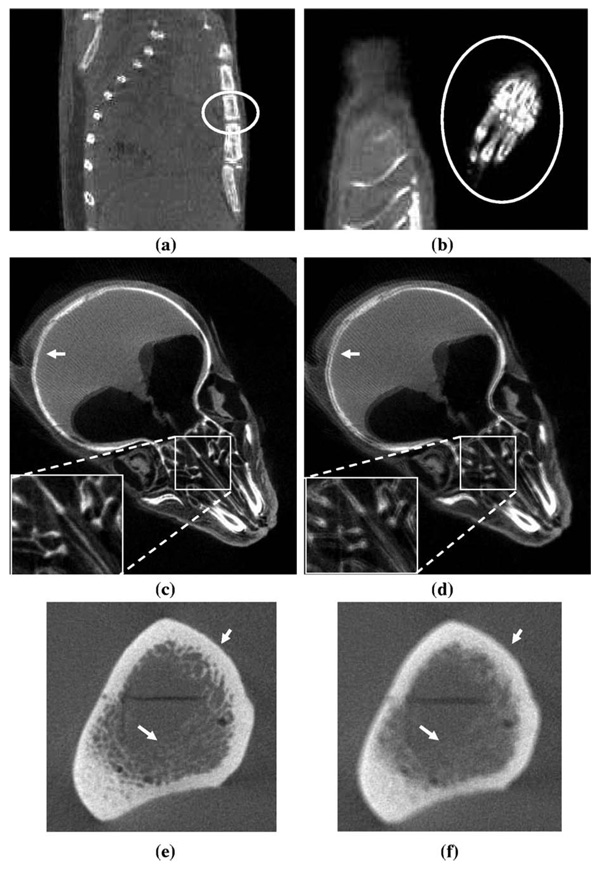
The measured results demonstrated excellent consistency of the proposed calibration method. Example CT images of a mouse reconstructed with these system parameters are shown in Figs. 12(a)–12(d). These images depict excellent detail and sharp edges of the bone structures, qualitatively illustrating the performance of the calibration method.
FIG 12.
Example CT images. (a)–(d) micro CT images, (e)–(f) bone phantom images from a breast CT scanner. (a) Sagittal view; (b) Coronal view; (c) Axial view; (d) Axial view, with u0 and v0 off by 1 pixel; (e) Axial view; (f) Axial view, with η off by 0.2°.
C. A breast CT system
In contrast to the micro CT system, in which the object rotates, a breast CT system constructed in our lab was designed such that the x-ray tube and detector rotate around the object. This system uses a 40 × 30 cm amorphous silicon detector (PaxScan 4030CB, Varian Medical Systems, Salt Lake City, UT) with 194 µm pixel size, corresponding to a 2048 × 1536 image size. In this study, the detector was working in the mode with 2 × 4 pixel binning, corresponding to a 1024 × 384 image size. A Pantak HF160 x-ray generator with a 0.4 mm focal spot x-ray tube (Comet, MXR-160/20), capable of 160 kVp and 6 mA (continuous) operation was used. The system design is shown in Fig. 13(a). A set of lead ball bearings with a diameter of 2.3 mm was mounted into a foam board to make the BB phantom. The distance between BB 1 and BB 6 was measured as: l=100.00 mm (Fig. 13(b)). Every scan was performed with 80.0 kVp, 7.0 mA, and 500 views. Ten calibration scans were acquired in a period of about 2 months with the detector normally positioned (<1° in-plane rotation), and the calibration results are shown in Table VIII. The results demonstrated excellent reproducibility of the proposed method over a relative long time period.
FIG 13.
Breast CT system. (a) System overview; (b) Ball bearing phantom.
TABLE VIII.
Breast CT system calibration results.
| Mean | Standard deviation | Coefficient of variation | |
|---|---|---|---|
| u0(pixel) | 514.0 | 0.2 | 0.0292% |
| υ0(pixel) | 53.0 | 0.3 | 0.5442% |
| η(°) | 0.22 | 0.01 | 6.5713% |
| RFI(mm) | 459.9 | 0.4 | 0.0874% |
| RFD(mm) | 860.3 | 0.7 | 0.0855% |
To test the performance of this method under a large inplane rotation angle, the detector was deliberately tilted with an in-plane rotation angle of ~7°. In this configuration, only one calibration was obtained. The system parameters were measured as: u0=383.5924 pixel, υ0=49.7066 pixel, η=7.5995°, RFI=465.1768 mm, RFD=892.1971 mm.
The R-square values for the linear fitting were 0.999 920 4 and 0.999 992 9, respectively.
CT images of a bone phantom reconstructed with these system parameters are shown in Fig. 12(e). As compared with Fig. 12(f), excellent details and sharp edges of the bone structures were demonstrated with correct system parameters. The calibration method works consistently even with a relative large detector in-plane rotation angle.
VI. DISCUSSION
In this work, a new and simple method for cone beam CT calibration was presented. The previous seven-parameter problem was simplified to a five-parameter problem. The maximal error introduced by this assumption was found to be less than 1% for typical cone beam CT systems. High resolution angle information from the rotation system, basic information for CT systems, is leveraged to achieve higher precision than with previous methods. Linear regression performance validated the accuracy and consistency of this method in the presence of noise. Only a rough measurement of the distance between two BBs was required to calculate the source to isocenter distance RFI. The error in RFI was due both from this measurement and the error in the calculation of the source to detector distance RFD. However, cone beam CT reconstruction is more dependent on the ratio of RFI to RFD than on their absolute values.2,4,9,10 Thus the accuracy in RFI is acceptable and the methodology produces reconstructed images with good spatial resolution and without major artifacts.
VII. CONCLUSIONS
From the results of computer simulation and practical system implementation in a micro-CT scanner and a breast CT scanner, equal or higher accuracy was achieved with a simpler implementation. The proposed method can be applied to any cone beam CT system with a mechanically stable rotation center and without severe detector out-of-plane rotations (<2°).
ACKNOWLEDGMENTS
This work was supported in part by National Institutes of Health Grant Nos. R21 EB04643 and R01 EB02138, and by grant from the California Breast Cancer Research Program (CA BCRP 11IB-0114).
APPENDIX A: RADIAL PAIR CALCULATION
As shown in Fig. 14, the distance between a radial pair of points on the detector plane, ρ, will be a function of θ(0° ⩽ θ ⩽ 90°). This distance does not depend on the in-plane rotation of the detector, so we can assume η=0. For a circular trajectory located at plane z=zi, with radius r, we have
| (A1) |
| (A2) |
Let
then ρ2 will be a quadratic function of x,
| (A3) |
Because 0° ⩽ θ ⩽ 90°, then
FIG 14.
Case 1: If .
, ρ2 will be a linear function of x and have its maximum value when θ=90° and minimum value when θ=0°.
Case 2: If .
will be a quadratic equation and have maximum value at,
| (A4) |
We can easily prove that if , then
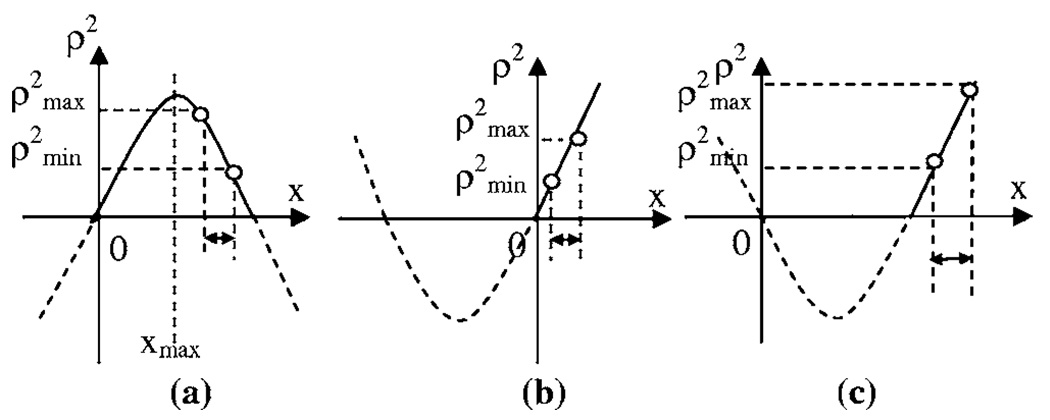
as shown in Fig. 15(a).
FIG 15.
ρ2 as a function of x in different cases.
So ρ2 will have its maximum value when θ=0° and minimum value when θ=90°.
Case 3: If .
wil1 be another quadratic equation. From Figs. 15(b) and 15(c), we can see that, in either situation, ρ2 will have its maximum value when θ=90° and minimum value when θ=0°.
In summary, we only need or (zi/RFI)2 + 2(r/RFI)2<1 to ensure that ρ (as well as ρ2) will have its maximum or minimum values when θ=90° or θ=0°. Actually if we define the maximum fan angle and cone angle as 2α and β, then
| (A5) |
If a system has a cone angle less than 30° and a fan angle less than 60°. (tan β)2+2(tan α)2<1. This limit is relatively loose for a practical system. For example, our micro-CT system has a RFI=200 mm, with a detector active area of 10 × 5 cm2 and the maximum z and r values for our BB phantom will be 50 and 50 mm (on the detector plane, will be even smaller on the iso-center), corresponding to a fan angle of 28.07° and a cone angle of 14.04°. So this limit can be easily satisfied for normal cone beam CT systems.
APPENDIX B: CALCULATION OF RFD AND V0
As shown in Fig. 16,
| (B1) |
Then
| (B2) |
So
| (B3) |
And we also have
| (B4) |
Insert these into Eq. (B3), and we have
| (B5) |
Define:
| (B6) |
Then use a linear function X=a1 + b1Y to fit all the (Yi,Xi) pairs, we can get υ0 and RFD from these two coefficients, a1 and b1, by
| (B7) |
FIG 16.
Appendix B. Calculation of υ0 and RFD.
APPENDIX C: MASS CENTER CALCULATION
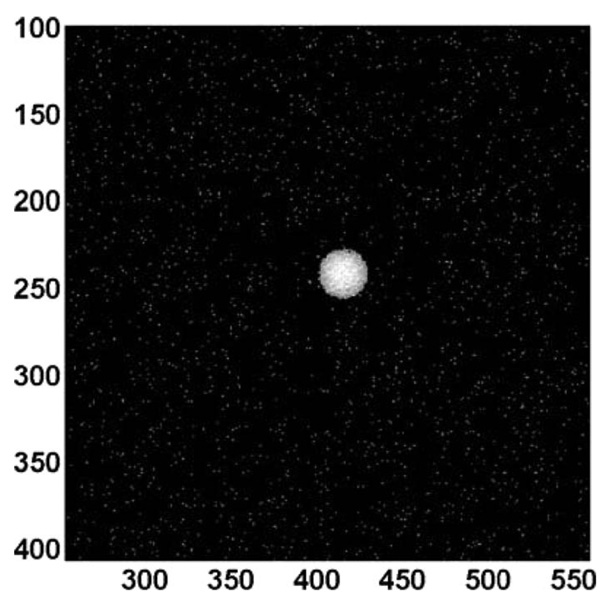
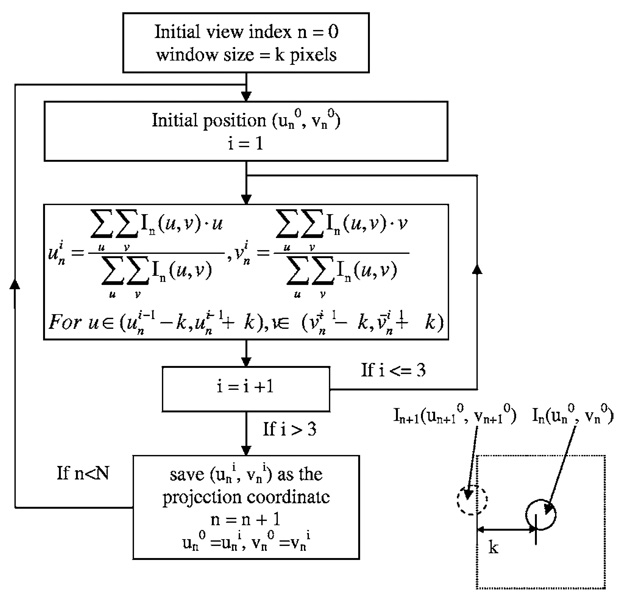
The cone beam projection image of a spherical object was simulated by analytical calculation of the attenuation of an x-ray beam. In this simulation, monoenergetic photons were emitted from an isotropic point source. Output photons were uniformly distributed in 4π space. Gaussian noise was added to the incident photons and an example of the simulated projection image is shown in Fig. 17. This image was then processed to reverse the gray scale and thresholded to reduce the interference of background noise. A initial position and a window size k were set manually from observation. Thus the mass center for individual view with index n was calculated within the window . This calculation was repeated iteratively as
| (C1) |
I(u,υ) is gray scale value of the projection image at (u,υ) after processing. Ni is the total number of iterations.
FIG 17.
Computer simulation on mass center calculation.
Once the projection center position was determined, it was used as the initial position for the next view and the same procedure was repeated for the next projection image. The complete trajectory was determined through all the views over 360°. The trajectory tracking diagram is shown in Fig. 18.
FIG 18.
Diagram of trajectory tracking. In(u,υ) is the gray scale value of position (u,υ) in view # n, after processing. N is the total number of views, k is the window size set from observation so that a 2k*2k window completely covers one BB and the adjacent BB is also located with this window.
Computer simulation was performed to validate the accuracy of the mass center calculation and determine the optimal iteration numbers. For a properly chosen window size, the results were always convergent in less than three iterations, even when the initial position was set at the edge of the x-ray shadow area.
In the computer simulation, 1 × 10⁶ photons with a noise level of 1 × 10⁴ were incident into each detector pixel. The x-ray shadow covered an area of 25 × 25 pixel2. True values of the projection center coordinates were calculated as: u0=415.7407 pixel, υ0=242.1296 pixel.
With three iterations for each simulation, a 30 × 30 window, initial position at u0=402 pixel, υ0=230 pixel, the results of 10 runs were: u0=415.75±0.05 pixel, υ0=242.12±0.03 pixel.
Simulations using different shadow areas (BB size), noise levels, and initial positions were studied and the calculated results all had an error less than 0.05 pixel from the true values.
Contributor Information
Kai Yang, Department of Radiology, University of California, Davis Medical Center, 4701 X Street, Sacramento, California 95817 and Department of Biomedical Engineering, University of California, Davis, California 95616.
Alexander L. C. Kwan, Department of Radiology, University of California, Davis Medical Center, 4701 X Street, Sacramento, California 95817
DeWitt F. Miller, Department of Radiology, University of California, Davis Medical Center, 4701 X Street, Sacramento, California 95817 and Department of Biomedical Engineering, University of California, Davis, California 95616
John M. Boone, Department of Radiology, University of California, Davis Medical Center, 4701 X Street, Sacramento, California 95817 and Department of Biomedical Engineering, University of California, Davis, California 95616.
References
- 1.Gullberg GT, Tsui BM, Crawford CR, Edgerton ER. Estimation of geometrical parameters for fan beam tomography. Phys. Med. Biol. 1987;32:1581–1594. [Google Scholar]
- 2.Gullberg GT, Tsui BM, Crawford CR, Ballard JG, Hagius JT. Estimation of geometrical parameters and collimator evaluation for cone beam tomography. Med. Phys. 1990;17:264–272. doi: 10.1118/1.596505. [DOI] [PubMed] [Google Scholar]
- 3.Hsieh J. Three-dimensional artifact induced by projection weighting and misalignment. IEEE Trans. Med. Imaging. 1999;18:364–368. doi: 10.1109/42.768846. [DOI] [PubMed] [Google Scholar]
- 4.Noo F, Clackdoyle R, Mennessier C, White TA, Roney TJ. Analytic method based on identification of ellipse parameters for scanner calibration in cone-beam tomography. Phys. Med. Biol. 2000;45:3489–3508. doi: 10.1088/0031-9155/45/11/327. [DOI] [PubMed] [Google Scholar]
- 5.Karolczak M, Schaller S, Engelke K, Lutz A, Taubenreuther U, Wiesent K, Kalender W. Implementation of a cone-beam reconstruction algorithm for the single-circle source orbit with embedded misalignment correction using homogeneous coordinates. Med. Phys. 2001;28:2050–2069. doi: 10.1118/1.1406514. [DOI] [PubMed] [Google Scholar]
- 6.Stevens GM, Saunders R, Pelc NJ. Alignment of a volumetric tomography system. Med. Phys. 2001;28:1472–1481. doi: 10.1118/1.1382609. [DOI] [PubMed] [Google Scholar]
- 7.von Smekal L, Kachelriess M, Stepina E, Kalender WA. Geometric misalignment and calibration in cone-beam tomography. Med. Phys. 2004;31:3242–3266. doi: 10.1118/1.1803792. [DOI] [PubMed] [Google Scholar]
- 8.Cho Y, Moseley DJ, Siewerdsen JH, Jaffray DA. Accurate technique for complete geometric calibration of cone-beam computed tomography systems. Med. Phys. 2005;32:968–983. doi: 10.1118/1.1869652. [DOI] [PubMed] [Google Scholar]
- 9.Feldkamp LA, Davis LC, Kress JW. Practical cone-beam algorithm. J. Opt. Soc. Am. A. 1984;1:612–619. [Google Scholar]
- 10.Kak AC, Slaney M. Principles of Computerized Tomographic Imaging. Philadelphia: SIAM; 1988. [Google Scholar]


