

Abstract
Maintenance of apico-basal polarity in normal breast epithelial acini requires a balance between cell proliferation, cell death, and proper cell-cell and cell-extracellular matrix signaling. Aberrations in any of these processes can disrupt tissue architecture and initiate tumor formation. Here, we show that the small GTPase Rap1 is a crucial element in organizing acinar structure and inducing lumen formation. Rap1 activity in malignant HMT-3522 T4-2 cells is appreciably higher than in S1 cells, their nonmalignant counterparts. Expression of dominant-negative Rap1 resulted in phenotypic reversion of T4-2 cells, led to the formation of acinar structures with correct polarity, and dramatically reduced tumor incidence despite the persistence of genomic abnormalities and baseline growth. The resulting acini contained prominent central lumina not observed when other reverting agents were used. Conversely, expression of dominant-active Rap1 in T4-2 cells inhibited phenotypic reversion and led to increased invasiveness and tumorigenicity. Thus, Rap1 acts as a central regulator of breast architecture, with normal levels of activation instructing polarity during acinar morphogenesis, and increased activation inducing tumor formation and progression to malignancy.
Introduction
Rap1, a member of the Ras family of small GTPases, is activated in response to a number of extracellular stimuli, including growth factors, cytokines, and cell-cell and cell-extracellular matrix (ECM) adhesion (1, 2). Activation of Rap1 is mediated by specific guanine nucleotide exchange factors (GEF) and disrupted by GTPase activating proteins (GAP). Active GTP-bound Rap1 functions through its many effectors, including the Rho GTPase Rac1 (3, 4), to regulate inside-out signaling of integrins (5, 6) and cadherins (7, 8) and to control cytoskeletal structure (9), endothelial cell polarity (10, 11), and differentiation (8, 12). Despite its original discovery as an inhibitor of Ras-mediated transformation (13), Rap1 and its GEFs and GAPs are dysregulated in a variety of cancers (14–18). Deregulating Rap1 activity by knocking out its GAP Spa1 in mice leads to the development of myeloproliferative disorders mimicking human chronic myeloid leukemia (19), and overexpression of Rap1 induces oncogenic transformation in cultured fibroblasts (20). Additionally, the E6 protein of human papillomavirus transforms cells in part by degrading the Rap1-GAP E6TP1 (21, 22). Because it both responds to and regulates cell-cell and cell-ECM adhesion, Rap1 is emerging as a key regulator of morphogenesis (23, 24).
During normal development, integration of signals from the microenvironment leads to establishment of tissue structure and apico-basal polarity (25, 26). Losses of normal tissue structure and polarity are hallmarks of tumor progression (26, 27). To delineate the mechanisms regulating tissue polarity and its loss in breast cancer, we have used an assay in which normal and malignant human breast epithelial cells are cultured within a physiologically relevant three-dimensional laminin-rich ECM (lrECM). Phenotypically normal nonmalignant S1 cells from the HMT-3522 tumor progression series form polarized and growth-arrested acini when cultured in three-dimensional lrECM, resembling the structures formed by primary breast epithelial cells (28). In contrast, tumorigenic T4-2 cells form highly proliferative disorganized apolar structures reminiscent of malignant tumors in vivo. Expression levels of epidermal growth factor receptor (EGFR), β1-integrin, and their downstream effectors, including mitogen-activated protein kinase (MAPK) and phosphoinositide-3-kinase (PI3K), are increased in T4-2 compared with S1 cells, and down-regulation of any of these signaling pathways in T4-2 cells cultured in three-dimensional lrECM leads to growth arrest and reversion to a phenotype resembling normal polarized acini in vivo (29–31).
In the three-dimensional assay, proliferation and tissue polarity appear phenotypically coupled, yet they are controlled by distinct signaling pathways, with high levels of Akt and Rac1 correlating with the loss of growth control and tissue polarity, respectively, with down-modulation of Rac1 activity being necessary for restoration of basal polarity (31). However, whereas apical polarity is partially restored, the acini fail to form lumina. Because Rap1 is an upstream activator of Rac1 (3, 4) and regulates a number of interacting pathways (23, 24), we measured Rap1 activity and found that it was much higher in malignant cells. We hypothesized that Rap1 activation may play a role in the loss of polarity and lumen formation during tumor progression. Here, we show that this is indeed the case, and that exogenous expression of dominant-active Rap1 in T4-2 cells cultured in three-dimensional lrECM interferes with reversion of tissue structure and establishment of tissue polarity. We show also that a lower level of Rap1 activity is required for lumen formation in nonmalignant breast acini. Surprisingly, decreasing Rap1 activity had only a nominal effect on cell proliferation, although PI3K signaling through Akt and phosphatase and tensin homologue (PTEN) was normalized. These data underscore that Rap1 functions as an organizer of breast acinar polarity and show that its dysregulation causes the destruction of tissue architecture and leads to tumor progression.
Materials and Methods
Reagents and antibodies
Growth factor–reduced Matrigel (BD Biosciences) was used for three-dimensional lrECM assays. Rat tail collagen I (Vitrogen 100, Celtrix Laboratories) was used to thinly coat the surfaces of culture dishes as described (29). Inhibitors and antibodies used for reversion assays were as follows: EGFR inhibitor tyrphostin AG1478 (Calbiochem), mitogen-activated protein (MAP)/extracellular signal-regulated kinase kinase (MEK) inhibitor PD98059 (Calbiochem), PI3K inhibitor LY294002 (Cell Signaling Technology), human EGFR function-blocking antibody mAb225 (Oncogene Research). Antibodies used for biochemical analyses and immunostaining were as follows: total and phospho-Erk1/2 (Thr202/Tyr204), total and phopho-p38 MAPK (Thr180/Tyr182), total and phospho-Akt (Ser473), total and phospho-p90RSK (Ser380), total and phospho-GSK3β (Ser9), cleaved caspase-3 (Asp175), PTEN, and FOXO1 from Cell Signaling Technology; β1-integrin, GM130, and total and phospho-EGFR from BD Transduction; α6-integrin from Chemicon; β-catenin and Rap1 from Santa Cruz Biotechnology; Bim from Calbiochem; Ki67 from Zymed; β-actin from Sigma; and rhodamine-phalloidin from Molecular Probes.
Cell culture
HMT-3522 human mammary epithelial cells were maintained as described previously (29). Three-dimensional cultures on top of lrECM were prepared by growing cells as monolayers, followed by trypsinization and plating (3 × 10⁵ cells/mL) on polymerized lrECM. Culture medium containing 5% lrECM was added and replaced every 2 days. For reversion assays, antibodies and inhibitors were added to the culture medium. At days 3, 5, and 8 of culture, colony size and Ki67 indices were measured. Colonies that contained Ki67-positive cells were scored as positive.
Plasmid constructs and transfections
The cDNAs encoding human Rap1V12 (dominant-active) and Rap1N17 (dominant-negative) were PCR amplified using pcDNA-Rap1V12 and pcDNA-Rap1N17 (gift of Dr. T. Kinashi, Kansai Medical School, Osaka, Japan) as templates, respectively. Amplified fragments were digested with EcoRI and EcoRV and subcloned into pEYFP-C1 (BD Biosciences). HMT-3522 mammary epithelial cells were transfected with pEYFP-Rap1V12, pEYFP-Rap1N17, or pEYFP-C1 using LipofectAMINE 2000 (Invitrogen). Stably transfected cells were selected with 100 μg/mL G418, and positive populations were enriched by EPICS Cell Sorting System (Beckman Coulter).
Immunoblotting and immunostaining
Cells cultured in three-dimensional lrECM were first isolated as colonies in ice-cold PBS containing 5 mmol/L EDTA as previously described (29) and lysed in radioimmunoprecipitation assay buffer [1% Nonidet P-40, 0.5% deoxycholate, 0.2% SDS, 150 mmol/L sodium chloride, and 50 mmol/L Tris-HCl (pH 7.4) containing protease inhibitor cocktail (Calbiochem)]. Equal amounts of protein lysates were analyzed by SDS-PAGE and transferred to nitrocellulose membrane. Membranes were blocked with TBS containing 3% skim milk or 5% bovine serum albumin (BSA) and incubated with primary antibodies (1:1,000 dilution), followed by incubation with horseradish peroxidase–labeled secondary antibodies (1:1,000 dilution). Positive bands were detected with SuperSignal West Dura (Pierce). For immunostaining of three-dimensional lrECM-cultured samples, cells were incubated with 18% sucrose in PBS for 15 min and then with 30% sucrose in PBS for 15 min. Cells were smeared on frosted glass slides and air-dried briefly for further processing. After fixation with 3% formaldehyde in PBS for 15 min or methanol/acetone (1:1) for 10 min, cells were permeabilized with 0.3% Triton X-100 in PBS, washed twice with PBS, and blocked with 1% BSA in PBS. Samples were incubated with primary antibody diluted 1:100 to 1:300 in blocking buffer for 1 h at room temperature, followed by incubating with FITC- or Cy3-conjugated secondary antibody. Nuclei were counterstained with 4′,6-diamidino-2-phenylindole (Sigma), and actin filaments were stained with rhodamine phalloidin. Samples were mounted with Prolong antifade reagent (Molecular Probes) and observed with Nikon DIAPHOT 300 or Zeiss LSM 410 confocal microscope. Images were pseudocolored and resized using Adobe Photoshop.
Pull-down assays
Rap1 activity was measured using Rap1 Assay Reagent (Upstate). Cells were lysed in TLB [50 mmol/L Tris-HCl (pH 7.4), 500 mmol/L NaCl, 1% NP40, 2.5 mmol/L MgCl2, and 10% glycerol] at 4°C for 30 min. Lysates were cleared by centrifugation at 15,000 × g at 4°C for 15 min. Supernatants were incubated with 30 μg of RalGDS-RBD fusion protein coupled with agarose beads for 1 h at 4°C. Beads were washed thrice in TLB and resuspended in Laemmli buffer. Samples were analyzed by SDS-PAGE, followed by transfer to nitrocellulose membranes, and immunoblotting using an anti-Rap1 antibody.
Invasion assay
The migration and invasion capacity of cells were evaluated in 24-well chambers with filter inserts (8-μm pores) or filter inserts coated with 30 μL of Matrigel protein at 6–8 mg/mL, respectively. Approximately 1 × 10⁵ cells were plated into the upper chamber in 300 μL of culture medium. The lower chamber was filled with 350 μL of medium containing 5% fetal bovine serum. After culture for 48 h, cells were fixed with 5% glutaraldehyde in PBS and stained with 0.5% toluidine blue (Sigma) in 2% Na2CO3. Cells on the upper side of the filter were removed with a cotton swab, and cells on the lower side of the filter were visualized and counted. Each experiment was repeated four times in duplicate; one representative experiment is shown.
Tumor formation in vivo
Tumor formation ability in vivo was examined by injecting 1 × 10⁷ cells s.c. into the rear flanks of BALB/c female athymic nude mice (Simonsen Laboratories) at 7 weeks of age. Tumors were measured weekly for 4–10 weeks, and tumor size was recorded at the time of sacrifice. Tissue from injection sites was embedded in paraffin, sectioned, and stained with H&E for histology.
Results
Lumen formation and acinar polarity are disrupted by Rap1 activation
We had found previously that malignant T4-2 cells (which form disorganized and apolar colonies when grown in three-dimensional lrECM; Fig. 1A) showed appreciably higher levels of Rac1 activity relative to their nonmalignant S1 counterparts, and that down-modulation of Rac1 caused T4-2 cells to form polarized acinar structures without lumina (31). Because Rac1 functions downstream of Rap1 (3, 4), we examined Rap1 activity in S1 and T4-2 cells using pull-down assays (32). Whereas the total level of Rap1 was similar in these two cell lines, the level of active GTP-bound Rap1 was appreciably higher in T4-2 than in S1 cells when cultured in three-dimensional lrECM (Fig. 1A). As shown previously for a number of other signaling molecules in our system (reviewed in ref. 26), this difference was observed only in three-dimensional cultures and not in cells grown on tissue culture plastic, underscoring the importance of tissue context in the regulation of signaling pathways.
Figure 1.
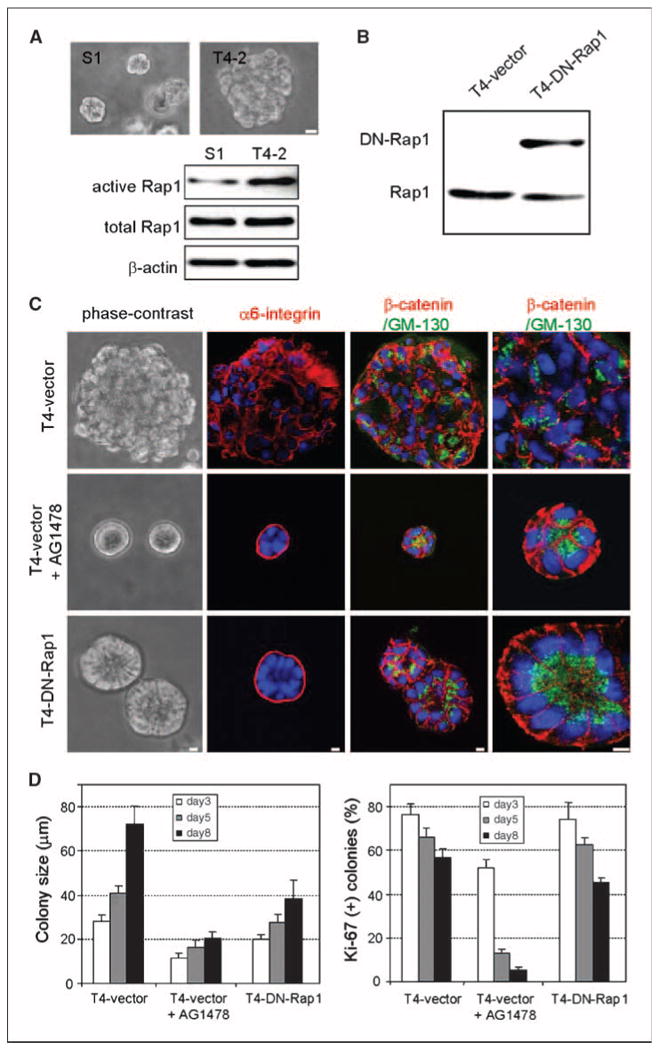
Down-modulation of Rap1 activity in malignant T4-2 cells restores tissue polarity in three-dimensional lrECM culture. A, phase-contrast images and Rap1 expression and activity levels in S1 and T4-2 cells cultured in three-dimensional lrECM. Bar, 10 μm. B, Western blot of endogenous Rap1 and exogenous DN-Rap1 in T4-vector and T4-DN-Rap1 cells. C, morphologies of T4-vector treated with and without AG1478 and T4-DN-Rap1 colonies in three-dimensional lrECM. Cell polarity was examined by staining markers for basal (α6-integrin), basolateral (β-catenin), and apical (GM130) membrane domains. Bar, 5 μm. D, cell proliferation in three-dimensional lrECM was determined by measuring colony size (left) and Ki-67–positive colonies (right). Columns, averages across three independent experiments; bars, SD. *, P < 0.05.
Normalizing Rap1 activity restores tissue polarity and induces lumen formation
We asked whether down-modulating Rap1 could restore normal tissue architecture in malignant T4-2 cells. We established stable T4-2 transfectants that exogenously expressed dominant-negative Rap1 (T4-DN-Rap1) or vector only (T4-vector) as a control (Fig. 1B). T4-vector cells cultured in three-dimensional lrECM behaved in a manner similar to untransfected cells, forming large disorganized colonies that could be induced to undergo phenotypic reversion with the EGFR inhibitor, AG1478 (Fig. 1C). In sharp contrast, T4-DN-Rap1 cells had a markedly different morphology in three-dimensional lrECM and formed organized acinar structures similar to, albeit with larger lumina than, nonmalignant S1 cells in the absence of other reverting agents (Fig. 1C). Indirect immunofluorescence of T4-DN-Rap1 and AG1478-treated acini showed correct localization of the basal marker α6-integrin, the basolateral marker β-catenin, and the apical marker GM130. In T4-vector colonies, α6-integrin, β-catenin, and GM130 were all randomly distributed, confirming that polarity was impaired. Therefore, down-modulating Rap1 was sufficient to induce polarized acinar architecture in T4-2 cells in three-dimensional lrECM.
Despite the fact that down-modulating either EGFR or Rap1 could phenotypically revert the malignant phenotype, we observed distinct differences between the resulting reverted acini. At each day of culture, T4-DN-Rap1 acini were twice as large as AG1478-treated T4-vector acini (Fig. 1D). Whereas inhibition of EGFR led to growth arrest by day 5, T4-DN-Rap1 cells continued to proliferate as assessed by a high percentage (∼45%) of Ki67-positive acini remaining at day 8 of culture (Fig. 1D). The architectural differences between AG1478-treated vector acini and T4-DN-Rap1 acini became more evident by day 15, at which time there were prominent lumina in >60% of T4-DN-Rap1 acini but in fewer than 2% of AG1478-treated vector acini (Fig. 2A). Establishment of apical polarity involves the creation of apical membrane domains associated with the presence of filamentous actin (33, 34). We detected apically localized actin in T4-DN-Rap1 acini but not in AG1478-treated T4-vector acini (Fig. 2A), suggesting that DN-Rap1 leads to the development of both apical and basal polarity in three-dimensional lrECM.
Figure 2.
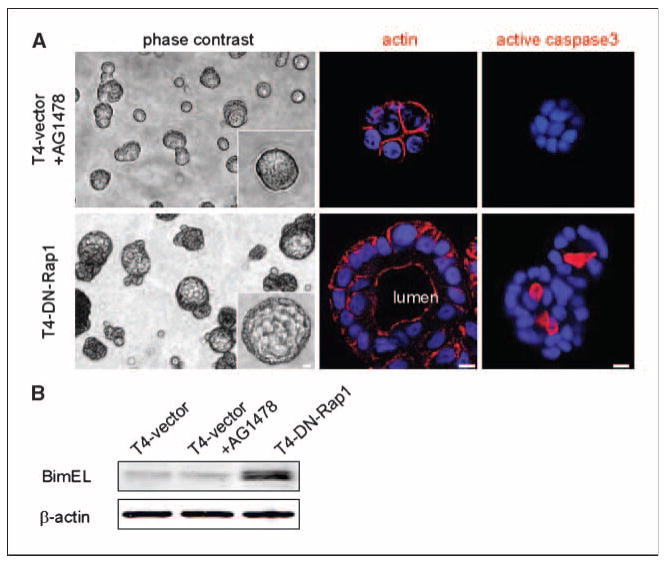
Bim-mediated lumina are formed in T4-DN-Rap1 cells but not in AG1478-treated T4-2 cells. A, phase-contrast images after 15 d of culture in three-dimensional lrECM, showing prominent lumina in acini of T4-DN-Rap1, but not in those of AG1478-treated T4-vector cells. The localization of actin filaments in apical membrane domains confirmed lumen formation and establishment of apical polarity in T4-DN-Rap1 acini. Apoptotic cell death was examined by staining for active caspase-3 at day 10 of culture. B, expression level of Bim in T4-vector, AG1478-treated T4-vector, and T4-DN-Rap1 cells at day 10 of culture in three-dimensional lrECM. Bar, 5 μm.
Lumen formation is accompanied by apoptotic cell death within acinar structures (35–37). Bim, a proapoptotic BH3-only Bcl-2 family protein, was identified as having a role in this process (38). We examined apoptotic cell death in situ by indirect immunofluorescence for activated caspase-3; as expected (39), apoptosis was restricted to those cells not in contact with basement membrane within T4-DN-Rap1 acini (Fig. 2A). Furthermore, Western blotting of lysates showed that Bim was up-regulated at day 10 of culture in T4-DN-Rap1 acini (Fig. 2B). In contrast, we detected neither activated caspase-3 nor up-regulation of Bim in AG1478-treated T4-vector acini. Thus, normalization of Rap1 activity caused reversion of T4-2 cells with a resulting architecture comparable to that of another nonmalignant mammary epithelial cell line, MCF-10A, which forms lumina in three-dimensional lrECM but also forms larger acini than S1, T4-2 reverted by other signaling agents, or primary epithelial cells (28). These results suggest that formation of organized acinar structure by expressing DN-Rap1 in malignant T4-2 cells is achieved by increased apoptotic signaling within the center of the colonies coupled to continuous growth.
Dominant-active Rap1 desensitizes T4-2 cells to reversion by treatment with EGFR inhibitors
Whereas expression of DN-Rap1 reverted cells to a normal tissue polarity when cultured in three-dimensional lrECM, stable T4-2 transfectants that exogenously expressed dominant-active Rap1 (T4-DA-Rap1) formed disorganized clusters indistinguishable from controls (compare Fig. 1A with Fig. 3A). However, in the presence of AG1478, T4-DA-Rap1 cells failed to revert, forming large colonies with improperly localized α6-integrin (Fig. 3A). Reverting T4-vector cells by treatment with AG1478 resulted in the down-regulation of both EGFR and β1-integrin, as reported previously for wild-type T4-2 cells (30). However, expression of these molecules was unaffected in AG1478-treated T4-DA-Rap1 cells (Fig. 3B). DA-Rap1 likewise blocked the restoration of basal tissue polarity by treatment with standard inhibitory concentrations of the function-blocking EGFR antibody mAb225 (2 μg/mL; Fig. 3C) or the MAPK pathway inhibitor PD98059 (10 μmol/L; Fig. 3C). To determine if the resistance to inhibitors of the EGFR pathway was dose dependent or absolute, we applied higher doses of AG1478, mAb225, or PD98059 and found that a 3- to 4-fold higher concentration of each antagonist was required to revert T4-DA-Rap1 cells than to revert the controls (Fig. 3C). In contrast, T4-DA-Rap1 cells were reverted successfully by standard treatment with the PI3K inhibitor LY294002 (Fig. 3C). These data suggest that expression of DA-Rap1 prevents T4-2 cells from sensing the three-dimensional lrECM microenvironment and results in an uncoupling of EGFR and β1-integrin signaling pathways analogous to the effects of growing T4-2 cells on tissue culture plastic (30).
Figure 3.
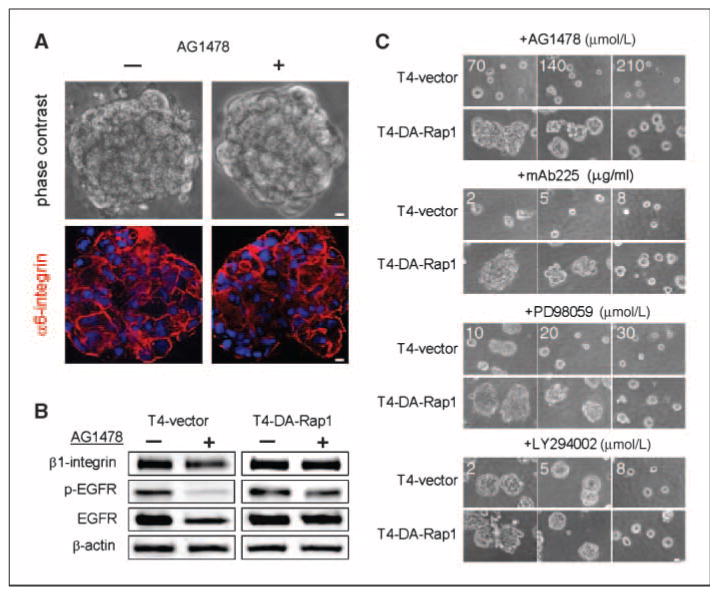
T4-DA-Rap1 cells show dose-dependent resistance to reversion by inhibitors of EGFR and MAPK. A, phase-contrast images and immunofluorescence localization of α6-integrin in T4-DA-Rap1 cells with or without 70 nmol/L AG1478 in three-dimensional lrECM. B, levels of β1-integrin, EGFR, and phospho-EGFR in three-dimensional lrECM–cultured T4-vector cells, and T4-DA-Rap1 cells in the presence and absence of 70 nmol/L AG1478. C, dose-dependent effect of reverting agents on T4-DA-Rap1 cells in three-dimensional lrECM. Cells were treated with different doses of inhibitors against EGFR (AG1478 and mAb225), MEK (PD98059), or PI3K (LY294002). Bar, 5 μm.
Rap1 activity affects invasive phenotype and tumorigenesis of malignant T4-2 cells
To explore whether these findings had relevance to tumor formation in vivo, we investigated two aspects of malignant behavior: invasion in Matrigel-coated transwell chambers and frequency of tumor formation. We found that invasiveness correlated with Rap1 activity: invasion of T4-DN-Rap1 and T4-DA-Rap1 cells were 50% and 400% that of controls, respectively (Fig. 4A). To determine the effect of Rap1 on the tumorigenic potential of T4-2 cells, xenograft tumors were formed by injecting T4-vector, T4-DN-Rap1, and T4-DA-Rap1 cells s.c. into athymic nude mice. Tumor growth correlated with Rap1 activity: the percentage of mice bearing large (>10 mm3) tumors was enhanced by DA-Rap1 and abrogated by DN-Rap1 (Fig. 4B). Pathologic examination revealed that tumors derived from T4-DA-Rap1 cells were of a higher grade of malignancy than controls. At week 10 after injection, the tumors formed by control T4-vector cells were no longer proliferative, as determined by the absence of Ki67-positive cells (0.4 ± 0.2%), whereas T4-DA-Rap1 cells were still dividing (17.6 ± 0.5%). T4-DA-Rap1 tumors also had a lower level of apoptotic cell death, as determined by staining for active caspase-3 (1.2 ± 0.4%), than T4-vector tumors (22.3 ± 2.1%). In addition, blood vessel infiltration was frequently observed in xenografts derived from T4-DA-Rap1 cells (Fig. 4C).
Figure 4.
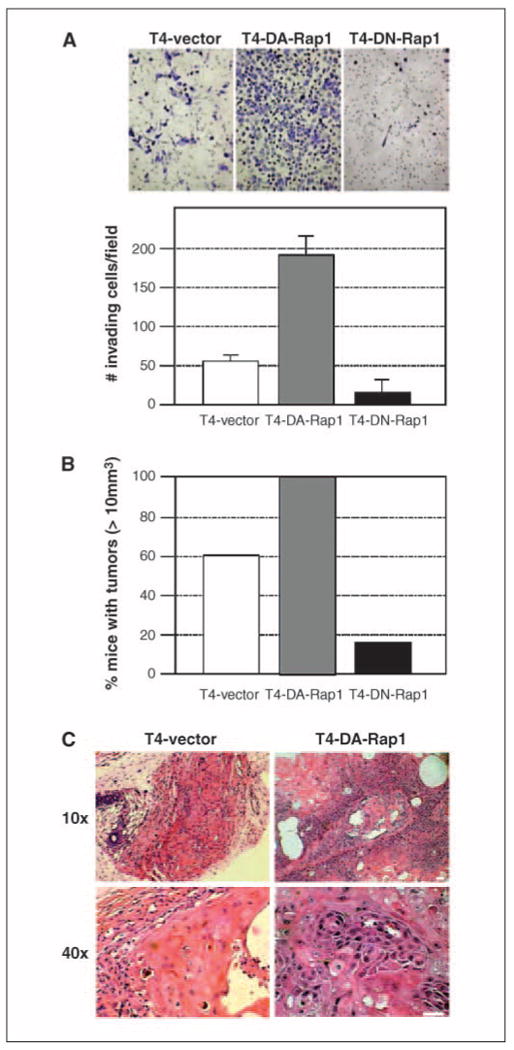
Level of Rap1 activity affects invasiveness and tumorigenic potential of T4-2 cells. A, invasiveness of T4-vector, T4-DA-Rap1, and T4-DN-Rap1 cells was examined using Matrigel-coated transwell filters. Quantification at 48 h after plating. B, the transfectants were s.c. injected into nude mice to examine tumorigenic potential. Tumor size measured at 8 wks after injection and mice bearing tumors larger than 10 mm3 were scored. C, histology of tumors derived from T4-vector and T4-DA-Rap1 cells.
MAPK and PI3K signaling are modulated by Rap1
To dissect the molecular mediators of Rap1 signaling in three-dimensional lrECM, we examined the expression and phosphorylation levels of downstream signaling molecules. Although T4-DA-Rap1 cells were resistant to reversion by AG1478 and T4-DN-Rap1 cells adopted normal tissue structure and polarity in the absence of EGFR inhibitors, we could detect no differences in the levels of active or total EGFR under these two conditions (Fig. 5A). This is in contrast to cells reverted by antagonists of EGFR, PI3K, or β1-integrin (29–31). However, Erk1/2 and its target molecule p90RSK were more highly phosphorylated in T4-DA-Rap1 than in T4-DN-Rap1 cells or in T4-2 controls, consistent with studies reporting the activation of Erk1/2 by Rap1 (12, 18) and consistent with our inability to revert T4-DA-Rap1 using standard concentrations of MEK inhibitor (Fig. 4C). Another MAPK family protein, p38, which was shown to be activated by Rap1 in neuronal cells (40), was unaffected in T4-2 cells, suggesting that Rap1 acts downstream of EGFR and upstream of Erk1/2 specifically in breast cells.
Figure 5.
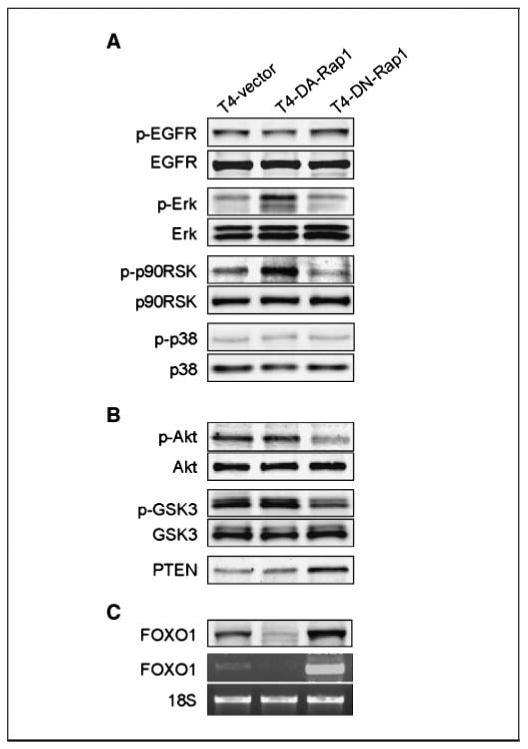
Rap1 reverts the T4-2 malignant phenotype through different signaling pathways from those targeted by EGFR or β1-integrin. Activity and expression of the components of (A) EGFR-MAPK and (B) PTEN/Akt pathways were examined by Western blotting. C, the levels of FOXO1 protein and mRNA were determined by Western and reverse transcription-PCR analyses, respectively.
To delineate the connection between Rap1 and apoptotic mechanisms carving the lumen, we measured the level of phosphorylated Akt, which plays a central role in activating survival signals and suppressing death signals (41). We found that its level was greatly decreased in T4-DN-Rap1 cells (Fig. 5B). Phosphorylation of GSK3β, a target of Akt, was similarly down-regulated, whereas the PI3K antagonist PTEN was up-regulated, indicating that PI3K signaling through Akt was decreased by expression of DN-Rap1. We did not detect significant differences in the expression of phospho-Akt, phospho-GSK3β, or PTEN in T4-DA-Rap1 cells compared with controls. However, this is not surprising because we were able to revert them with equal doses of the PI3K inhibitor LY294002. We found that expression of the proapoptotic factor FOXO1 was reduced in T4-DA-Rap1 and increased in T4-DN-Rap1 cells at both the mRNA and protein levels (Fig. 5C), providing further evidence that cell death pathways were affected by Rap1 activity in this system and implicating FOXO1 for the first time in lumen formation in mammary epithelial cells. Thus, up-regulated activity of Rap1, as is found in tumorigenic T4-2 cells, uncouples normal microenvironmental cues from apoptotic signaling, thereby inhibiting establishment of tissue polarity, lumen formation, and acinar morphogenesis.
Discussion
The functional unit of the mammary gland is the acinus, the establishment and maintenance of which depend on the integration of cues from the surrounding microenvironment (42). A defining feature of the acinus is that its constituent cells are polarized, with distinct basolateral and apical membrane domains surrounding a central lumen, which is required for secretion and storage of milk during lactation. One of the early events in breast cancer progression (43) is the loss of the cues that maintain the lumen (27, 35, 36, 38, 44), i.e., aberrations in both apoptosis and autophagy. Here, we identify Rap1 as a central modulator of lumen formation in breast epithelial cells, functioning upstream of the previously identified regulator, Bim, as well as several other proapoptotic molecules, including PTEN and FOXO-1. The level of Rap1 activity correlates with the architecture of the acinus: if the level is appropriate, acini are formed; if it is too high, apoptosis is impaired, cells lose polarity and become motile, and acini are filled.
Inhibiting Rap1 activity restored tissue polarity and reduced tumorigenicity of T4-2 cells, and high levels of Rap1 activity rendered cells resistant to reverting agents and resulted in the formation of high-grade tumors. These data underscore the notion that tissue polarity and malignancy are inversely related (42), but that tissue polarity and growth suppression are regulated by distinct pathways: here, cells expressing DN-Rap1 formed correctly polarized acini, yet continued to proliferate more than their vector-transfected AG1478-reverted counterparts, and xenografts derived from these cells essentially failed to generate tumors. These data, and our previously published work delineating the roles of Akt and Rac1 in the proliferation and polarity downstream of PI3K (31), suggest that reversion of the malignant phenotype need not necessarily target deregulated proliferation if the treatment restores tissue architecture. Moreover, a polarized epithelial architecture has a protective effect, preventing malignancy even in cells with underlying genomic abnormalities (45–47). Intriguingly, down-modulating Rap1 activity also down-modulated Akt signaling, as evaluated by levels of phospho-Akt, phospho-GSK3β, and PTEN (Fig. 5B), but had no effect on cell proliferation. These data are in contrast to reversion by treatment with the PI3K inhibitor LY294002, which also down-modulates signaling through both Akt and Rac1, but which leads to restoration of basal tissue polarity accompanied by growth inhibition (31). One obvious difference between these two treatments is that PI3K inhibition leads to feedback modulation on both EGFR and β1-integrin levels (31, 48), whereas DN-Rap1 does not, suggesting either that PI3K and Rap1 are parallel pathways downstream of EGFR, or that Rap1 is activated independently of EGFR in tumorigenic T4-2 cells. In fact, treatment with the EGFR inhibitor AG1478 has no appreciable effect on Rap1 activity in T4-2 cells (data not shown), giving credence to the latter possibility.
The data demonstrating that dysregulation of Rap1 correlates with destruction of tissue architecture and increased grade of malignancy are supported by several other studies showing a role for Rap1 in tumor progression (14, 15, 17, 19, 49). In the case of T4-2 cells, active Rap1 down-modulates proapoptotic pathways and up-regulates MEK. T4-DA-Rap1 cells have a molecular signature that suggests a more aggressive malignant phenotype compared with vector controls. That T4-DA-Rap1 cells formed larger and more aggressive tumors suggests that hyperactivation of Rap1 either directly or indirectly stimulates the production of cytokines or proangiogenic molecules. Indeed, activation of Rap1 was previously found to stimulate production of vascular endothelial growth factor (VEGF) by transformed prostate cells (50), and T4-DA-Rap1 cells show enhanced expression of VEGF by cDNA microarray analysis (data not shown).
The integration of signals from cell-cell and cell-ECM adhesions is crucial for organizing acinar architecture and maintaining mammary tissue homeostasis. Decreased β1-integrin signaling and lack of ECM contact induce apoptosis of mammary epithelial cells, resulting in the induction of acinar morphogenesis and lumen formation (36, 39); these signals are aberrant in tumorigenic cells such as T4-2. Bringing Rap1 signaling in line with that of nonmalignant cells appears to redress the balance of these elements, organizes acinar architecture, and suppresses the malignant phenotype.
Acknowledgments
Grant support: Office of Biological and Environmental Research of the Department of Energy (DE-AC03-76SF00098 and a Distinguished Fellow Award to M.J. Bissell), the National Cancer Institute (CA64786 to M.J. Bissell), and the Breast Cancer Research Program of the Department of Defense (Innovator Award DAMD17-02-1-438 to M.J. Bissell; IDEA Award DAMD17-03-1-0742 to M. Itoh; postdoctoral fellowship W81XWH-04-1-0582 to C.M. Nelson). C.M. Nelson holds a Career Award at the Scientific Interface from the Burroughs Wellcome Fund. The authors dedicate this paper to the memory of Professor Tsukita.
We thank Tatsuo Kinashi for kindly providing materials and Melissa Adriance and other members of the Bissell laboratory for helpful discussions.
References
- 1.Bos JL. Linking Rap to cell adhesion. Curr Opin Cell Biol. 2005;17:123–8. doi: 10.1016/j.ceb.2005.02.009. [DOI] [PubMed] [Google Scholar]
- 2.Stork PJ. Does Rap1 deserve a bad Rap? Trends Biochem Sci. 2003;28:267–75. doi: 10.1016/S0968-0004(03)00087-2. [DOI] [PubMed] [Google Scholar]
- 3.Arthur WT, Quilliam LA, Cooper JA. Rap1 promotes cell spreading by localizing Rac guanine nucleotide exchange factors. J Cell Biol. 2004;167:111–22. doi: 10.1083/jcb.200404068. [DOI] [PMC free article] [PubMed] [Google Scholar]
- 4.Fukuyama T, Ogita H, Kawakatsu T, Inagaki M, Takai Y. Activation of Rac by cadherin through the c-Src-Rap1-phosphatidylinositol 3-kinase-Vav2 pathway. Oncogene. 2006;25:8–19. doi: 10.1038/sj.onc.1209010. [DOI] [PubMed] [Google Scholar]
- 5.Sebzda E, Bracke M, Tugal T, Hogg N, Cantrell DA. Rap1A positively regulates T cells via integrin activation rather than inhibiting lymphocyte signaling. Nat Immunol. 2002;3:251–8. doi: 10.1038/ni765. [DOI] [PubMed] [Google Scholar]
- 6.Reedquist KA, Ross E, Koop EA, et al. The small GTPase, Rap1, mediates CD31-induced integrin adhesion. J Cell Biol. 2000;148:1151–8. doi: 10.1083/jcb.148.6.1151. [DOI] [PMC free article] [PubMed] [Google Scholar]
- 7.Hogan C, Serpente N, Cogram P, et al. Rap1 regulates the formation of E-cadherin–based cell-cell contacts. Mol Cell Biol. 2004;24:6690–700. doi: 10.1128/MCB.24.15.6690-6700.2004. [DOI] [PMC free article] [PubMed] [Google Scholar]
- 8.Wang H, Singh SR, Zheng Z, et al. Rap-GEF signaling controls stem cell anchoring to their niche through regulating DE-cadherin–mediated cell adhesion in the Drosophila testis. Dev Cell. 2006;10:117–26. doi: 10.1016/j.devcel.2005.11.004. [DOI] [PubMed] [Google Scholar]
- 9.Bertoni A, Tadokoro S, Eto K, et al. Relationships between Rap1b, affinity modulation of integrin α IIbβ 3, and the actin cytoskeleton. J Biol Chem. 2002;277:25715–21. doi: 10.1074/jbc.M202791200. [DOI] [PubMed] [Google Scholar]
- 10.Knox AL, Brown NH. Rap1 GTPase regulation of adherens junction positioning and cell adhesion. Science. 2002;295:1285–8. doi: 10.1126/science.1067549. [DOI] [PubMed] [Google Scholar]
- 11.Shimonaka M, Katagiri K, Nakayama T, et al. Rap1 translates chemokine signals to integrin activation, cell polarization, and motility across vascular endothelium under flow. J Cell Biol. 2003;161:417–27. doi: 10.1083/jcb.200301133. [DOI] [PMC free article] [PubMed] [Google Scholar]
- 12.York RD, Yao H, Dillon T, et al. Rap1 mediates sustained MAP kinase activation induced by nerve growth factor. Nature. 1998;392:622–6. doi: 10.1038/33451. [DOI] [PubMed] [Google Scholar]
- 13.Kitayama H, Sugimoto Y, Matsuzaki T, Ikawa Y, Noda M. A ras-related gene with transformation suppressor activity. Cell. 1989;56:77–84. doi: 10.1016/0092-8674(89)90985-9. [DOI] [PubMed] [Google Scholar]
- 14.Gutmann DH, Saporito-Irwin S, DeClue JE, Wienecke R, Guha A. Alterations in the rap1 signaling pathway are common in human gliomas. Oncogene. 1997;15:1611–6. doi: 10.1038/sj.onc.1201314. [DOI] [PubMed] [Google Scholar]
- 15.Dupuy AJ, Morgan K, von Lintig FC, et al. Activation of the Rap1 guanine nucleotide exchange gene, CalDAG-GEF I, in BXH-2 murine myeloid leukemia. J Biol Chem. 2001;276:11804–11. doi: 10.1074/jbc.M008970200. [DOI] [PubMed] [Google Scholar]
- 16.Yajnik V, Paulding C, Sordella R, et al. DOCK4, a GTPase activator, is disrupted during tumorigenesis. Cell. 2003;112:673–84. doi: 10.1016/s0092-8674(03)00155-7. [DOI] [PubMed] [Google Scholar]
- 17.Hirata T, Nagai H, Koizumi K, et al. Amplification, up-regulation and over-expression of C3G (CRK SH3 domain-binding guanine nucleotide-releasing factor) in non–small cell lung cancers. J Hum Genet. 2004;49:290–5. doi: 10.1007/s10038-004-0148-1. [DOI] [PubMed] [Google Scholar]
- 18.Gao L, Feng Y, Bowers R, et al. Ras-associated protein-1 regulates extracellular signal-regulated kinase activation and migration in melanoma cells: two processes important to melanoma tumorigenesis and metastasis. Cancer Res. 2006;66:7880–8. doi: 10.1158/0008-5472.CAN-06-0254. [DOI] [PubMed] [Google Scholar]
- 19.Ishida D, Kometani K, Yang H, et al. Myeloproliferative stem cell disorders by deregulated Rap1 activation in SPA-1–deficient mice. Cancer Cell. 2003;4:55–65. doi: 10.1016/s1535-6108(03)00163-6. [DOI] [PubMed] [Google Scholar]
- 20.Altschuler DL, Ribeiro-Neto F. Mitogenic and oncogenic properties of the small G protein Rap1b. Proc Natl Acad Sci U S A. 1998;95:7475–9. doi: 10.1073/pnas.95.13.7475. [DOI] [PMC free article] [PubMed] [Google Scholar]
- 21.Gao Q, Singh L, Kumar A, Srinivasan S, Wazer DE, Band V. Human papillomavirus type 16 E6-induced degradation of E6TP1 correlates with its ability to immortalize human mammary epithelial cells. J Virol. 2001;75:4459–66. doi: 10.1128/JVI.75.9.4459-4466.2001. [DOI] [PMC free article] [PubMed] [Google Scholar]
- 22.Singh L, Gao Q, Kumar A, et al. The high-risk human papillomavirus type 16 E6 counters the GAP function of E6TP1 toward small Rap G proteins. J Virol. 2003;77:1614–20. doi: 10.1128/JVI.77.2.1614-1620.2003. [DOI] [PMC free article] [PubMed] [Google Scholar]
- 23.Bos JL, de Rooij J, Reedquist KA. Rap1 signalling: adhering to new models. Nat Rev Mol Cell Biol. 2001;2:369–77. doi: 10.1038/35073073. [DOI] [PubMed] [Google Scholar]
- 24.Hattori M, Minato N. Rap1 GTPase: functions, regulation, and malignancy. J Biochem (Tokyo) 2003;134:479–84. doi: 10.1093/jb/mvg180. [DOI] [PubMed] [Google Scholar]
- 25.Hogan BL, Kolodziej PA. Organogenesis: molecular mechanisms of tubulogenesis. Nat Rev Genet. 2002;3:513–23. doi: 10.1038/nrg840. [DOI] [PubMed] [Google Scholar]
- 26.Bissell MJ, Kenny PA, Radisky DC. Microenvironmental regulators of tissue structure and function also regulate tumor induction and progression: the role of extracellular matrix and its degrading enzymes. Cold Spring Harb Symp Quant Biol. 2005;70:343–56. doi: 10.1101/sqb.2005.70.013. [DOI] [PMC free article] [PubMed] [Google Scholar]
- 27.Muthuswamy SK, Li D, Lelievre S, Bissell MJ, Brugge JS. ErbB2, but not ErbB1, reinitiates proliferation and induces luminal repopulation in epithelial acini. Nat Cell Biol. 2001;3:785–92. doi: 10.1038/ncb0901-785. [DOI] [PMC free article] [PubMed] [Google Scholar]
- 28.Petersen OW, Ronnov-Jessen L, Howlett AR, Bissell MJ. Interaction with basement membrane serves to rapidly distinguish growth and differentiation pattern of normal and malignant human breast epithelial cells. Proc Natl Acad Sci U S A. 1992;89:9064–8. doi: 10.1073/pnas.89.19.9064. [DOI] [PMC free article] [PubMed] [Google Scholar]
- 29.Weaver VM, Petersen OW, Wang F, et al. Reversion of the malignant phenotype of human breast cells in three-dimensional culture and in vivo by integrin blocking antibodies. J Cell Biol. 1997;137:231–45. doi: 10.1083/jcb.137.1.231. [DOI] [PMC free article] [PubMed] [Google Scholar]
- 30.Wang F, Weaver VM, Petersen OW, et al. Reciprocal interactions between β1-integrin and epidermal growth factor receptor in three-dimensional basement membrane breast cultures: a different perspective in epithelial biology. Proc Natl Acad Sci U S A. 1998;95:14821–6. doi: 10.1073/pnas.95.25.14821. [DOI] [PMC free article] [PubMed] [Google Scholar]
- 31.Liu H, Radisky DC, Wang F, Bissell MJ. Polarity and proliferation are controlled by distinct signaling pathways downstream of PI3-kinase in breast epithelial tumor cells. J Cell Biol. 2004;164:603–12. doi: 10.1083/jcb.200306090. [DOI] [PMC free article] [PubMed] [Google Scholar]
- 32.Franke B, Akkerman JW, Bos JL. Rapid Ca2+-mediated activation of Rap1 in human platelets. EMBO J. 1997;16:252–9. doi: 10.1093/emboj/16.2.252. [DOI] [PMC free article] [PubMed] [Google Scholar]
- 33.Nelson WJ. Adaptation of core mechanisms to generate cell polarity. Nature. 2003;422:766–74. doi: 10.1038/nature01602. [DOI] [PMC free article] [PubMed] [Google Scholar]
- 34.Gobel V, Barrett PL, Hall DH, Fleming JT. Lumen morphogenesis in C. elegans requires the membrane-cytoskeleton linker erm-1. Dev Cell. 2004;6:865–73. doi: 10.1016/j.devcel.2004.05.018. [DOI] [PubMed] [Google Scholar]
- 35.Blatchford DR, Quarrie LH, Tonner E, McCarthy C, Flint DJ, Wilde CJ. Influence of microenvironment on mammary epithelial cell survival in primary culture. J Cell Physiol. 1999;181:304–11. doi: 10.1002/(SICI)1097-4652(199911)181:2<304::AID-JCP12>3.0.CO;2-5. [DOI] [PubMed] [Google Scholar]
- 36.Debnath J, Mills KR, Collins NL, Reginato MJ, Muthuswamy SK, Brugge JS. The role of apoptosis in creating and maintaining luminal space within normal and oncogene-expressing mammary acini. Cell. 2002;111:29–40. doi: 10.1016/s0092-8674(02)01001-2. [DOI] [PubMed] [Google Scholar]
- 37.Kirshner J, Chen CJ, Liu P, Huang J, Shively JE. CEACAM1–4S, a cell-cell adhesion molecule, mediates apoptosis and reverts mammary carcinoma cells to a normal morphogenic phenotype in a 3D culture. Proc Natl Acad Sci U S A. 2003;100:521–6. doi: 10.1073/pnas.232711199. [DOI] [PMC free article] [PubMed] [Google Scholar]
- 38.Reginato MJ, Mills KR, Becker EB, et al. Bim regulation of lumen formation in cultured mammary epithelial acini is targeted by oncogenes. Mol Cell Biol. 2005;25:4591–601. doi: 10.1128/MCB.25.11.4591-4601.2005. [DOI] [PMC free article] [PubMed] [Google Scholar]
- 39.Boudreau N, Sympson CJ, Werb Z, Bissell MJ. Suppression of ICE and apoptosis in mammary epithelial cells by extracellular matrix. Science. 1995;267:891–3. doi: 10.1126/science.7531366. [DOI] [PMC free article] [PubMed] [Google Scholar]
- 40.Huang CC, You JL, Wu MY, Hsu KS. Rap1-induced p38 mitogen-activated protein kinase activation facilitates AMPA receptor trafficking via the GDI.Rab5 complex. Potential role in (S)-3,5-dihydroxyphenylglycene–induced long term depression. J Biol Chem. 2004;279:12286–92. doi: 10.1074/jbc.M312868200. [DOI] [PubMed] [Google Scholar]
- 41.Luo J, Manning BD, Cantley LC. Targeting the PI3K-Akt pathway in human cancer: rationale and promise. Cancer Cell. 2003;4:257–62. doi: 10.1016/s1535-6108(03)00248-4. [DOI] [PubMed] [Google Scholar]
- 42.Bissell MJ, Rizki A, Mian IS. Tissue architecture: the ultimate regulator of breast epithelial function. Curr Opin Cell Biol. 2003;15:753–62. doi: 10.1016/j.ceb.2003.10.016. [DOI] [PMC free article] [PubMed] [Google Scholar]
- 43.Leonard GD, Swain SM. Ductal carcinoma in situ, complexities and challenges. J Natl Cancer Inst. 2004;96:906–20. doi: 10.1093/jnci/djh164. [DOI] [PubMed] [Google Scholar]
- 44.Mills KR, Reginato M, Debnath J, Queenan B, Brugge JS. Tumor necrosis factor–related apoptosis-inducing ligand (TRAIL) is required for induction of autophagy during lumen formation in vitro. Proc Natl Acad Sci U S A. 2004;101:3438–43. doi: 10.1073/pnas.0400443101. [DOI] [PMC free article] [PubMed] [Google Scholar]
- 45.Bissell MJ, Radisky DC, Rizki A, Weaver VM, Petersen OW. The organizing principle: microenvironmental influences in the normal and malignant breast. Differentiation. 2002;70:537–46. doi: 10.1046/j.1432-0436.2002.700907.x. [DOI] [PMC free article] [PubMed] [Google Scholar]
- 46.Fish EM, Molitoris BA. Alterations in epithelial polarity and the pathogenesis of disease states. N Engl J Med. 1994;330:1580–8. doi: 10.1056/NEJM199406023302207. [DOI] [PubMed] [Google Scholar]
- 47.Paszek MJ, Zahir N, Johnson KR, et al. Tensional homeostasis and the malignant phenotype. Cancer Cell. 2005;8:241–54. doi: 10.1016/j.ccr.2005.08.010. [DOI] [PubMed] [Google Scholar]
- 48.Wang F, Hansen RK, Radisky D, et al. Phenotypic reversion or death of cancer cells by altering signaling pathways in three-dimensional contexts. J Natl Cancer Inst. 2002;94:1494–503. doi: 10.1093/jnci/94.19.1494. [DOI] [PMC free article] [PubMed] [Google Scholar]
- 49.Lau N, Uhlmann EJ, Von Lintig FC, et al. Rap1 activity is elevated in malignant astrocytomas independent of tuberous sclerosis complex-2 gene expression. Int J Oncol. 2003;22:195–200. [PubMed] [Google Scholar]
- 50.Sheta EA, Harding MA, Conaway MR, Theodorescu D. Focal adhesion kinase, Rap1, and transcriptional induction of vascular endothelial growth factor. J Natl Cancer Inst. 2000;92:1065–73. doi: 10.1093/jnci/92.13.1065. [DOI] [PubMed] [Google Scholar]